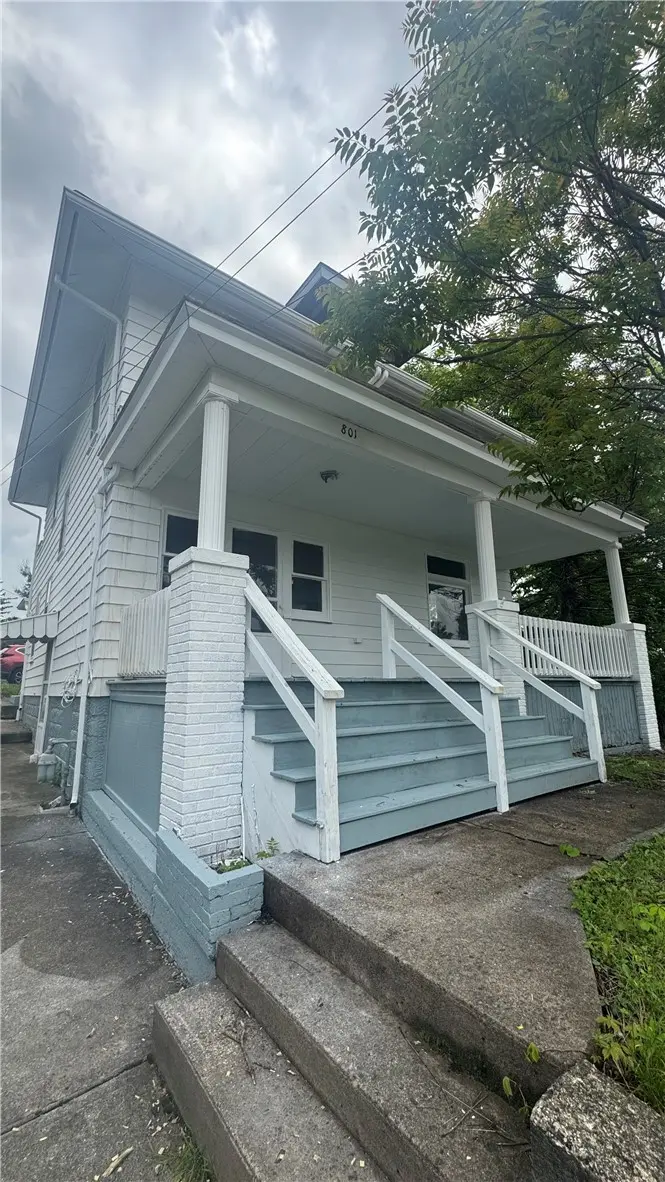
801 Grant St · Belle Vernon, PA
Flood risk 1/10 · Minimal
- FEMA flood zone
- X (unshaded)
- Chance of flooding over 30 yrs
- 0.0%
- Est. flood insurance / yr
- $473 – $860
Fire risk 1/10 · Minimal
- Est. fire insurance / yr
- $511 – $949
Heat risk 4/10 · Minor
- Hot days now (above 98°F)
- 7 days/yr
- Hot days in 30 yrs
- 19 days/yr
Wind risk 2/10 · Minimal
- Chance of severe wind over 30 yrs
- —
Air-quality risk 2/10 · Minimal
- Unhealthy air days now
- 1 days/yr
- Unhealthy air days in 30 yrs
- 2 days/yr
Risk factors via First Street. Map © Google.
Why this score? — see what drove the B- grade
The composite is a weighted blend of 9 inputs, each scored 0–100. Each bar is that input's sub-score; the figure is the points it added to the 100-point composite (weight × sub-score).
- Cash flow +23.5/30.0
- Appreciation +10.0/10.0
- DSCR +7.6/10.0
- ARV discount +7.5/15.0
- 1% rule +5.9/10.0
- Schools +3.9/10.0
- Livability +3.4/5.0
- Rent growth +2.5/5.0
- Condition / age +2.5/5.0
$136,000
🖨 Deal sheet 📄 Offer letter ✓ Due diligence
Listing remarks
Welcome to 801 Grant Street in Belle Vernon! This beautifully refreshed 4 bedroom, 2 bath home offers the space, updates, and convenience you’ve been looking for. Recently renovated with fresh paint throughout, new flooring, and updated light fixtures, the home feels clean, bright, and move-in ready. The first floor features a convenient full bathroom, while all four spacious bedrooms are located upstairs along with an additional full bath in the hallway. Ideally located near Broad Avenue, you’ll have easy access to local dining, shopping, and everyday amenities. A great opportunity to settle into a home that combines comfort, updates, and convenience.
Key facts
- Full bathroom
- Everyday amenities
- Local shopping
Tags
Property features AI
Exterior
- Parking: Off-street parking (1 space)
- Utilities: Public water; Public sewer
- Home design: 2-story home; Resale property
- Construction: Vinyl siding; Asphalt roof
- Exterior features: Public transportation nearby
Interior
- Kitchen: Refrigerator; Stove; Some gas appliances
- Flooring: Carpet; Laminate
- Bathrooms: 2 full bathrooms
- Heating & cooling: Forced air gas heating; Central air conditioning
- Interior features: Carpet flooring; Laminate flooring
Neighborhood map
What this means for you Summary
Snapshot
- This is a 5-bed/2.0-bath other listed at $136k.
Deal economics
- At list price, monthly cash flow is $255 ($3k/yr) — positive.
- The deal already cash-flows at list — no discount required.
- Meets the 1% rule at list price ($1k rent vs $136k).
- Recommended offer: $134k (1.5% below list) — sets the bar for market timing.
Location & tenants
- Location reads 68/100 on livability (#894 in PA) — a middle-class / working-renter tenant base. Strengths: cost of living A+, housing A+; Watch: commute D+, health & safety D+, amenities F.
- Belle Vernon Area SD (suburban): math 34% / reading 56% proficiency, ranked #267 of 539 in PA (top 50%) — families likely to look elsewhere, expect single-tenant / working-renter base with shorter leases.
- Market conditions: 93 active listings in the ZIP; 201 units permitted in Fayette County in 2024 (10 in 5+ unit buildings).
Forward outlook
- In year one you build about $15k of equity ($940 loan paydown + $14k appreciation (10.0% local appreciation)).
- Fayette County population projected at -19% by 2050 — secular population decline; favor cash flow + early exit over multi-decade hold.
- At projected returns (10.0% appreciation + 3.0% rent growth), your $38k cash investment doubles in ~3 years — after that, you're playing with house money.
- By year 3, paydown + projected appreciation supports a ~$37k cash-out refi (75% LTV) — recoverable capital for the next deal without selling this one.
Negotiation context
- It's been on market 17 days — a 2% lower offer ($134k) is reasonable based on typical stale-listing flexibility.
Risks & watch-outs
- Watch-outs: built in 1923 — expect roof / HVAC / electrical / plumbing capex.
Questions for the listing agent
- Built in 1923 — when were the roof, HVAC, electrical panel, plumbing, and water heater last replaced?
- Is there a deadline driving the sale (1031 exchange, divorce, estate, relocation)? That informs how much negotiation room exists.
- What's the average days-on-market for RENTAL listings here right now (not sales)? A rising rental-DOM trend means longer vacancies and softer asking-rent achievability than the comps imply.
- What's the recent tenant-quality profile in this submarket — average credit score on applications, eviction rate, late-payment / NSF rate, and stable-employment percentage? A property-management company in the area should have these aggregated.
- How much new for-sale + rental construction is in the pipeline within 1–3 miles? Heavy new supply typically softens prices + rents 12–24 months out; constrained supply supports both.
Investment metrics
- 1% rule
- 1.09% ✓
- Cap rate
- 8.54%
- Cash-on-cash
- 8.03%
- DSCR
- 1.36
- GRM
- 7.6
CMA / ARV
No comps found within radius.
Projected returns pro-forma
10.0% appreciation · 3.0% rent growth · sell at horizon
- IRR
- 30.1%
- Equity multiple
- 3.37×
- Total profit
- $90,300
- Equity at exit
- $122,520
- IRR
- 26.1%
- Equity multiple
- 7.65×
- Total profit
- $253,183
- Equity at exit
- $264,218
Cash invested: $38,080 (down + closing). Projections, not guarantees.
Landlord ↔ Tenant lean methodology
- Overall (STATE)
- 62 Landlord-Friendly
- State Pennsylvania
- 62 Landlord-Friendly · EVEN
- County
- — inherits STATE
- City
- — inherits STATE
ZIP-level market 15012
- Home prices YoY
- 5.9%
- Active inventory
- 93
- Price-to-rent
- 7.6×
Monthly cashflow live
- Estimated rent
- $1,487 medium interval (Pro) →
- Mortgage (P&I)
- −$713
- Tax from tax record
- −$150 /mo · $1,801/yr
- Insurance
- −$57
- HOA
- −$0
- Vacancy / Maint / Mgmt
- −$312
- Net cashflow
- $255
Break-even live
UW: 25.0% down · 7.5% · 30yr · 1.5% tax · 5.0% vac · 8.0% maint · 8.0% mgmt
Financing live
Cash to close
- Down payment
- $34,000
- Closing costs
- $4,080
- Reserves months
- —
- Total cash needed
- —
Loan-product check · same deal, 3 products live
Conventional
25% down · 7.5% · 30yr
- Down + closing
- —
- Monthly P&I
- —
- Monthly cashflow
- —
- DSCR
- —
- Eligible?
- —
Personal DTI + credit; lowest rate.
DSCR
20% down · 8.5% · 30yr
- Down + closing
- —
- Monthly P&I
- —
- Monthly cashflow
- —
- DSCR
- —
- Eligible?
- —
No personal income docs; deal must DSCR.
Hard money
10% down · 12.0% · 12mo
- Down + closing
- —
- Monthly P&I
- —
- Monthly cashflow
- —
- DSCR
- —
- Eligible?
- —
Short-term bridge; refi at stabilization.
Listing history 11 events
-
2026-06-18days on market $136,000 Active 17 DOM
-
2026-06-17days on market $136,000 Active 16 DOM
-
2026-06-16days on market $136,000 Active 15 DOM
-
2026-06-15days on market $136,000 Active 14 DOM
-
2026-06-13days on market $136,000 Active 12 DOM
-
2026-06-09days on market $136,000 Active 8 DOM
-
2026-06-08days on market $136,000 Active 7 DOM
-
2026-06-07days on market $136,000 Active 6 DOM
-
2026-06-03days on market $136,000 Active 2 DOM
-
2026-06-02remarks 660-char remark
-
2026-06-02$136,000 Active 1 DOM
ⓘ Source: listings_history table (triggers on properties + properties_extension) + one-shot
backfill from property_details.listing_events for pre-trigger history.
Tax reassessment forecast PA · Partial reset (capped growth)
- Current annual tax
- $1,801 · $150/mo
- Projected year-2 tax
- $1,975 · $165/mo
- Expected delta
- +$174/yr (+$15/mo · 9.7%)
ⓘ Screening estimate from a state-policy table — verify with the county assessor before closing.
Climate risk First Street
- Flood 1/10 Low FEMA zone X (unshaded) · 0% chance over 30 yrs
- Wildfire 1/10 Low
- Heat 4/10 Moderate 7 d/yr ≥98°F today · 19 d/yr by 30 yrs out
- Wind 2/10 Low
- Air quality 2/10 Low 1 unhealthy d/yr today · 2 by 30 yrs out
Nearby sold comps map
Loading sold comps map…
Walkable amenities ~0.75 mi
Loading nearby amenities…
Taxation est. · year 1
- Rental income
- $17,842
- − Mortgage interest
- −$7,618
- − Property taxes
- −$1,801
- − Insurance
- −$680
- − Repairs & maintenance
- −$1,427
- − Management
- −$1,427
- − Depreciation
- −$3,956
- Taxable income
- $932
- Est. tax owed @ 24.0%
- −$224
- After-tax cash flow
- $2,832/yr
For passive investors: Depreciation is non-cash, so a rental often shows a tax loss while cash-flowing — sheltering income. Rental losses are passive: they offset passive income freely, and up to $25,000/yr can offset ordinary (W-2) income if you actively participate and your MAGI is under $100k (phasing out to $0 by $150k); unused losses carry forward. On sale, claimed depreciation is recaptured at up to 25%, and gains may owe capital-gains tax (a 1031 exchange can defer both). Figures are a year-1 estimate at your 24.0% rate — not tax advice; consult a CPA.
Schools (NCES district)
- District
- Belle Vernon Area SD
- NCES district ID
- 4203210
- Math proficiency
- 34% ▼ -15.00%
- Reading proficiency
- 56% ▼ -13.00%
- Median HH income
- $51,784
- Composite
- 38.72/100
- National rank
- #4134
- State rank
- #267 of 539 in PA
Livability — Belle Vernon
- Score
- 68/100
- State rank
- #894
- US rank
- #9529
Category grades
Schools grade is shown separately in the Schools card above.
Census & demographics
- Census place
- Belle Vernon, PA
- Population (ZIP)
- 15,294
Population outlook (Fayette County) Hauer SSP2
- Today (2025)
- 127,561 people
- By 2030
- 123,206 · -3.4%
- By 2040
- 113,232 · -11.2%
- By 2050
- 103,468 · -18.9%
- By 2075
- 83,185 · -34.8%
- By 2100
- 62,384 · -51.1%
Race, ethnicity, and origin ACS 2023
- Neighborhood character
- Predominantly White (90%)
- Race & ethnicity
- White 90% Black 4% Two or more races 3% Hispanic / Latino 2% Asian 1%
- Common ancestry
- Romanian 10% Slovak 4% Scotch-Irish 2%
- Foreign-born
- 2% · Canada, India, China
- Languages at home
- 97% English-only · Spanish 2% Other Indo-European 1%
Political lean MEDSL · Fayette
- 2024 margin
- Solid R (+37.9) · D 30.8% · R 68.7%
- 2008→2024 swing
- -37.5pp toward R · 2008: -0.4pp · 2024: -37.9pp
- All cycles
- 2024: R+37.9 2020: R+33.5 2016: R+31.0 2012: R+8.3 2008: R+0.4
Not yet ingested
- Civics
- —
Market trends
- HPI YoY
- ▲ 14.36%
- Current HPI
- 258.8202
- Rent YoY
- —
- Metro
- —
- State GDP YoY
- ▲ 1.68%
- F500 in state
- 34
Industry mix (Fortune 500 HQ in PA)
| Industry | F500 HQs | Revenue |
|---|---|---|
| Healthcare | 2 | $309B |
|
||
| Insurance | 2 | $27B |
|
||
| Telecommunications / Media | 1 | $124B |
|
||
| Industrial Distribution | 1 | $22B |
|
||
| Financial Services | 1 | $20B |
|
||
| Chemicals / Materials | 1 | $18B |
|
||
Price history
1 event — show timeline
- 2026-06-01 Listed $136,000 West Penn MLS
Property tax history
+3.0%/yrLatest (2026): $1,801 · +4.3% YoY. Source: county tax records.
Cash-flow waterfall
monthlySold comps — $/sqft
last 12 mo · ≤1 miLoading sold comps…