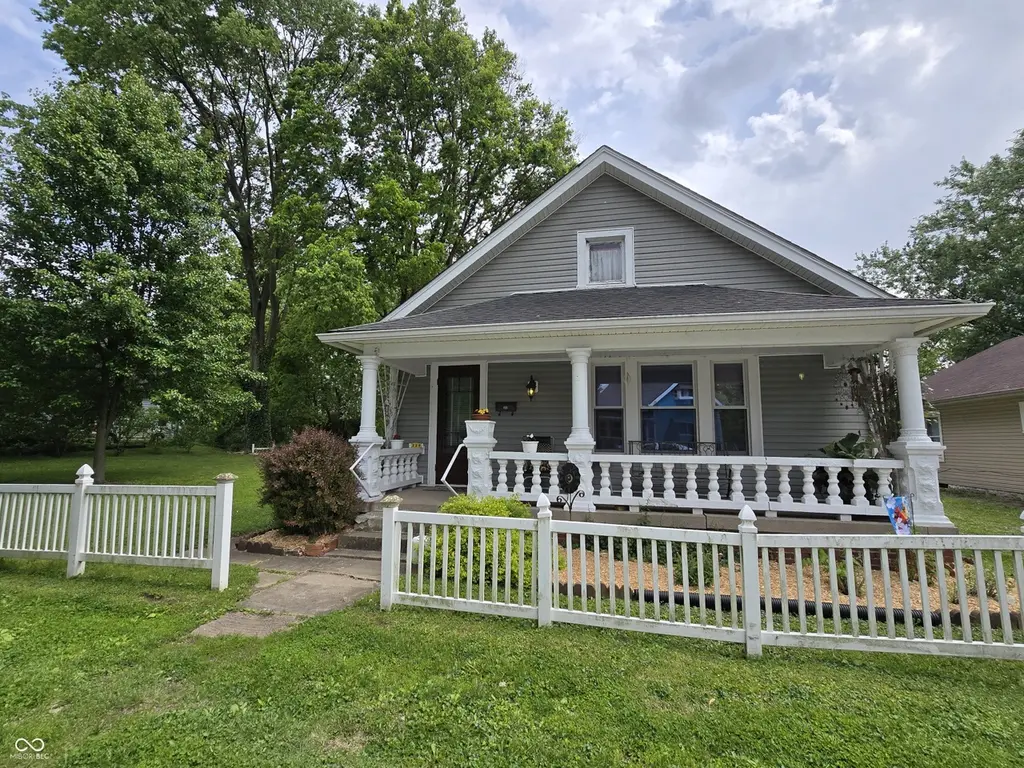
229 Bakemeyer St · Indianapolis city (balance), IN
Flood risk 6/10 · Moderate
- FEMA flood zone
- X (unshaded)
- Chance of flooding over 30 yrs
- 0.71%
- Est. flood insurance / yr
- $507 – $1,088
Fire risk 1/10 · Minimal
- Est. fire insurance / yr
- $717 – $1,331
Heat risk 3/10 · Minor
- Hot days now (above 101°F)
- 6 days/yr
- Hot days in 30 yrs
- 17 days/yr
Wind risk 2/10 · Minimal
- Chance of severe wind over 30 yrs
- 1.0%
Air-quality risk 3/10 · Minor
- Unhealthy air days now
- 2 days/yr
- Unhealthy air days in 30 yrs
- 3 days/yr
Risk factors via First Street. Map © Google.
Why this score? — see what drove the D grade
The composite is a weighted blend of 9 inputs, each scored 0–100. Each bar is that input's sub-score; the figure is the points it added to the 100-point composite (weight × sub-score).
- Cash flow +13.0/30.0
- ARV discount +11.5/15.0
- Rent growth +5.0/5.0
- DSCR +3.9/10.0
- 1% rule +2.7/10.0
- Livability +2.5/5.0
- Condition / age +2.5/5.0
- Schools +1.4/10.0
- Appreciation +0.0/10.0
$164,900
🖨 Deal sheet 📄 Offer letter ✓ Due diligence
Listing remarks MLS
Very well maintain 2 bedroom home. Updates include windows, furnace, a/c, water heater. Property sits on 2 spacious lots. Hardwoods under carpet. Great first time homebuyer or investment. All appliances stay. Pro perty being sold 'As Is'.
Key facts
- Lush green space
- Original woodwork
- Oversized lot
Tags
Property features AI
Finance
- Other: Approximately 0.46 acre lot (1/4–1/2 acre)
Exterior
- Parking: Detached 2-car garage (576 sq ft)
- Utilities: Public water; Municipal sewer connected; Cable available; Electricity connected; Natural gas connected
- Home design: Single family residence; One story
- Construction: Vinyl siding; Block foundation
- Exterior features: Covered patio; Patio; City lot; Mature trees; Small trees (under 20 ft)
Interior
- Kitchen: Gas oven; Refrigerator
- Bedrooms: 2 bedrooms (both on the main level)
- Flooring: Hardwood floors
- Bathrooms: 1 full bathroom (main level)
- Heating & cooling: Forced air heating (natural gas); Central air conditioning
- Interior features: Hardwood floors; Eat-in kitchen; Cellar
- Laundry & utility: Laundry connections throughout
Neighborhood map
What this means for you Summary
Snapshot
- This is a 2-bed/1.0-bath single-family listed at $165k.
Deal economics
- At list price, monthly cash flow is $-11 ($-126/yr) — negative.
- To cash-flow at today's rent, offer at most $163k (1.1% below list).
- To meet the 1% rule (rent ≥ 1% of price), the offer needs to be $126k (23.3% below list).
- Recommended offer: $126k (23.3% below list) — sets the bar for 1% rule.
- Cap rate 6.2% vs local median 4.4% in Indianapolis city (balance) — top-decile yield for the area; either an underpriced asset or a hidden risk that comps aren't pricing in. Stress-test before assuming the spread holds.
Location & tenants
- Location reads: area grade D — affects rentability + tenant quality, not the cash-flow math above.
- Indianapolis Public Schools (urban): math 14% / reading 20% proficiency, ranked #286 of 301 in IN (top 95%) — low school quality limits family demand, transient renter base, plan for 1-2y turnover; 77% free/reduced lunch — lower-income household profile, screen leases tightly.
- Market conditions: Rents rising fast (+11.0%/yr); 129 active listings in the ZIP; 30 comparable units currently listed for rent nearby; rentals at typical pace (median 24d on market — plan ~3-4 weeks tenant-placement turnaround); 1,906 units permitted in Marion County in 2024 (621 in 5+ unit buildings).
Forward outlook
- Local home prices are declining (-3.0%/yr); year-one equity from $1k of loan paydown is wiped out by about $5k of value loss. Plan a longer hold.
- Marion County population projected at +18% by 2050 — long-run rental-demand tailwind backs the buy-and-hold thesis.
Negotiation context
- It's been on market 45 days — a 3% lower offer ($160k) is reasonable based on typical stale-listing flexibility.
- 2 sale attempts since 20y ago; this cycle's ask has dropped $15k (8%) from the opening price — seller is motivated, your offer sets the floor, not the list.
- Current owner paid $63k; list at $165k implies a 163% gain — meaningful room to come down on a strong offer.
Risks & watch-outs
- Watch-outs: built in 1909 — expect roof / HVAC / electrical / plumbing capex.
- Climate carrying-cost: major flood risk — expect insurance premiums to compound above CPI over the hold.
Questions for the listing agent
- What do current leases actually rent for vs. the listed asking? Can we see a recent rent roll and the last 12 months of T-12 income?
- It's been on market 45 days. Have you received any prior offers? Is the seller open to a 23% concession, seller financing, or rate buy-down credit?
- Built in 1909 — when were the roof, HVAC, electrical panel, plumbing, and water heater last replaced?
- Is there a deadline driving the sale (1031 exchange, divorce, estate, relocation)? That informs how much negotiation room exists.
- The area grade is low — what's the realistic commute time and amenity access for the typical tenant pool here? Any planned neighborhood developments (good or bad) we should know about?
- What's the average days-on-market for RENTAL listings here right now (not sales)? A rising rental-DOM trend means longer vacancies and softer asking-rent achievability than the comps imply.
- What's the recent tenant-quality profile in this submarket — average credit score on applications, eviction rate, late-payment / NSF rate, and stable-employment percentage? A property-management company in the area should have these aggregated.
- How much new for-sale + rental construction is in the pipeline within 1–3 miles? Heavy new supply typically softens prices + rents 12–24 months out; constrained supply supports both.
Investment metrics
- 1% rule
- 0.77% ✗
- Cap rate
- 6.22%
- Cash-on-cash
- -0.27%
- DSCR
- 0.99
- GRM
- 10.9
CMA / ARV
- ARV (median comp)
- $180,923
- List price
- $164,900
- Delta
- -8.86%
- Verdict
- FAIR
- Comps
- 20 within 1.0 mi
Show comp detail 12 sales within ~0.75 mi
| Address | Dist | Beds/Ba | Sqft | Sold | Price | $/sf | Match |
|---|---|---|---|---|---|---|---|
| 32 Bakemeyer St | 0.25mi | 3/1.5 (+1) | 1,104 (-1%) | 2mo | $165,000 | $149 | 77 |
| 44 Bakemeyer St | 0.23mi | 3/2.0 (+1) | 1,104 (-1%) | 6mo | $177,500 | $161 | 73 |
| 321 Gimber Ct | 0.15mi | 3/1.5 (+1) | 1,200 (+7%) | 6mo | $182,500 | $152 | 69 |
| 113 W Gimber St | 0.16mi | 2/1.0 | 1,008 (-10%) | 10mo | $170,000 | $169 | 68 |
| 2828 S Illinois St | 0.25mi | 3/1.0 (+1) | 1,224 (+9%) | 2mo | $182,000 | $149 | 66 |
| 2810 S Pennsylvania St | 0.44mi | 2/1.0 | 1,076 (-4%) | 8mo | $190,000 | $177 | 66 |
| 121 W Gimber St | 0.14mi | 3/1.5 (+1) | 1,008 (-10%) | 5mo | $193,000 | $191 | 66 |
| 110 Pennsylvania Ct | 0.46mi | 3/1.0 (+1) | 1,202 (+7%) | 4mo | $115,000 | $96 | 58 |
| 346 Gimber Ct | 0.12mi | 3/2.0 (+1) | 1,272 (+14%) | 7mo | $196,000 | $154 | 57 |
| 2501 Ransdell St | 0.72mi | 3/1.5 (+1) | 1,104 (-1%) | 0mo | $108,000 | $98 | 57 |
| 2825 S Delaware St | 0.56mi | 3/1.0 (+1) | 1,035 (-8%) | 6mo | $200,000 | $193 | 51 |
| 408 Gimber Ct | 0.13mi | 3/2.0 (+1) | 1,272 (+14%) | 20mo | $188,000 | $148 | 45 |
Match score weights: distance 35% · size 25% · config 20% · recency 20%. Top-matched comps best support the ARV.
Projected returns pro-forma
-3.0% appreciation · 8.0% rent growth · sell at horizon
- IRR
- -11.9%
- Equity multiple
- 0.55×
- Total profit
- $-20,772
- Equity at exit
- $24,587
- IRR
- 2.8%
- Equity multiple
- 1.24×
- Total profit
- $11,207
- Equity at exit
- $14,258
Cash invested: $46,172 (down + closing). Projections, not guarantees.
Landlord ↔ Tenant lean methodology
- Overall (STATE)
- 90 Strongly Landlord-Friendly
- State Indiana
- 90 Strongly Landlord-Friendly · R+11
- County
- — inherits STATE
- City
- — inherits STATE
ZIP-level market 46225
- Home prices YoY
- -8.2%
- Rents YoY
- 11.0%
- Active inventory
- 129
- Price-to-rent
- 10.9×
Monthly cashflow live
- Estimated rent
- $1,264 high interval (Pro) →
- Mortgage (P&I)
- −$865
- Tax from tax record
- −$76 /mo · $908/yr
- Insurance
- −$69
- HOA
- −$0
- Vacancy / Maint / Mgmt
- −$265
- Net cashflow
- $-11
Break-even live
UW: 25.0% down · 7.5% · 30yr · 1.5% tax · 5.0% vac · 8.0% maint · 8.0% mgmt
Financing live
Cash to close
- Down payment
- $41,225
- Closing costs
- $4,947
- Reserves months
- —
- Total cash needed
- —
Loan-product check · same deal, 3 products live
Conventional
25% down · 7.5% · 30yr
- Down + closing
- —
- Monthly P&I
- —
- Monthly cashflow
- —
- DSCR
- —
- Eligible?
- —
Personal DTI + credit; lowest rate.
DSCR
20% down · 8.5% · 30yr
- Down + closing
- —
- Monthly P&I
- —
- Monthly cashflow
- —
- DSCR
- —
- Eligible?
- —
No personal income docs; deal must DSCR.
Hard money
10% down · 12.0% · 12mo
- Down + closing
- —
- Monthly P&I
- —
- Monthly cashflow
- —
- DSCR
- —
- Eligible?
- —
Short-term bridge; refi at stabilization.
Rent comps 30 comps
| Address | Beds | Baths | Sqft | Rent | $/sqft | DOM | Units | Dist |
|---|---|---|---|---|---|---|---|---|
| 2859 S Meridian St Indianapolis, IN | 1.0–2.0 | 1.0 | 771 | $906 | $1.17 | 23d | 2 | 0.35mi |
| 2859 S Meridian St Indianapolis, IN | 1.0–2.0 | 1.0 | 771 | $906 | $1.17 | 43d | 2 | 0.35mi |
| 110 Pennsylvania Ct Indianapolis, IN | 3.0 | 2.0 | 1202 | $1,700 | $1.41 | 4d | 1 | 0.44mi |
| 2904 S Pennsylvania St Indianapolis, IN | 1.0 | 1.0 | 750 | $725 | $0.97 | 23d | 2 | 0.47mi |
| 2314 Union St Indianapolis, IN | 3.0 | 2.0 | 892 | $1,295 | $1.45 | 43d | 1 | 0.55mi |
| 265 E Southern Ave Indianapolis, IN | 1.0–2.0 | 1.0 | 800 | $1,150 | $1.44 | 2d | 2 | 0.65mi |
| 2760 S East St Indianapolis, IN | 2.0–3.0 | 2.0 | 1072 | $895 | $0.83 | 3d | 3 | 0.77mi |
| 2770 S East St Apt 103 Indianapolis, IN | 3.0 | 2.0 | 1190 | $1,045 | $0.88 | 14d | 1 | 0.78mi |
| 2770 South East St Unit 302 Indianapolis, IN | 3.0 | 2.0 | 1158 | $1,015 | $0.88 | 3d | 1 | 0.78mi |
| 2236 Ransdell St Indianapolis, IN | 2.0 | 1.0 | 850 | $1,150 | $1.35 | 43d | 1 | 0.83mi |
| 2209 Ransdell St Indianapolis, IN | 2.0 | 1.0 | 710 | $900 | $1.27 | 43d | 1 | 0.90mi |
| 3500 Bluff Rd Indianapolis, IN | 2.0 | 2.0 | 781 | $1,399 | $1.79 | 4d | 5 | 0.97mi |
| 1819 Union St Unit 1817 Indianapolis, IN | 3.0 | 2.0 | 1020 | $1,199 | $1.18 | 43d | 1 | 1.06mi |
| 1756 Delaware St Indianapolis, IN | 3.0 | 2.0 | 1014 | $1,300 | $1.28 | 43d | 1 | 1.14mi |
| 1756 S Delaware St Unit 1754 Indianapolis, IN | 3.0 | 2.0 | 1014 | $1,300 | $1.28 | 14d | 1 | 1.14mi |
| 2109 Singleton St Indianapolis, IN | 3.0 | 2.0 | 1340 | $2,100 | $1.57 | 7d | 1 | 1.15mi |
| 224 Iowa St Indianapolis, IN | 3.0 | 1.0 | 1254 | $1,450 | $1.16 | 23d | 1 | 1.22mi |
| 438 E Beecher St Indianapolis, IN | 3.0 | 2.5 | 1500 | $1,450 | $0.97 | 23d | 1 | 1.23mi |
| 620 E Beecher St Indianapolis, IN | 3.0 | 2.0 | 1072 | $1,639 | $1.53 | 19d | 1 | 1.29mi |
| 2555 Shelby St Unit 2559 Indianapolis, IN | 1.0 | 1.0 | 717 | $1,250 | $1.74 | 43d | 1 | 1.32mi |
| 2948 Shelby St Unit D Indianapolis, IN | 2.0 | 1.0 | 750 | $1,025 | $1.37 | 43d | 1 | 1.33mi |
| 1524 S Talbott St #3 Indianapolis, IN | 1.0 | 1.0 | 1011 | $725 | $0.72 | 7d | 1 | 1.34mi |
| 1011 E Raymond St Indianapolis, IN | 2.0 | 2.0 | 1100 | $1,350 | $1.23 | 23d | 1 | 1.35mi |
| 1461 S Meridian St Unit A Indianapolis, IN | 1.0 | 1.0 | 800 | $950 | $1.19 | 43d | 1 | 1.36mi |
| 1833 Orleans St Unit 1 Indianapolis, IN | 3.0 | 1.0 | 1260 | $1,350 | $1.07 | 43d | 1 | 1.38mi |
| 2103 Ringgold Ave Indianapolis, IN | 1.0 | 1.0 | 1090 | $775 | $0.71 | 14d | 1 | 1.39mi |
| 1144 McDougal St Indianapolis, IN | 3.0 | 1.0 | 876 | $1,500 | $1.71 | 21d | 1 | 1.40mi |
| 512 E Minnesota St Unit 203 Indianapolis, IN | 2.0 | 1.0 | 903 | $1,195 | $1.32 | 23d | 1 | 1.42mi |
| 823 Iowa St Indianapolis, IN | 2.0 | 1.0 | 812 | $1,100 | $1.35 | 43d | 1 | 1.48mi |
| 1436 S New Jersey St Unit A Indianapolis, IN | 3.0 | 2.5 | 1300 | $2,100 | $1.62 | 23d | 1 | 1.49mi |
Listing history 16 events
-
2026-06-18days on market $164,900 Active 45 DOM
-
2026-06-17days on market $164,900 Active 44 DOM
-
2026-06-16days on market $164,900 Active 43 DOM
-
2026-06-15days on market $164,900 Active 42 DOM
-
2026-06-13days on market $164,900 Active 40 DOM
-
2026-06-13days on market $164,900 Active 39 DOM
-
2026-06-09pricedays on market $164,900 Active 36 DOM
-
2026-06-08days on market $177,500 Active 35 DOM
-
2026-06-07days on market $177,500 Active 34 DOM
-
2026-06-03days on market $177,500 Active 30 DOM
-
2026-06-02days on market $177,500 Active 29 DOM
-
2026-06-01days on market $177,500 Active 28 DOM
-
2026-05-31days on market $177,500 Active 27 DOM
-
2026-05-04$179,500 Active 841-char remark
-
2006-10-16soldstatus $62,670 245-char remark
Show marketing remark (245 chars)
Very well maintain 2 bedroom home. Updates include windows, furnace, a/c, water heater. Property sits on 2 spacious lots. Hardwoods under carpet. Great first time homebuyer or investment. All appliances stay. Pro perty being sold 'As Is'.
-
2006-07-14$64,900 245-char remark
Show marketing remark (245 chars)
Very well maintain 2 bedroom home. Updates include windows, furnace, a/c, water heater. Property sits on 2 spacious lots. Hardwoods under carpet. Great first time homebuyer or investment. All appliances stay. Pro perty being sold 'As Is'.
ⓘ Source: listings_history table (triggers on properties + properties_extension) + one-shot
backfill from property_details.listing_events for pre-trigger history.
Tax reassessment forecast IN · Partial reset (capped growth)
- Current annual tax
- $908 · $76/mo
- Projected year-2 tax
- $1,155 · $96/mo
- Expected delta
- +$247/yr (+$21/mo · 27.1%)
ⓘ Screening estimate from a state-policy table — verify with the county assessor before closing.
Climate risk First Street
- Flood 6/10 Major FEMA zone X (unshaded) · 71% chance over 30 yrs
- Wildfire 1/10 Low
- Heat 3/10 Moderate 6 d/yr ≥101°F today · 17 d/yr by 30 yrs out
- Wind 2/10 Low 100% chance of damaging wind over 30 yrs
- Air quality 3/10 Moderate 2 unhealthy d/yr today · 3 by 30 yrs out
Nearby sold comps map
Loading sold comps map…
Walkable amenities ~0.75 mi
Loading nearby amenities…
Taxation est. · year 1
- Rental income
- $15,169
- − Mortgage interest
- −$9,237
- − Property taxes
- −$908
- − Insurance
- −$824
- − Repairs & maintenance
- −$1,214
- − Management
- −$1,214
- − Depreciation
- −$4,797
- Taxable loss
- −$3,025
- Est. tax savings @ 24.0%
- +$726
- After-tax cash flow
- $600/yr
For passive investors: Depreciation is non-cash, so a rental often shows a tax loss while cash-flowing — sheltering income. Rental losses are passive: they offset passive income freely, and up to $25,000/yr can offset ordinary (W-2) income if you actively participate and your MAGI is under $100k (phasing out to $0 by $150k); unused losses carry forward. On sale, claimed depreciation is recaptured at up to 25%, and gains may owe capital-gains tax (a 1031 exchange can defer both). Figures are a year-1 estimate at your 24.0% rate — not tax advice; consult a CPA.
Schools (NCES district)
- District
- Indianapolis Public Schools
- NCES district ID
- 1804770
- Math proficiency
- 14% ▼ -7.00%
- Reading proficiency
- 20% ▼ -3.00%
- Median HH income
- $32,034
- Composite
- 13.69/100
- National rank
- #9499
- State rank
- #286 of 301 in IN
Livability — Indianapolis city (balance)
No livability data for this city. (Only ~50 U.S. cities are tracked.)
Census & demographics
- Census place
- Indianapolis city (balance), IN
- County
- Marion County · 998,460 people
- City population
- 881,119
- Metro
- Indianapolis-Carmel-Anderson, IN
- Population (ZIP)
- 6,037
- Household income
- $55,190
- Rent vs Own
- Severe rent burden
- 311.0
Population outlook (Marion County) Hauer SSP2
- Today (2025)
- 1,025,572 people
- By 2030
- 1,065,727 · +3.9%
- By 2040
- 1,141,577 · +11.3%
- By 2050
- 1,208,920 · +17.9%
- By 2075
- 1,367,288 · +33.3%
- By 2100
- 1,438,201 · +40.2%
Race, ethnicity, and origin ACS 2023
- Neighborhood character
- Predominantly White (68%)
- Race & ethnicity
- White 68% Two or more races 12% Black 11% Hispanic / Latino 10% Asian 2%
- Hispanic origin (detail)
- Mexican 6%
- Common ancestry
- Romanian 2% Italian 2% Slovak 1%
- Foreign-born
- 9% · Canada
- Languages at home
- 88% English-only · Spanish 10% German/W. Germanic 1%
Political lean MEDSL · Marion
- 2024 margin
- Strong D (+27.7) · D 63.0% · R 35.3% · Other 1.7%
- 2008→2024 swing
- -0.7pp no change · 2008: 28.4pp · 2024: 27.7pp
- All cycles
- 2024: D+27.7 2020: D+29.1 2016: D+22.8 2012: D+22.2 2008: D+28.4
Not yet ingested
- Civics
- —
Market trends
- HPI YoY
- ▼ -36.19%
- Current HPI
- 403.9271
- Rent YoY
- ▲ 10.98%
- Metro
- Indianapolis-Carmel-Anderson, IN
- State GDP YoY
- ▲ 2.90%
- F500 in state
- 18
Industry mix (Fortune 500 HQ in IN)
| Industry | F500 HQs | Revenue |
|---|---|---|
| Industrial Machinery | 2 | $37B |
|
||
| Healthcare | 1 | $177B |
|
||
| Pharmaceuticals | 1 | $45B |
|
||
| Metals / Steel | 1 | $18B |
|
||
| Agriculture | 1 | $17B |
|
||
| Packaging | 1 | $12B |
|
||
Price history
+154.1% since first listed5 events — show timeline
- 2026-06-09 Price Changed $164,900 MIBOR as Distributed by MLS Grid
- 2026-05-22 Price Changed $177,500 MIBOR as Distributed by MLS Grid
- 2026-05-04 Listed $179,500 MIBOR as Distributed by MLS Grid
- 2006-10-16 Sold (MLS) $62,670 MIBOR as Distributed by MLS Grid
- 2006-07-14 Listed $64,900 MIBOR as Distributed by MLS Grid
Property tax history
+6.0%/yrLatest (2025): $908 · +2.3% YoY. Source: county tax records.
Cash-flow waterfall
monthlySold comps — $/sqft
last 12 mo · ≤1 miLoading sold comps…