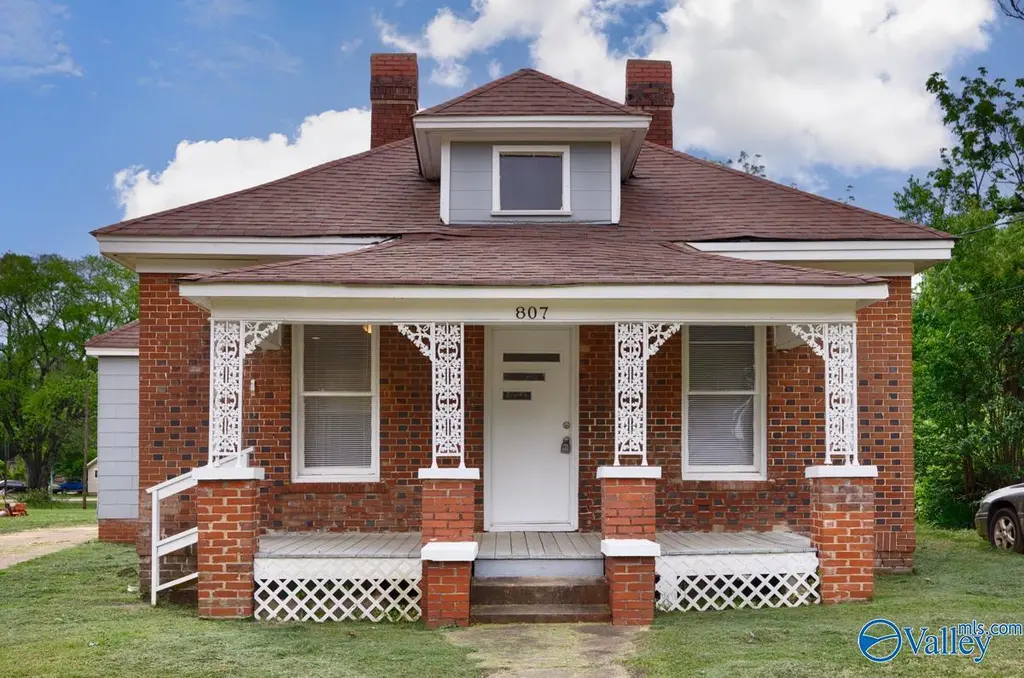
807 Brownsferry St · Athens, AL
Flood risk 1/10 · Minimal
- FEMA flood zone
- X (unshaded)
- Chance of flooding over 30 yrs
- 0.0%
- Est. flood insurance / yr
- $507 – $1,088
Fire risk 2/10 · Minimal
- Est. fire insurance / yr
- $916 – $1,700
Heat risk 5/10 · Moderate
- Hot days now (above 105°F)
- 7 days/yr
- Hot days in 30 yrs
- 19 days/yr
Wind risk 4/10 · Minor
- Chance of severe wind over 30 yrs
- 21.0%
Air-quality risk 2/10 · Minimal
- Unhealthy air days now
- 0 days/yr
- Unhealthy air days in 30 yrs
- 1 days/yr
Risk factors via First Street. Map © Google.
Why this score? — see what drove the D grade
The composite is a weighted blend of 9 inputs, each scored 0–100. Each bar is that input's sub-score; the figure is the points it added to the 100-point composite (weight × sub-score).
- Cash flow +14.7/30.0
- ARV discount +6.3/15.0
- DSCR +4.5/10.0
- Livability +3.8/5.0
- Schools +3.3/10.0
- 1% rule +2.8/10.0
- Rent growth +2.8/5.0
- Condition / age +2.5/5.0
- Appreciation +0.0/10.0
$185,000
🖨 Deal sheet 📄 Offer letter ✓ Due diligence
Listing remarks MLS
none
Key facts
- 0.23 acre lot
- Built 1950
- Listed 42 days
Property features AI
Finance
- Other: Lot is approximately 0.23 acres
- HOA & community: No homeowners association; Subdivision: Metes And Bounds
Exterior
- Parking: Concrete driveway; Gravel driveway
- Utilities: Public water; Public sewer; Electric service
- Home design: Single-family residence; One story; Built in 1950; Residential property
- Construction: Vinyl siding; No fireplaces
- Exterior features: Covered front porch
Interior
- Bathrooms: 2 full bathrooms
- Heating & cooling: Central electric heating; Central electric cooling
- Interior features: 9 total rooms; Crawl space basement
Neighborhood map
What this means for you Summary
Snapshot
- This is a 3-bed/1.0-bath single-family listed at $185k.
Deal economics
- At list price, monthly cash flow is $46 ($550/yr) — positive.
- The deal already cash-flows at list — no discount required.
- To meet the 1% rule (rent ≥ 1% of price), the offer needs to be $144k (22.4% below list).
- Recommended offer: $144k (22.4% below list) — sets the bar for 1% rule.
- Cap rate 6.6% vs local median 3.6% in Athens — top-decile yield for the area; either an underpriced asset or a hidden risk that comps aren't pricing in. Stress-test before assuming the spread holds.
Location & tenants
- Location reads 75/100 on livability (#18 in AL, #4,019 nationally) — a middle-class / working-renter tenant base. Strengths: cost of living A+, housing A+, health & safety A+; Watch: employment C-, commute F.
- Athens City (town): math 27% / reading 51% proficiency, ranked #29 of 129 in AL (top 22%) — families likely to look elsewhere, expect single-tenant / working-renter base with shorter leases.
- Zoned schools: Athens Middle School (math 15% / reading 45%, grade F, #121 of 257 statewide, top 50%, 958 students, 59% FRL); Athens High School (math 29% / reading 38%, grade F, #56 of 305 statewide, top 18%, 1,173 students, 51% FRL).
- Market conditions: Rents rising (+1.2%/yr); 546 active listings in the ZIP; 14 comparable units currently listed for rent nearby; rentals at typical pace (median 21d on market — plan ~3-4 weeks tenant-placement turnaround); 494 units permitted in Limestone County in 2024 (0 in 5+ unit buildings).
- This rent runs 30% of the median local income ($57k/yr) — at the standard rent-burdened threshold; future hikes will face affordability resistance.
Forward outlook
- Local home prices are declining (-3.0%/yr); year-one equity from $1k of loan paydown is wiped out by about $6k of value loss. Plan a longer hold.
- Limestone County population projected at +43% by 2050 — long-run rental-demand tailwind backs the buy-and-hold thesis.
Negotiation context
- It's been on market 42 days — a 3% lower offer ($179k) is reasonable based on typical stale-listing flexibility.
- 3 sale attempts since 5y ago; this cycle's ask has dropped $10k (5%) from the opening price — seller is motivated, your offer sets the floor, not the list.
- Current owner paid $68k; list at $185k implies a 174% gain — meaningful room to come down on a strong offer.
Risks & watch-outs
- Watch-outs: built in 1950 — expect roof / HVAC / electrical / plumbing capex.
- Climate carrying-cost: extreme-heat days projected 7→19/yr by 2055 (HVAC capex compounding) — expect insurance premiums to compound above CPI over the hold.
Questions for the listing agent
- It's been on market 42 days. Have you received any prior offers? Is the seller open to a 22% concession, seller financing, or rate buy-down credit?
- Built in 1950 — when were the roof, HVAC, electrical panel, plumbing, and water heater last replaced?
- Is there a deadline driving the sale (1031 exchange, divorce, estate, relocation)? That informs how much negotiation room exists.
- The area grade is low — what's the realistic commute time and amenity access for the typical tenant pool here? Any planned neighborhood developments (good or bad) we should know about?
- What's the average days-on-market for RENTAL listings here right now (not sales)? A rising rental-DOM trend means longer vacancies and softer asking-rent achievability than the comps imply.
- What's the recent tenant-quality profile in this submarket — average credit score on applications, eviction rate, late-payment / NSF rate, and stable-employment percentage? A property-management company in the area should have these aggregated.
- How much new for-sale + rental construction is in the pipeline within 1–3 miles? Heavy new supply typically softens prices + rents 12–24 months out; constrained supply supports both.
Investment metrics
- 1% rule
- 0.78% ✗
- Cap rate
- 6.59%
- Cash-on-cash
- 1.06%
- DSCR
- 1.05
- GRM
- 10.7
CMA / ARV
- ARV (median comp)
- $180,247
- List price
- $185,000
- Delta
- 2.64%
- Verdict
- FAIR
- Comps
- 20 within 1.0 mi
Show comp detail 12 sales within ~0.75 mi
| Address | Dist | Beds/Ba | Sqft | Sold | Price | $/sf | Match |
|---|---|---|---|---|---|---|---|
| 402 S 6th St | 0.34mi | 3/1.0 | 1,378 (+1%) | 5mo | $165,000 | $120 | 79 |
| 804 S Houston St | 0.24mi | 3/2.0 | 1,335 (-2%) | 6mo | $207,500 | $155 | 76 |
| 1203 Houston St S | 0.34mi | 3/1.0 | 1,325 (-3%) | 5mo | $175,000 | $132 | 75 |
| 1500 Buchanan St | 0.54mi | 4/2.0 (+1) | 1,375 (+0%) | 1mo | $209,900 | $153 | 64 |
| 505 1st St | 0.23mi | 3/2.0 | 1,527 (+12%) | 3mo | $184,900 | $121 | 64 |
| 24490 Colorado Ln | 0.68mi | 3/2.0 | 1,375 (+0%) | 5mo | $250,990 | $183 | 60 |
| 16645 Aspen Ln | 0.68mi | 3/2.0 | 1,479 (+8%) | 1mo | $261,285 | $177 | 50 |
| 16640 Aspen Ln | 0.68mi | 3/2.0 | 1,479 (+8%) | 4mo | $257,265 | $174 | 47 |
| 1506 S Houston St | 0.47mi | 2/2.0 (-1) | 1,553 (+14%) | 0mo | $229,900 | $148 | 46 |
| 501 Christopher Dr | 0.64mi | 3/2.0 | 1,506 (+10%) | 6mo | $193,000 | $128 | 45 |
| 107 Virginia Dr | 0.71mi | 2/1.0 (-1) | 1,230 (-10%) | 1mo | $175,000 | $142 | 44 |
| 16639 Aspen Ln | 0.70mi | 3/2.0 | 1,517 (+11%) | 2mo | $269,989 | $178 | 44 |
Match score weights: distance 35% · size 25% · config 20% · recency 20%. Top-matched comps best support the ARV.
Projected returns pro-forma
-3.0% appreciation · 1.23% rent growth · sell at horizon
- IRR
- -16.4%
- Equity multiple
- 0.43×
- Total profit
- $-29,664
- Equity at exit
- $27,584
- IRR
- -11.2%
- Equity multiple
- 0.37×
- Total profit
- $-32,404
- Equity at exit
- $15,995
Cash invested: $51,800 (down + closing). Projections, not guarantees.
Landlord ↔ Tenant lean methodology
- Overall (STATE)
- 90 Strongly Landlord-Friendly
- State Alabama
- 90 Strongly Landlord-Friendly · R+15
- County
- — inherits STATE
- City
- — inherits STATE
ZIP-level market 35611
- Rents YoY
- 1.2%
- Active inventory
- 546
- Price-to-rent
- 10.7×
Monthly cashflow live
- Estimated rent
- $1,435 high interval (Pro) →
- Mortgage (P&I)
- −$970
- Tax from tax record
- −$41 /mo · $488/yr
- Insurance
- −$77
- HOA
- −$0
- Vacancy / Maint / Mgmt
- −$301
- Net cashflow
- $46
Break-even live
UW: 25.0% down · 7.5% · 30yr · 1.5% tax · 5.0% vac · 8.0% maint · 8.0% mgmt
Financing live
Cash to close
- Down payment
- $46,250
- Closing costs
- $5,550
- Reserves months
- —
- Total cash needed
- —
Loan-product check · same deal, 3 products live
Conventional
25% down · 7.5% · 30yr
- Down + closing
- —
- Monthly P&I
- —
- Monthly cashflow
- —
- DSCR
- —
- Eligible?
- —
Personal DTI + credit; lowest rate.
DSCR
20% down · 8.5% · 30yr
- Down + closing
- —
- Monthly P&I
- —
- Monthly cashflow
- —
- DSCR
- —
- Eligible?
- —
No personal income docs; deal must DSCR.
Hard money
10% down · 12.0% · 12mo
- Down + closing
- —
- Monthly P&I
- —
- Monthly cashflow
- —
- DSCR
- —
- Eligible?
- —
Short-term bridge; refi at stabilization.
Rent comps 14 comps
| Address | Beds | Baths | Sqft | Rent | $/sqft | DOM | Units | Dist |
|---|---|---|---|---|---|---|---|---|
| 514 Brownsferry St Athens, AL | 3.0 | 1.0 | 953 | $1,045 | $1.10 | 43d | 1 | 0.27mi |
| 1003 E Washington St Athens, AL | 4.0 | 3.0 | 1768 | $1,600 | $0.90 | 21d | 1 | 0.34mi |
| 314 Browns Ferry St Athens, AL | 3.0 | 1.0 | 950 | $1,045 | $1.10 | 43d | 1 | 0.43mi |
| 100 Henry Dr Athens, AL | 2.0–3.0 | 2.0 | 1073 | $1,249 | $1.16 | 14d | 4 | 0.59mi |
| 710 S Clinton St Athens, AL | 1.0–3.0 | 1.0–2.0 | 1056 | $1,400 | $1.33 | 14d | 6 | 0.65mi |
| 1601 Florence St Athens, AL | 3.0 | 1.0 | 1260 | $1,850 | $1.47 | 43d | 1 | 0.67mi |
| 19254 Autumn Falls Way Athens, AL | 2.0 | 2.0 | 1200 | $1,239 | $1.03 | 21d | 1 | 0.72mi |
| 19254 Autumn Falls Way Athens, AL | 2.0 | 2.0 | 1200 | $1,469 | $1.22 | 14d | 1 | 0.72mi |
| 707 Hine St N Athens, AL | 3.0 | 1.5 | 1400 | $1,450 | $1.04 | 43d | 1 | 1.05mi |
| 16129 Cohen Dr Athens, AL | 2.0–4.0 | 2.0–2.5 | 1650 | $1,658 | $1.00 | 14d | 9 | 1.15mi |
| 426 Rogers St Athens, AL | 3.0 | 2.0 | 1738 | $1,550 | $0.89 | 14d | 1 | 1.26mi |
| 340 French Farms Blvd Athens, AL | 1.0–2.0 | 1.0–2.0 | 908 | $1,330 | $1.46 | 14d | 137 | 1.31mi |
| 17896 Sallows Dr Athens, AL | 3.0 | 2.0 | 1450 | $1,595 | $1.10 | 23d | 1 | 1.46mi |
| 17662 Antlers Pass Athens, AL | 3.0 | 2.0 | 1600 | $1,650 | $1.03 | 43d | 1 | 1.49mi |
Listing history 25 events
-
2026-06-19price $185,000 Active 42 DOM
-
2026-06-18days on market $190,000 Active 42 DOM
-
2026-06-17days on market $190,000 Active 41 DOM
-
2026-06-16days on market $190,000 Active 40 DOM
-
2026-06-15days on market $190,000 Active 39 DOM
-
2026-06-14days on market $190,000 Active 37 DOM
-
2026-06-10days on market $190,000 Active 34 DOM
-
2026-06-09days on market $190,000 Active 33 DOM
-
2026-06-08days on market $190,000 Active 32 DOM
-
2026-06-07days on market $190,000 Active 31 DOM
-
2026-06-05days on market $190,000 Active 28 DOM
-
2026-06-03days on market $190,000 Active 27 DOM
-
2026-06-02days on market $190,000 Active 26 DOM
-
2026-06-01days on market $190,000 Active 25 DOM
-
2026-05-31days on market $190,000 Active 24 DOM
-
2026-05-30days on market $190,000 Active 23 DOM
-
2026-05-07$195,000 Active 563-char remark
-
2025-03-27soldstatus $67,500
-
2022-06-24soldstatus $138,000
-
2022-06-08soldstatus $138,000 4-char remark
Show marketing remark (4 chars)
none
-
2021-10-08$138,000 4-char remark
Show marketing remark (4 chars)
none
-
2021-10-08soldstatus $77,000
Show marketing remark (4 chars)
none
-
2021-09-30soldstatus $77,000 Sold
Show marketing remark (203 chars)
2 bedroom 1 bath brick and siding home sold as is where is. Seller to make no repairs and purchaser understands home and lot to be sold in its as is condition. Prior to occupancy Home will need repairs.
-
2021-08-27historical Contingent
Show marketing remark (203 chars)
2 bedroom 1 bath brick and siding home sold as is where is. Seller to make no repairs and purchaser understands home and lot to be sold in its as is condition. Prior to occupancy Home will need repairs.
-
2021-07-23$80,000 Active
Show marketing remark (203 chars)
2 bedroom 1 bath brick and siding home sold as is where is. Seller to make no repairs and purchaser understands home and lot to be sold in its as is condition. Prior to occupancy Home will need repairs.
ⓘ Source: listings_history table (triggers on properties + properties_extension) + one-shot
backfill from property_details.listing_events for pre-trigger history.
Tax reassessment forecast AL · Resets to sale price
- Current annual tax
- $488 · $41/mo
- Projected year-2 tax
- $759 · $63/mo
- Expected delta
- +$271/yr (+$23/mo · 55.4%)
ⓘ Screening estimate from a state-policy table — verify with the county assessor before closing.
Climate risk First Street
- Flood 1/10 Low FEMA zone X (unshaded) · 0% chance over 30 yrs
- Wildfire 2/10 Low
- Heat 5/10 Major 7 d/yr ≥105°F today · 19 d/yr by 30 yrs out
- Wind 4/10 Moderate 21% chance of damaging wind over 30 yrs
- Air quality 2/10 Low 0 unhealthy d/yr today · 1 by 30 yrs out
Nearby sold comps map
Loading sold comps map…
Walkable amenities ~0.75 mi
Loading nearby amenities…
Taxation est. · year 1
- Rental income
- $17,222
- − Mortgage interest
- −$10,363
- − Property taxes
- −$488
- − Insurance
- −$925
- − Repairs & maintenance
- −$1,378
- − Management
- −$1,378
- − Depreciation
- −$5,382
- Taxable loss
- −$2,691
- Est. tax savings @ 24.0%
- +$646
- After-tax cash flow
- $1,196/yr
For passive investors: Depreciation is non-cash, so a rental often shows a tax loss while cash-flowing — sheltering income. Rental losses are passive: they offset passive income freely, and up to $25,000/yr can offset ordinary (W-2) income if you actively participate and your MAGI is under $100k (phasing out to $0 by $150k); unused losses carry forward. On sale, claimed depreciation is recaptured at up to 25%, and gains may owe capital-gains tax (a 1031 exchange can defer both). Figures are a year-1 estimate at your 24.0% rate — not tax advice; consult a CPA.
Schools (NCES district)
- District
- Athens City
- NCES district ID
- 0100120
- Math proficiency
- 27% ▼ -23.00%
- Reading proficiency
- 51% ▬ 0.00%
- Median HH income
- $45,479
- Composite
- 33.14/100
- National rank
- #5555
- State rank
- #29 of 129 in AL
Livability — Athens
- Score
- 75/100
- State rank
- #18
- US rank
- #4019
Category grades
Schools grade is shown separately in the Schools card above.
Census & demographics
- Census place
- Athens, AL
- County
- Limestone County · 80,439 people
- City population
- 55,492
- Metro
- Huntsville, AL
- Population (ZIP)
- 29,969
- Household income
- $57,377
- Rent vs Own
- Severe rent burden
- 811.0
Population outlook (Limestone County) Hauer SSP2
- Today (2025)
- 111,441 people
- By 2030
- 121,272 · +8.8%
- By 2040
- 140,705 · +26.3%
- By 2050
- 159,069 · +42.7%
- By 2075
- 202,231 · +81.5%
- By 2100
- 230,608 · +106.9%
Race, ethnicity, and origin ACS 2023
- Neighborhood character
- Predominantly White (66%)
- Race & ethnicity
- White 66% Black 17% Hispanic / Latino 10% Two or more races 7% Native American 2%
- Hispanic origin (detail)
- Mexican 8%
- Common ancestry
- Lithuanian 2% Slovak 2% Serbian 1%
- Foreign-born
- 4% · Canada
- Languages at home
- 91% English-only · Spanish 7% German/W. Germanic 1%
Political lean MEDSL · Limestone
- 2024 margin
- Solid R (+43.9) · D 27.5% · R 71.4% · Other 1.2%
- 2008→2024 swing
- -2.0pp toward R · 2008: -41.9pp · 2024: -43.9pp
- All cycles
- 2024: R+43.9 2020: R+42.6 2016: R+49.5 2012: R+43.6 2008: R+41.9
Not yet ingested
- Civics
- —
Market trends
- HPI YoY
- ▼ -115.98%
- Current HPI
- 185.0264
- Rent YoY
- ▲ 1.23%
- Metro
- Huntsville, AL
- State GDP YoY
- ▲ 2.94%
- F500 in state
- 4
Industry mix (Fortune 500 HQ in AL)
| Industry | F500 HQs | Revenue |
|---|---|---|
| Financial Services | 1 | $8B |
|
||
| Healthcare | 1 | $5B |
|
||
Price history
+137.5% since first listed10 events — show timeline
- 2026-05-28 Price Changed $190,000 VMLS
- 2026-05-07 Listed $195,000 VMLS
- 2025-03-27 Sold (Public Records) $67,500 Public Records
- 2022-06-24 Sold (Public Records) $138,000 Public Records
- 2022-06-08 Sold (MLS) $138,000 Greater Alabama MLS
- 2021-10-08 Sold (Public Records) $77,000 Public Records
- 2021-10-08 Listed $138,000 Greater Alabama MLS
- 2021-09-30 Sold (MLS) $77,000 VMLS
- 2021-08-27 Contingent — VMLS
- 2021-07-23 Listed $80,000 VMLS
Property tax history
+7.0%/yrLatest (2025): $488 · +12.8% YoY. Source: county tax records.
Cash-flow waterfall
monthlySold comps — $/sqft
last 12 mo · ≤1 miLoading sold comps…