 🏗️ New Construction
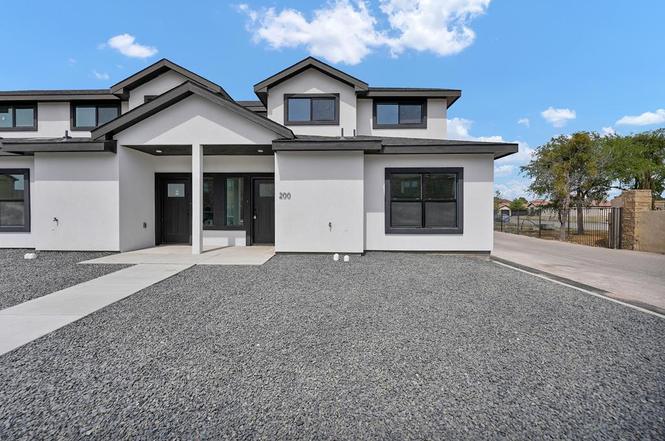
208 Old Course Rd · Odessa, TX
Flood risk 2/10 · Minimal
- FEMA flood zone
- X (unshaded)
- Chance of flooding over 30 yrs
- 0.03%
- Est. flood insurance / yr
- $507 – $1,088
Fire risk 6/10 · Moderate
- Est. fire insurance / yr
- $1,222 – $2,270
Heat risk 6/10 · Moderate
- Hot days now (above 101°F)
- 7 days/yr
- Hot days in 30 yrs
- 23 days/yr
Wind risk 2/10 · Minimal
- Chance of severe wind over 30 yrs
- 3.0%
Air-quality risk 1/10 · Minimal
- Unhealthy air days now
- 0 days/yr
- Unhealthy air days in 30 yrs
- 0 days/yr
Risk factors via First Street. Map © Google.
Why this score? — see what drove the D grade
The composite is a weighted blend of 9 inputs, each scored 0–100. Each bar is that input's sub-score; the figure is the points it added to the 100-point composite (weight × sub-score).
- Cash flow +12.8/30.0
- ARV discount +7.5/15.0
- Condition / age +5.0/5.0
- 1% rule +3.8/10.0
- DSCR +3.8/10.0
- Livability +3.8/5.0
- Rent growth +2.6/5.0
- Schools +2.2/10.0
- Appreciation +0.0/10.0
$265,900
🖨 Deal sheet 📄 Offer letter ✓ Due diligence
Listing remarks
Brand-new construction townhome featuring 3 bedrooms and 2.5 baths with a modern, efficient layout. Enjoy low-maintenance living with zero-scaped yards and a turf backyard. Contemporary finishes throughout with thoughtful design. Estimated completion in approximately 30 days. Ideal for owner-occupants or investors.
Key facts
- 2,178 sq ft lot
- Garage
- Built 2026
Property features AI
Finance
- HOA & community: Homeowners association with an annual fee of $375 (about $31.25/month)
Exterior
- Parking: One-car garage with garage door opener; One covered parking space (total 1 parking space)
- Security: Smoke detector(s)
- Utilities: Public water; Public sewer; Propane
- Home design: Single family residence; Residential property; New construction
- Construction: Stucco construction; Composition roof; Slab foundation; Built as new construction
- Exterior features: Covered patio/porch; Landscaped lot; Paved road access
Interior
- Kitchen: Electric range; Microwave; Dishwasher; Disposal
- Flooring: Carpet; Tile
- Bathrooms: Two full bathrooms and one half bathroom
- Heating & cooling: Central heating (electric); Central air conditioning (electric); Thermostat; Solar energy generation
- Interior features: Pantry; Smoke detectors
- Laundry & utility: Washer hookup; Dryer (included); Electric water heater
Neighborhood map
What this means for you Summary
Snapshot
- This is a 3-bed/2.5-bath single-family listed at $266k. Condition is rated excellent.
Deal economics
- At list price, monthly cash flow is $-26 ($-311/yr) — negative.
- To cash-flow at today's rent, offer at most $262k (1.4% below list).
- To meet the 1% rule (rent ≥ 1% of price), the offer needs to be $233k (12.3% below list).
- Recommended offer: $233k (12.3% below list) — sets the bar for 1% rule.
Location & tenants
- Location reads 75/100 on livability (#132 in TX, #3,928 nationally) — a middle-class / working-renter tenant base. Strengths: cost of living A+, housing A+, health & safety A+; Watch: commute D+, amenities D.
- Ector County ISD (urban): math 22% / reading 27% proficiency, ranked #707 of 826 in TX (top 86%) — low school quality limits family demand, transient renter base, plan for 1-2y turnover.
- Zoned schools: L B Johnson El (math 26% / reading 27%, grade F, #2,927 of 4,322 statewide, top 68%, 517 students, 67% FRL); Bonham Middle (math 9% / reading 16%, grade F, #1,616 of 1,662 statewide, top 97%, 867 students, 65% FRL); Permian H S (math 19% / reading 29%, grade F, #1,333 of 1,632 statewide, top 82%, 3,978 students, 51% FRL).
- Market conditions: Rents flat; 431 active listings in the ZIP; 14 comparable units currently listed for rent nearby; rentals at typical pace (median 22d on market — plan ~3-4 weeks tenant-placement turnaround); 43% of comp listings sitting > 30 days — soft ceiling on asking rent; solid renter incomes; 1,004 units permitted in Ector County in 2024 (0 in 5+ unit buildings).
Forward outlook
- Local home prices are declining (-3.0%/yr); year-one equity from $2k of loan paydown is wiped out by about $8k of value loss. Plan a longer hold.
- Ector County population projected at +78% by 2050 — long-run rental-demand tailwind backs the buy-and-hold thesis.
Negotiation context
- Only 3 days on market — expect competitive offers; lowballing is unlikely to land.
Risks & watch-outs
- Climate carrying-cost: major wildfire risk; extreme-heat days projected 7→23/yr by 2055 (HVAC capex compounding) — expect insurance premiums to compound above CPI over the hold.
Questions for the listing agent
- What do current leases actually rent for vs. the listed asking? Can we see a recent rent roll and the last 12 months of T-12 income?
- What does the HOA fee cover, when was the last increase, and are there any pending special assessments or reserve-fund shortfalls?
- Is there a deadline driving the sale (1031 exchange, divorce, estate, relocation)? That informs how much negotiation room exists.
- Schools are F-rated, which usually means shorter tenancies and higher turnover. Who's the typical renter profile here, and what's been the actual vacancy rate?
- The area grade is low — what's the realistic commute time and amenity access for the typical tenant pool here? Any planned neighborhood developments (good or bad) we should know about?
- What's the average days-on-market for RENTAL listings here right now (not sales)? A rising rental-DOM trend means longer vacancies and softer asking-rent achievability than the comps imply.
- What's the recent tenant-quality profile in this submarket — average credit score on applications, eviction rate, late-payment / NSF rate, and stable-employment percentage? A property-management company in the area should have these aggregated.
- How much new for-sale + rental construction is in the pipeline within 1–3 miles? Heavy new supply typically softens prices + rents 12–24 months out; constrained supply supports both.
Investment metrics
- 1% rule
- 0.88% ✗
- Cap rate
- 6.18%
- Cash-on-cash
- -0.42%
- DSCR
- 0.98
- GRM
- 9.5
CMA / ARV
No comps found within radius.
Projected returns pro-forma
-3.0% appreciation · 0.54% rent growth · sell at horizon
- IRR
- -19.8%
- Equity multiple
- 0.32×
- Total profit
- $-50,316
- Equity at exit
- $39,647
- IRR
- -19.2%
- Equity multiple
- 0.09×
- Total profit
- $-67,728
- Equity at exit
- $22,990
Cash invested: $74,452 (down + closing). Projections, not guarantees.
Landlord ↔ Tenant lean methodology
- Overall (STATE)
- 87 Strongly Landlord-Friendly
- State Texas
- 87 Strongly Landlord-Friendly · R+5
- County
- — inherits STATE
- City
- — inherits STATE
ZIP-level market 79765
- Home prices YoY
- -28.7%
- Rents YoY
- 0.5%
- Active inventory
- 431
- Price-to-rent
- 9.5×
Monthly cashflow live
- Estimated rent
- $2,333 high interval (Pro) →
- Mortgage (P&I)
- −$1,394
- Tax est. 1.5%
- −$332 /mo · $3,988/yr
- Insurance
- −$111
- HOA
- −$31
- Vacancy / Maint / Mgmt
- −$490
- Net cashflow
- $-26
Break-even live
UW: 25.0% down · 7.5% · 30yr · 1.5% tax · 5.0% vac · 8.0% maint · 8.0% mgmt
Financing live
Cash to close
- Down payment
- $66,475
- Closing costs
- $7,977
- Reserves months
- —
- Total cash needed
- —
Loan-product check · same deal, 3 products live
Conventional
25% down · 7.5% · 30yr
- Down + closing
- —
- Monthly P&I
- —
- Monthly cashflow
- —
- DSCR
- —
- Eligible?
- —
Personal DTI + credit; lowest rate.
DSCR
20% down · 8.5% · 30yr
- Down + closing
- —
- Monthly P&I
- —
- Monthly cashflow
- —
- DSCR
- —
- Eligible?
- —
No personal income docs; deal must DSCR.
Hard money
10% down · 12.0% · 12mo
- Down + closing
- —
- Monthly P&I
- —
- Monthly cashflow
- —
- DSCR
- —
- Eligible?
- —
Short-term bridge; refi at stabilization.
Rent comps 14 comps
| Address | Beds | Baths | Sqft | Rent | $/sqft | DOM | Units | Dist |
|---|---|---|---|---|---|---|---|---|
| 503 Old Course Rd Odessa, TX | 3.0 | 2.5 | 1731 | $2,200 | $1.27 | 13d | 1 | 0.06mi |
| 1205 Old Course Rd Odessa, TX | 3.0 | 2.5 | 1731 | $2,100 | $1.21 | 44d | 1 | 0.22mi |
| 7204 Donatello St Odessa, TX | 3.0 | 2.0 | 1748 | $2,400 | $1.37 | 44d | 1 | 0.52mi |
| 3001 Pointer Ln Unit 5B Odessa, TX | 3.0 | 2.5 | 1817 | $2,450 | $1.35 | 44d | 1 | 0.52mi |
| 7206 Raphael St Odessa, TX | 3.0 | 2.0 | 1743 | $2,800 | $1.61 | 44d | 1 | 0.57mi |
| 3001 Pointer Ln Unit 12D Odessa, TX | 3.0 | 2.5 | 1704 | $2,800 | $1.64 | 21d | 1 | 0.61mi |
| 7309 Raphael St Odessa, TX | 3.0 | 2.0 | 1824 | $3,500 | $1.92 | 21d | 1 | 0.66mi |
| 7214 Barksdale Ln Odessa, TX | 3.0 | 2.0 | 1295 | $2,000 | $1.54 | 44d | 1 | 0.84mi |
| 7230 Barksdale Ln Odessa, TX | 3.0 | 2.0 | 1283 | $2,100 | $1.64 | 21d | 1 | 0.85mi |
| 2201 Rocky Lane Rd Odessa, TX | 1.0–2.0 | 1.0–2.5 | 900 | $1,675 | $1.86 | 13d | 10 | 0.93mi |
| 6500 Eastridge Rd Odessa, TX | 2.0–3.0 | 1.5–2.5 | 1222 | $1,970 | $1.61 | 13d | 4 | 1.08mi |
| 33 Cibola Ct Odessa, TX | 3.0 | 2.0 | 1504 | $3,500 | $2.33 | 44d | 1 | 1.18mi |
| 3418 Rocky Lane Rd Odessa, TX | 2.0 | 2.0 | 1537 | $1,900 | $1.24 | 21d | 1 | 1.20mi |
| 3601 N Faudree Rd Odessa, TX | 1.0–2.0 | 1.0–2.0 | 893 | $1,982 | $2.22 | 13d | 20 | 1.36mi |
HOA detail
- Monthly dues
- $31 · $372/yr
Listing history 4 events
-
2026-06-19days on market $265,900 Active 3 DOM
-
2026-06-18days on market $265,900 Active 2 DOM
-
2026-06-17remarks 316-char remark
-
2026-06-17$265,900 Active 1 DOM
ⓘ Source: listings_history table (triggers on properties + properties_extension) + one-shot
backfill from property_details.listing_events for pre-trigger history.
Climate risk First Street
- Flood 2/10 Low FEMA zone X (unshaded) · 3% chance over 30 yrs
- Wildfire 6/10 Major
- Heat 6/10 Major 7 d/yr ≥101°F today · 23 d/yr by 30 yrs out
- Wind 2/10 Low 3% chance of damaging wind over 30 yrs
- Air quality 1/10 Low 0 unhealthy d/yr today · 0 by 30 yrs out
Nearby sold comps map
Loading sold comps map…
Walkable amenities ~0.75 mi
Loading nearby amenities…
Taxation est. · year 1
- Rental income
- $27,990
- − Mortgage interest
- −$14,895
- − Property taxes
- −$3,988
- − Insurance
- −$1,330
- − Repairs & maintenance
- −$2,239
- − Management
- −$2,239
- − HOA
- −$372
- − Depreciation
- −$7,735
- Taxable loss
- −$4,808
- Est. tax savings @ 24.0%
- +$1,154
- After-tax cash flow
- $843/yr
For passive investors: Depreciation is non-cash, so a rental often shows a tax loss while cash-flowing — sheltering income. Rental losses are passive: they offset passive income freely, and up to $25,000/yr can offset ordinary (W-2) income if you actively participate and your MAGI is under $100k (phasing out to $0 by $150k); unused losses carry forward. On sale, claimed depreciation is recaptured at up to 25%, and gains may owe capital-gains tax (a 1031 exchange can defer both). Figures are a year-1 estimate at your 24.0% rate — not tax advice; consult a CPA.
Condition & rehab AI · 12 photos
This brand-new construction townhome is move-in ready with modern finishes and a low-maintenance design. It offers a great opportunity for investors or owner-occupants.
Value-add opportunities
- Both Landscaping and curb appeal improvements — Enhances the home's curb appeal and can attract more buyers.
- Both Painting interior walls — Fresh paint can make the home more inviting and can increase its value.
- Both Flooring replacement — Replacing carpet with hardwood or tile flooring can increase the home's value and appeal to a wider range of buyers.
- Both Kitchen and bathroom updates — Updating the kitchen and bathrooms with modern fixtures and finishes can increase the home's value and appeal to a wider range of buyers.
Renovation cost estimate screening
Value-add ROI direction
- Both Landscaping and curb appeal improvements — Enhances the home's curb appeal and can attract more buyers. ↑
- Both Painting interior walls — Fresh paint can make the home more inviting and can increase its value. ↑
- Both Flooring replacement — Replacing carpet with hardwood or tile flooring can increase the home's value and appeal to a wider range of buyers. ↑
- Both Kitchen and bathroom updates — Updating the kitchen and bathrooms with modern fixtures and finishes can increase the home's value and appeal to a wider range of buyers. ↑
ⓘ Cost ranges are severity-bucket heuristics (US national rule-of-thumb). Get contractor quotes + a written scope before underwriting a rehab budget.
Schools (NCES district)
- District
- Ector County ISD
- NCES district ID
- 4818000
- Math proficiency
- 22% ▼ -9.00%
- Reading proficiency
- 27% ▼ -4.00%
- Median HH income
- $52,740
- Composite
- 21.89/100
- National rank
- #8233
- State rank
- #707 of 826 in TX
Livability — Odessa
- Score
- 75/100
- State rank
- #132
- US rank
- #3928
Category grades
Schools grade is shown separately in the Schools card above.
Census & demographics
- Census place
- Odessa, TX
- County
- Ector County · 131,169 people
- City population
- 131,169
- Metro
- Odessa, TX
- Population (ZIP)
- 25,904
- Household income
- $104,965
- Rent vs Own
- Severe rent burden
- 884.0
Population outlook (Ector County) Hauer SSP2
- Today (2025)
- 212,765 people
- By 2030
- 241,962 · +13.7%
- By 2040
- 306,582 · +44.1%
- By 2050
- 379,755 · +78.5%
- By 2075
- 568,991 · +167.4%
- By 2100
- 709,829 · +233.6%
Race, ethnicity, and origin ACS 2023
- Neighborhood character
- Diverse neighborhood (Simpson 0.59)
- Race & ethnicity
- Hispanic / Latino 49% White 41% Two or more races 15% Black 5% Asian 3% Native American 1%
- Hispanic origin (detail)
- Mexican 45%
- Common ancestry
- Romanian 1% Slovak 1% Lithuanian 1%
- Foreign-born
- 10% · Canada, China, South Korea
- Languages at home
- 63% English-only · Spanish 31% German/W. Germanic 1% Tagalog/Filipino 1%
Political lean MEDSL · Ector
- 2024 margin
- Solid R (+52.9) · D 23.2% · R 76.1%
- 2008→2024 swing
- -4.9pp toward R · 2008: -48.0pp · 2024: -52.9pp
- All cycles
- 2024: R+52.9 2020: R+47.8 2016: R+40.6 2012: R+48.9 2008: R+48.0
Not yet ingested
- Civics
- —
Market trends
- HPI YoY
- ▼ -69.68%
- Current HPI
- 173.4252
- Rent YoY
- ▲ 0.54%
- Metro
- Odessa, TX
- State GDP YoY
- ▲ 3.95%
- F500 in state
- 110
Industry mix (Fortune 500 HQ in TX)
| Industry | F500 HQs | Revenue |
|---|---|---|
| Energy | 16 | $1,198B |
|
||
| Technology | 5 | $198B |
|
||
| Engineering / Construction | 4 | $72B |
|
||
| Energy Services | 3 | $60B |
|
||
| Utilities | 3 | $41B |
|
||
| Healthcare | 2 | $330B |
|
||
Price history
1 event — show timeline
- 2026-06-16 Listed $265,900 ODMLS
Cash-flow waterfall
monthlySold comps — $/sqft
last 12 mo · ≤1 miLoading sold comps…