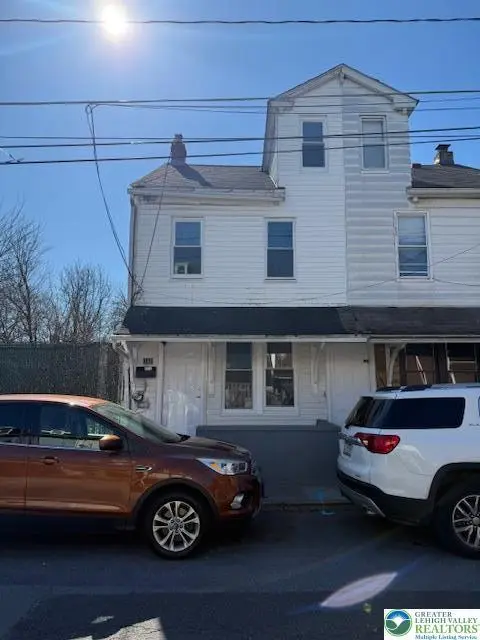
148 Chestnut St · Allentown, PA
Flood risk 6/10 · Moderate
- FEMA flood zone
- X (unshaded)
- Chance of flooding over 30 yrs
- 0.27%
- Est. flood insurance / yr
- $473 – $860
Fire risk 3/10 · Minor
- Est. fire insurance / yr
- $511 – $949
Heat risk 5/10 · Moderate
- Hot days now (above 99°F)
- 7 days/yr
- Hot days in 30 yrs
- 15 days/yr
Wind risk 4/10 · Minor
- Chance of severe wind over 30 yrs
- 16.0%
Air-quality risk 3/10 · Minor
- Unhealthy air days now
- 3 days/yr
- Unhealthy air days in 30 yrs
- 4 days/yr
Risk factors via First Street. Map © Google.
Why this score? — see what drove the D grade
The composite is a weighted blend of 9 inputs, each scored 0–100. Each bar is that input's sub-score; the figure is the points it added to the 100-point composite (weight × sub-score).
- Cash flow +18.0/30.0
- DSCR +5.6/10.0
- 1% rule +4.1/10.0
- Appreciation +4.0/10.0
- Livability +4.0/5.0
- Rent growth +3.3/5.0
- Condition / age +2.5/5.0
- Schools +1.2/10.0
- ARV discount +0.0/15.0
$189,900
🖨 Deal sheet (PDF) 📄 Offer letter ✓ Due diligence
Listing remarks MLS
Welcome to this freshly updated Allentown end of row home offering 3 bedrooms and 1.5 bathrooms. Step inside to new laminate flooring throughout. The spacious living and dining areas flow nicely into the updated kitchen featuring new cabinets, new countertops, and new gas range. Upstairs you’ll find generously sized bedrooms and a full bathroom. The home also features efficient gas heat and replacement windows. Out back, enjoy a private fenced yard—perfect for relaxing or entertaining. Conveniently located to major routes, shopping, restaurants, and public transportation. Whether you’re a first-time buyer or investor, this move-in-ready home offers great value and low-maintenance living. LOW TAXES. PROPERTY IS BEING SOLD WITH A CLEAR CO THROUGH THE CITY OF ALLENTOWN.
Key facts
- New gas range
- Efficient gas heat
- New cabinets
Tags
Neighborhood map
What this means for you Summary
Snapshot
- This is a 2-bed/1.0-bath single-family listed at $190k.
Deal economics
- At list price, monthly cash flow is $164 ($2k/yr) — positive.
- The deal already cash-flows at list — no discount required.
- To meet the 1% rule (rent ≥ 1% of price), the offer needs to be $174k (8.5% below list).
- Recommended offer: $173k (9.0% below list) — sets the bar for market timing.
- Cap rate 7.3% vs local median 5.3% in Allentown — top-decile yield for the area; either an underpriced asset or a hidden risk that comps aren't pricing in. Stress-test before assuming the spread holds.
Location & tenants
- Location reads 81/100 on livability (#171 in PA, #1,440 nationally) — a professional / high-income tenant draw. Strengths: commute A+, cost of living A+, housing A+; Watch: employment D.
- Allentown City SD (urban): math 10% / reading 20% proficiency, ranked #513 of 539 in PA (top 95%) — low school quality limits family demand, transient renter base, plan for 1-2y turnover; 73% free/reduced lunch — lower-income household profile, screen leases tightly.
- Zoned schools: Mosser El Sch (math 8% / reading 24%, grade F, #1,316 of 1,518 statewide, top 87%, 482 students, 100% FRL); Harrison-Morton Ms (math 3% / reading 30%, grade F, #463 of 512 statewide, top 91%, 733 students, 100% FRL); Louis E Dieruff Hs (math 32% / reading 10%, grade F, #385 of 437 statewide, top 88%, 1,915 students, 89% FRL) — zoned schools average 96% FRL vs 73% district-wide (23 pts higher); higher-poverty schools than district average — tighter screening recommended.
- Market conditions: Rents rising (+3.4%/yr); 8 active listings in the ZIP; 40 comparable units currently listed for rent nearby; rentals at typical pace (median 22d on market — plan ~3-4 weeks tenant-placement turnaround); lower-income renter base — watch delinquency; 765 units permitted in Lehigh County in 2024 (286 in 5+ unit buildings).
- At $1,737/mo this rent would consume 47% of the median local household income ($45k/yr) (locally 660% of renters already pay >50% of income on rent) — very limited rent-growth headroom before tenants either downsize or default.
Forward outlook
- Local home prices are declining (-1.9%/yr); year-one equity from $1k of loan paydown is wiped out by about $4k of value loss. Plan a longer hold.
- Lehigh County population projected at +21% by 2050 — long-run rental-demand tailwind backs the buy-and-hold thesis.
Negotiation context
- It's been on market 97 days — a 9% lower offer ($173k) is reasonable based on typical stale-listing flexibility.
- 2 sale attempts since 22y ago with the ask held roughly flat each time — persistent listings suggest the price (not the market) is what's stuck; bring a comps-based counter.
- Current owner paid $27k; list at $190k implies a 598% gain — meaningful room to come down on a strong offer.
Risks & watch-outs
- Watch-outs: built in 1890 — expect roof / HVAC / electrical / plumbing capex.
- Climate carrying-cost: major flood risk; extreme-heat days projected 7→15/yr by 2055 (HVAC capex compounding) — expect insurance premiums to compound above CPI over the hold.
Questions for the listing agent
- It's been on market 97 days. Have you received any prior offers? Is the seller open to a 9% concession, seller financing, or rate buy-down credit?
- Built in 1890 — when were the roof, HVAC, electrical panel, plumbing, and water heater last replaced?
- Why hasn't it sold? Are there any deal-killer items the seller is aware of (foundation, flood, title, zoning, code violations)?
- Is there a deadline driving the sale (1031 exchange, divorce, estate, relocation)? That informs how much negotiation room exists.
- Schools are D-rated, which usually means shorter tenancies and higher turnover. Who's the typical renter profile here, and what's been the actual vacancy rate?
- The area grade is low — what's the realistic commute time and amenity access for the typical tenant pool here? Any planned neighborhood developments (good or bad) we should know about?
- What's the average days-on-market for RENTAL listings here right now (not sales)? A rising rental-DOM trend means longer vacancies and softer asking-rent achievability than the comps imply.
- What's the recent tenant-quality profile in this submarket — average credit score on applications, eviction rate, late-payment / NSF rate, and stable-employment percentage? A property-management company in the area should have these aggregated.
- How much new for-sale + rental construction is in the pipeline within 1–3 miles? Heavy new supply typically softens prices + rents 12–24 months out; constrained supply supports both.
Investment metrics
- 1% rule
- 0.91% ✗
- Cap rate
- 7.33%
- Cash-on-cash
- 3.69%
- DSCR
- 1.16
- GRM
- 9.1
CMA / ARV
- ARV (median comp)
- $157,232
- List price
- $189,900
- Delta
- 20.78%
- Verdict
- OVERPRICED
- Comps
- 20 within 1.0 mi
Show comp detail 8 sales within ~0.75 mi
| Address | Dist | Beds/Ba | Sqft | Sold | Price | $/sf | Match |
|---|---|---|---|---|---|---|---|
| 175 W Pine St | 0.22mi | 3/1.0 (+1) | 1,344 (-2%) | 17mo | $115,000 | $86 | 66 |
| 223 E Union St | 0.58mi | 3/1.0 (+1) | 1,300 (-6%) | 5mo | $275,000 | $212 | 55 |
| 423 E Walnut St | 0.74mi | 3/1.0 (+1) | 1,392 (+1%) | 9mo | $190,000 | $136 | 51 |
| 27 W Allen St | 0.50mi | 3/1.0 (+1) | 1,242 (-10%) | 12mo | $155,000 | $125 | 45 |
| 272 E Walnut St | 0.62mi | 3/1.5 (+1) | 1,288 (-6%) | 17mo | $250,000 | $194 | 39 |
| 416 5th St | 0.61mi | 3/2.0 (+1) | 1,224 (-11%) | 6mo | $194,000 | $158 | 39 |
| 206 S Carlisle St | 0.68mi | 3/1.0 (+1) | 1,270 (-8%) | 18mo | $229,000 | $180 | 36 |
| 225 Carlisle St | 0.72mi | 3/1.0 (+1) | 1,192 (-13%) | 8mo | $215,000 | $180 | 32 |
Match score weights: distance 35% · size 25% · config 20% · recency 20%. Top-matched comps best support the ARV.
Projected returns pro-forma
-1.94% appreciation · 3.36% rent growth · sell at horizon
- IRR
- -5.2%
- Equity multiple
- 0.79×
- Total profit
- $-11,184
- Equity at exit
- $37,433
- IRR
- 3.1%
- Equity multiple
- 1.26×
- Total profit
- $13,807
- Equity at exit
- $32,518
Cash invested: $53,172 (down + closing). Projections, not guarantees.
Landlord ↔ Tenant lean methodology
- Overall (STATE)
- 62 Landlord-Friendly
- State Pennsylvania
- 62 Landlord-Friendly · EVEN
- County
- — inherits STATE
- City
- — inherits STATE
ZIP-level market 18101
- Home prices YoY
- -0.6%
- Rents YoY
- 3.4%
- Active inventory
- 8
- Price-to-rent
- 9.1×
Monthly cashflow live
- Estimated rent
- $1,737 high interval (Pro) →
- Mortgage (P&I)
- −$996
- Tax from tax record
- −$133 /mo · $1,600/yr
- Insurance
- −$79
- HOA
- −$0
- Lot rent
- −$0
- Vacancy / Maint / Mgmt
- −$365
- Net cashflow
- $164
Break-even live
Sensitivity live
| Price | -10% $271 | -5% $217 | +0% $164 | +5% $110 | +10% $56 |
|---|---|---|---|---|---|
| Rent | -10% $26 | -5% $95 | +0% $164 | +5% $232 | +10% $301 |
| Rate | -1.0pp $259 | -0.5pp $212 | base $164 | +0.5pp $114 | +1.0pp $64 |
UW: 25.0% down · 7.5% · 30yr · 1.5% tax · 5.0% vac · 8.0% maint · 8.0% mgmt
Financing live
Cash to close
- Down payment
- $47,475
- Closing costs
- $5,697
- Reserves months
- —
- Total cash needed
- —
Loan-product check · same deal, 3 products live
Conventional
25% down · 7.5% · 30yr
- Down + closing
- —
- Monthly P&I
- —
- Monthly cashflow
- —
- DSCR
- —
- Eligible?
- —
Personal DTI + credit; lowest rate.
DSCR
20% down · 8.5% · 30yr
- Down + closing
- —
- Monthly P&I
- —
- Monthly cashflow
- —
- DSCR
- —
- Eligible?
- —
No personal income docs; deal must DSCR.
Hard money
10% down · 12.0% · 12mo
- Down + closing
- —
- Monthly P&I
- —
- Monthly cashflow
- —
- DSCR
- —
- Eligible?
- —
Short-term bridge; refi at stabilization.
Rent comps 40 comps
| Address | Beds | Baths | Sqft | Rent | $/sqft | DOM | Units | Dist |
|---|---|---|---|---|---|---|---|---|
| 236 N Front St Allentown, PA | 3.0 | 1.0 | 1020 | $1,800 | $1.76 | 5d | 1 | 0.16mi |
| 132 Chew St Allentown, PA | 3.0 | 1.0 | 1160 | $1,995 | $1.72 | 16d | 1 | 0.16mi |
| 201 N 3rd St Allentown, PA | 2.0 | 2.0 | 1145 | $2,128 | $1.86 | 5d | 4 | 0.18mi |
| 407 N 4th St Allentown, PA | 3.0 | 1.5 | 1321 | $1,550 | $1.17 | 26d | 1 | 0.49mi |
| 445 Linden St Unit 447-Unit 1 Allentown, PA | 1.0 | 1.0 | 995 | $1,150 | $1.16 | 46d | 1 | 0.50mi |
| 447 Linden St Unit 1st Floor Allentown, PA | 1.0 | 1.0 | 950 | $1,150 | $1.21 | 46d | 1 | 0.51mi |
| 517 Elliger St Allentown, PA | 3.0 | 1.5 | 1235 | $1,700 | $1.38 | 26d | 1 | 0.55mi |
| 450 Maple St Unit 3 Allentown, PA | 1.0 | 1.0 | 900 | $1,100 | $1.22 | 46d | 1 | 0.56mi |
| 177 W Tilghman St Allentown, PA | 3.0 | 1.5 | 1800 | $1,650 | $0.92 | 5d | 1 | 0.57mi |
| 425 Liberty St #2 Allentown, PA | 1.0 | 1.0 | 1792 | $1,200 | $0.67 | 46d | 1 | 0.61mi |
| 395 W Allen St Allentown, PA | 3.0 | 1.0 | 1344 | $1,800 | $1.34 | 26d | 1 | 0.62mi |
| 230 E Fairview St Allentown, PA | 3.0 | 2.0 | 1414 | $2,300 | $1.63 | 26d | 1 | 0.63mi |
| 451 W Liberty St Allentown, PA | 2.0 | 1.0 | 1126 | $1,395 | $1.24 | 46d | 1 | 0.64mi |
| 45 N 6th St Allentown, PA | 2.0 | 1.0–2.0 | 1002 | $3,616 | $3.61 | 5d | 13 | 0.65mi |
| 303 E Union St Unit 1st Allentown, PA | 2.0 | 1.0 | 977 | $1,550 | $1.59 | 46d | 1 | 0.66mi |
| 26 N 6th St Allentown, PA | 1.0–2.0 | 1.0–2.0 | 953 | $2,224 | $2.33 | 5d | 9 | 0.68mi |
| 503 S Austin St Unit A Allentown, PA | 2.0 | 1.0 | 1000 | $1,650 | $1.65 | 5d | 1 | 0.68mi |
| 503 S Austin St Unit 520 Allentown, PA | 2.0 | 1.0 | 1000 | $1,650 | $1.65 | 16d | 1 | 0.68mi |
| 503 S Austin St Unit 524 Allentown, PA | 2.0 | 1.0 | 1000 | $1,750 | $1.75 | 26d | 1 | 0.68mi |
| 503 S Austin St Unit 514 Allentown, PA | 2.0 | 1.0 | 1000 | $1,550 | $1.55 | 16d | 1 | 0.68mi |
| 503 S Austin St Unit 503 A Allentown, PA | 2.0 | 1.0 | 1000 | $1,900 | $1.90 | 16d | 1 | 0.68mi |
| 503 S Austin St Unit 517 A Allentown, PA | 2.0 | 1.0 | 1000 | $1,900 | $1.90 | 16d | 1 | 0.68mi |
| 314 Barber St Lot 35 Allentown, PA | 3.0 | 2.5 | 1525 | $2,450 | $1.61 | 21d | 1 | 0.69mi |
| 626 Oak St Allentown, PA | 3.0 | 1.0 | 1396 | $1,900 | $1.36 | 46d | 1 | 0.71mi |
| 622 W Chew St Unit 2 Allentown, PA | 3.0 | 1.0 | 1161 | $1,600 | $1.38 | 21d | 1 | 0.72mi |
| 27 N 7th St Allentown, PA | 2.0 | 1.0–2.0 | 840 | $2,222 | $2.64 | 5d | 11 | 0.75mi |
| 107 N 7th St Allentown, PA | 2.0 | 1.0–2.0 | 855 | $2,972 | $3.47 | 5d | 23 | 0.75mi |
| 801 N Jordan St Unit 3 Allentown, PA | 2.0 | 1.0 | 935 | $1,350 | $1.44 | 46d | 1 | 0.76mi |
| 948 N Front St Unit C-2 Allentown, PA | 2.0 | 2.0 | 954 | $2,300 | $2.41 | 5d | 1 | 0.79mi |
| 528 N 6th St Allentown, PA | 3.0 | 1.0 | 967 | $1,700 | $1.76 | 16d | 1 | 0.79mi |
| 347 N 7th St Apt 3 Allentown, PA | 3.0 | 1.0 | 1200 | $1,500 | $1.25 | 46d | 1 | 0.79mi |
| 408 Washington St Unit 2W Allentown, PA | 2.0 | 1.0 | 1200 | $1,395 | $1.16 | 5d | 1 | 0.80mi |
| 535 Tilghman St Unit 1ST Allentown, PA | 2.0 | 1.0 | 900 | $1,495 | $1.66 | 5d | 1 | 0.84mi |
| 209 N Eighth St Apt 2 Allentown, PA | 3.0 | 1.0 | 1430 | $1,550 | $1.08 | 46d | 1 | 0.86mi |
| 440 N Hall St Unit 2 Allentown, PA | 2.0 | 1.0 | 989 | $1,400 | $1.42 | 46d | 1 | 0.89mi |
| 906 N 4th St Unit 2 Allentown, PA | 2.0 | 1.0 | 1077 | $1,300 | $1.21 | 26d | 1 | 0.91mi |
| 717 S Filmore St Allentown, PA | 2.0 | 1.0 | 950 | $1,745 | $1.84 | 5d | 1 | 0.92mi |
| 827 Linden St Unit 829-1 Allentown, PA | 2.0 | 2.0 | 1200 | $1,495 | $1.25 | 23d | 1 | 0.93mi |
| 854 N Penn St Allentown, PA | 3.0 | 1.5 | 1502 | $1,850 | $1.23 | 16d | 1 | 0.93mi |
| 829 Linden St Apt 1 Rear Allentown, PA | 2.0 | 2.0 | 1200 | $1,495 | $1.25 | 26d | 1 | 0.93mi |
Listing history 21 events
-
2026-06-23days on market $189,900 Active 97 DOM
-
2026-06-22days on market $189,900 Active 96 DOM
-
2026-06-18days on market $189,900 Active 93 DOM
-
2026-06-17days on market $189,900 Active 92 DOM
-
2026-06-16days on market $189,900 Active 91 DOM
-
2026-06-15days on market $189,900 Active 90 DOM
-
2026-06-14days on market $189,900 Active 88 DOM
-
2026-06-10days on market $189,900 Active 85 DOM
-
2026-06-09days on market $189,900 Active 84 DOM
-
2026-06-08days on market $189,900 Active 83 DOM
-
2026-06-07days on market $189,900 Active 82 DOM
-
2026-06-03days on market $189,900 Active 78 DOM
-
2026-06-02days on market $189,900 Active 77 DOM
-
2026-06-01days on market $189,900 Active 76 DOM
-
2026-05-31days on market $189,900 Active 75 DOM
-
2026-05-31days on market $189,900 Active 74 DOM
-
2026-05-11price $189,900 795-char remark
Show marketing remark (795 chars)
Welcome to this freshly updated Allentown end of row home offering 3 bedrooms and 1.5 bathrooms. Step inside to new laminate flooring throughout. The spacious living and dining areas flow nicely into the updated kitchen featuring new cabinets, new countertops, and new gas range. Upstairs you’ll find generously sized bedrooms and a full bathroom. The home also features efficient gas heat and replacement windows. Out back, enjoy a private fenced yard—perfect for relaxing or entertaining. Conveniently located to major routes, shopping, restaurants, and public transportation. Whether you’re a first-time buyer or investor, this move-in-ready home offers great value and low-maintenance living. LOW TAXES. PROPERTY IS BEING SOLD WITH A CLEAR CO THROUGH THE CITY OF ALLENTOWN.
-
2026-03-14$195,000 Active 795-char remark
Show marketing remark (795 chars)
Welcome to this freshly updated Allentown end of row home offering 3 bedrooms and 1.5 bathrooms. Step inside to new laminate flooring throughout. The spacious living and dining areas flow nicely into the updated kitchen featuring new cabinets, new countertops, and new gas range. Upstairs you’ll find generously sized bedrooms and a full bathroom. The home also features efficient gas heat and replacement windows. Out back, enjoy a private fenced yard—perfect for relaxing or entertaining. Conveniently located to major routes, shopping, restaurants, and public transportation. Whether you’re a first-time buyer or investor, this move-in-ready home offers great value and low-maintenance living. LOW TAXES. PROPERTY IS BEING SOLD WITH A CLEAR CO THROUGH THE CITY OF ALLENTOWN.
-
2004-03-17soldstatus $27,200
-
2004-03-12soldstatus $27,200 106-char remark
Show marketing remark (106 chars)
Move in condition end of row with 3 bedrooms, 1.5 baths, new carpet & flooring, all freshly painted.
-
2004-01-24$32,500 106-char remark
Show marketing remark (106 chars)
Move in condition end of row with 3 bedrooms, 1.5 baths, new carpet & flooring, all freshly painted.
ⓘ Source: listings_history table (triggers on properties + properties_extension) + one-shot
backfill from property_details.listing_events for pre-trigger history.
Tax reassessment forecast PA · Partial reset (capped growth)
- Current annual tax
- $1,600 · $133/mo
- Projected year-2 tax
- $2,300 · $192/mo
- Expected delta
- +$700/yr (+$58/mo · 43.7%)
ⓘ Screening estimate from a state-policy table — verify with the county assessor before closing.
Climate risk First Street
- Flood 6/10 Major FEMA zone X (unshaded) · 27% chance over 30 yrs
- Wildfire 3/10 Moderate
- Heat 5/10 Major 7 d/yr ≥99°F today · 15 d/yr by 30 yrs out
- Wind 4/10 Moderate 16% chance of damaging wind over 30 yrs
- Air quality 3/10 Moderate 3 unhealthy d/yr today · 4 by 30 yrs out
Nearby sold comps map
Loading sold comps map…
Walkable amenities ~0.75 mi
Loading nearby amenities…
Taxation est. · year 1
- Rental income
- $20,840
- − Mortgage interest
- −$10,637
- − Property taxes
- −$1,600
- − Insurance
- −$950
- − Repairs & maintenance
- −$1,667
- − Management
- −$1,667
- − Depreciation
- −$5,524
- Taxable loss
- −$1,206
- Est. tax savings @ 24.0%
- +$289
- After-tax cash flow
- $2,253/yr
For passive investors: Depreciation is non-cash, so a rental often shows a tax loss while cash-flowing — sheltering income. Rental losses are passive: they offset passive income freely, and up to $25,000/yr can offset ordinary (W-2) income if you actively participate and your MAGI is under $100k (phasing out to $0 by $150k); unused losses carry forward. On sale, claimed depreciation is recaptured at up to 25%, and gains may owe capital-gains tax (a 1031 exchange can defer both). Figures are a year-1 estimate at your 24.0% rate — not tax advice; consult a CPA.
Schools (NCES district)
- District
- Allentown City SD
- NCES district ID
- 4202280
- Math proficiency
- 10% ▼ -10.00%
- Reading proficiency
- 20% ▼ -15.00%
- Median HH income
- $36,337
- Composite
- 12.43/100
- National rank
- #9630
- State rank
- #513 of 539 in PA
Livability — Allentown
- Score
- 81/100
- State rank
- #171
- US rank
- #1440
Category grades
Schools grade is shown separately in the Schools card above.
Census & demographics
- Census place
- Allentown, PA
- County
- Lehigh County · 333,019 people
- City population
- 172,996
- Metro
- Allentown-Bethlehem-Easton, PA-NJ
- Population (ZIP)
- 6,120
- Household income
- $44,773
- Rent vs Own
- Severe rent burden
- 660.0
Population outlook (Lehigh County) Hauer SSP2
- Today (2025)
- 392,957 people
- By 2030
- 408,319 · +3.9%
- By 2040
- 440,007 · +12.0%
- By 2050
- 475,940 · +21.1%
- By 2075
- 590,448 · +50.3%
- By 2100
- 690,314 · +75.7%
Race, ethnicity, and origin ACS 2023
- Neighborhood character
- Diverse neighborhood (Simpson 0.66)
- Race & ethnicity
- Hispanic / Latino 47% Black 27% Two or more races 23% White 22% Asian 3%
- Hispanic origin (detail)
- Puerto Rican 25% Dominican 13%
- Common ancestry
- Romanian 3% Polish 1% Dutch 1%
- Foreign-born
- 13% · Canada, South Korea
- Languages at home
- 61% English-only · Spanish 35% Other Indo-European 1% Russian/Polish/Slavic 1%
Political lean MEDSL · Lehigh
- 2024 margin
- Toss-up / Even · D 50.7% · R 48.0% · Other 1.2%
- 2008→2024 swing
- -12.9pp toward R · 2008: 15.6pp · 2024: 2.7pp
- All cycles
- 2024: D+2.7 2020: D+7.6 2016: D+4.4 2012: D+7.5 2008: D+15.6
Not yet ingested
- Civics
- —
Market trends
- HPI YoY
- ▼ -1.94%
- Current HPI
- 326.4766
- Rent YoY
- ▲ 3.36%
- Metro
- Allentown-Bethlehem-Easton, PA-NJ
- State GDP YoY
- ▲ 1.68%
- F500 in state
- 34
Industry mix (Fortune 500 HQ in PA)
| Industry | F500 HQs | Revenue |
|---|---|---|
| Healthcare | 2 | $309B |
|
||
| Insurance | 2 | $27B |
|
||
| Telecommunications / Media | 1 | $124B |
|
||
| Industrial Distribution | 1 | $22B |
|
||
| Financial Services | 1 | $20B |
|
||
| Chemicals / Materials | 1 | $18B |
|
||
Price history
+484.3% since first listed5 events — show timeline
- 2026-05-11 Price Changed $189,900 GLVRMLS
- 2026-03-14 Listed $195,000 GLVRMLS
- 2004-03-17 Sold (Public Records) $27,200 Public Records
- 2004-03-12 Sold (MLS) $27,200 GLVRMLS
- 2004-01-24 Listed $32,500 GLVRMLS
Property tax history
-1.9%/yrLatest (2026): $1,600 · +0.8% YoY. Source: county tax records.
Cash-flow waterfall
monthlySold comps — $/sqft
last 12 mo · ≤1 miLoading sold comps…