141 Leon Ave · Rhome, TX
Flood risk 1/10 · Minimal
- FEMA flood zone
- X (unshaded)
- Chance of flooding over 30 yrs
- 0.0%
- Est. flood insurance / yr
- $507 – $1,088
Fire risk 7/10 · Major
- Est. fire insurance / yr
- $1,222 – $2,270
Heat risk 7/10 · Major
- Hot days now (above 109°F)
- 7 days/yr
- Hot days in 30 yrs
- 20 days/yr
Wind risk 6/10 · Moderate
- Chance of severe wind over 30 yrs
- 27.0%
Air-quality risk 2/10 · Minimal
- Unhealthy air days now
- 1 days/yr
- Unhealthy air days in 30 yrs
- 2 days/yr
Risk factors via First Street. Map © Google.
Why this score? — see what drove the D- grade
The composite is a weighted blend of 9 inputs, each scored 0–100. Each bar is that input's sub-score; the figure is the points it added to the 100-point composite (weight × sub-score).
- Appreciation +10.0/10.0
- ARV discount +8.3/15.0
- Cash flow +5.9/30.0
- Schools +4.6/10.0
- Livability +3.7/5.0
- Rent growth +2.5/5.0
- Condition / age +2.5/5.0
- 1% rule +1.5/10.0
- DSCR +0.2/10.0
$364,990
🖨 Deal sheet (PDF) 📄 Offer letter ✓ Due diligence
Listing remarks
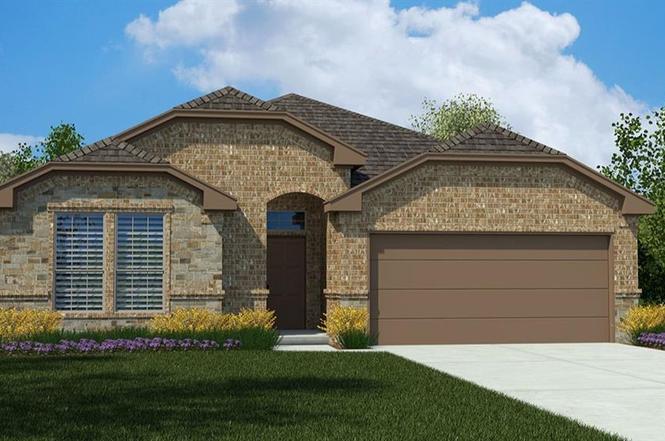
New phase now selling! D. R. Horton America's Builder is now selling the new phase in the fabulous community of Bluestem in Rhome and Northwest ISD! A Master Planned Community offering spacious open floor plans, new interior and exterior design elements with cutting edge products and features for every stage in life! Stunning 4 bedroom Crownpoint Floorplan-Elevation A, with an estimated Summer completion. Large Chef's Kitchen with Quartz Countertops, Stainless Steel Appliances, Gas Range, Island, Pendant Lights, Butlers and walk-in Pantry. Mud Bench and large main Bedroom with dual sink Quartz top Vanity, over sized Shower. Partial Gutters, front Coach Lights, Tankless Water Heater, Designe
Key facts
- Quartz countertops
- Mud bench
- Butlers pantry
Tags
Property features AI
Finance
- Financial info: Financing options include Cash, Conventional, FHA, and VA
- HOA & community: Mandatory HOA (managed by CCMC); HOA fee $960 annually; HOA includes full use of facilities and management fees; Community features: pool, park, playground, jogging/bike path, sidewalks, curbs
Exterior
- Parking: Attached 2-car garage with garage door opener; 2 covered parking spaces; Garage faces front
- Security: Smoke detector(s)
- Utilities: City water and city sewer; Individual water and gas meters; Electricity available and connected; Natural gas available; Cable and phone available; Sidewalks, curbs, concrete, and underground utilities; Community mailbox
- Home design: Single-family residence; One level; New construction (incomplete, year built 2026); Not attached to other units; Smoke detectors
- Construction: Brick, frame, and rock/stone exterior; Composition roof; Slab foundation
- Exterior features: Covered rear porch; Covered front porch; Gutters; Private yard; Wood fencing in back yard; Sprinkler system; Landscaped; Corner lot with few trees; Subdivision setting
Interior
- Kitchen: Dishwasher; Disposal; Gas range; Microwave; Plumbed for gas in kitchen; Solid surface (non-natural) counters; Built-in cabinets; Walk-in pantry; Kitchen island
- Bedrooms: 4 bedrooms (all on the main level); Primary bedroom with dual sinks, linen closet, separate shower, and walk-in closet; Other bedrooms configured with split-bedroom layout
- Flooring: Carpet
- Bathrooms: 2 full bathrooms
- Heating & cooling: Central heating (electric); Central air (electric); Ceiling fans
- Interior features: Open floorplan with decorative lighting; Eat-in kitchen with kitchen island and pantry; Cable TV and high-speed internet available; Smart home system; Vented exhaust fan
- Laundry & utility: Utility room / separate laundry room; Full-size washer/dryer area; Washer hookup; Electric dryer hookup; Tankless water heater; Gas water heater
Neighborhood map
What this means for you Summary
Snapshot
- This is a 4-bed/2.0-bath single-family listed at $365k.
Deal economics
- At list price, monthly cash flow is $-721 ($-9k/yr) — negative.
- To cash-flow at today's rent, offer at most $261k (28.6% below list).
- To meet the 1% rule (rent ≥ 1% of price), the offer needs to be $238k (34.8% below list).
- Recommended offer: $238k (34.8% below list) — sets the bar for 1% rule.
Location & tenants
- Location reads 74/100 on livability (#165 in TX, #4,376 nationally) — a middle-class / working-renter tenant base. Strengths: cost of living A+, housing A+, crime A-; Watch: amenities F, commute F.
- Northwest ISD (rural): math 48% / reading 52% proficiency, ranked #120 of 826 in TX (top 14%) — acceptable for families but not a draw, mixed tenant base, ~2y average lease.
- Zoned schools: Seven Hills El (math 28% / reading 33%, grade F, #2,464 of 4,322 statewide, top 58%, 667 students, 48% FRL); Chisholm Trail Middle (math 39% / reading 35%, grade F, #756 of 1,662 statewide, top 47%, 684 students, 51% FRL); Northwest H S (math 55% / reading 64%, grade C+, #275 of 1,632 statewide, top 19%, 2,264 students, 0% FRL).
- Market conditions: 264 active listings in the ZIP; 3 comparable units currently listed for rent nearby; rentals leasing fast (median 0d on market — plan ~1-2 weeks tenant-placement turnaround); solid renter incomes; 460 units permitted in Wise County in 2024 (243 in 5+ unit buildings).
Forward outlook
- In year one you build about $39k of equity ($3k loan paydown + $36k appreciation (10.0% local appreciation)).
- Wise County population projected at +27% by 2050 — long-run rental-demand tailwind backs the buy-and-hold thesis.
- By year 2, paydown + projected appreciation supports a ~$63k cash-out refi (75% LTV) — recoverable capital for the next deal without selling this one.
Negotiation context
- It's been on market 64 days — a 6% lower offer ($343k) is reasonable based on typical stale-listing flexibility.
Risks & watch-outs
- Climate carrying-cost: major wind risk, 27% chance of damaging wind over 30y; major wildfire risk; extreme-heat days projected 7→20/yr by 2055 (HVAC capex compounding) — expect insurance premiums to compound above CPI over the hold.
Questions for the listing agent
- What do current leases actually rent for vs. the listed asking? Can we see a recent rent roll and the last 12 months of T-12 income?
- It's been on market 64 days. Have you received any prior offers? Is the seller open to a 35% concession, seller financing, or rate buy-down credit?
- What does the HOA fee cover, when was the last increase, and are there any pending special assessments or reserve-fund shortfalls?
- Why hasn't it sold? Are there any deal-killer items the seller is aware of (foundation, flood, title, zoning, code violations)?
- Is there a deadline driving the sale (1031 exchange, divorce, estate, relocation)? That informs how much negotiation room exists.
- Schools are D-rated, which usually means shorter tenancies and higher turnover. Who's the typical renter profile here, and what's been the actual vacancy rate?
- The area grade is low — what's the realistic commute time and amenity access for the typical tenant pool here? Any planned neighborhood developments (good or bad) we should know about?
- What's the average days-on-market for RENTAL listings here right now (not sales)? A rising rental-DOM trend means longer vacancies and softer asking-rent achievability than the comps imply.
- What's the recent tenant-quality profile in this submarket — average credit score on applications, eviction rate, late-payment / NSF rate, and stable-employment percentage? A property-management company in the area should have these aggregated.
- How much new for-sale + rental construction is in the pipeline within 1–3 miles? Heavy new supply typically softens prices + rents 12–24 months out; constrained supply supports both.
Investment metrics
- 1% rule
- 0.65% ✗
- Cap rate
- 3.92%
- Cash-on-cash
- -8.47%
- DSCR
- 0.62
- GRM
- 12.8
CMA / ARV
- ARV (on-the-fly)
- $371,360
- Comps found
- 12
Show comp detail 12 sales within ~0.75 mi
| Address | Dist | Beds/Ba | Sqft | Sold | Price | $/sf | Match |
|---|---|---|---|---|---|---|---|
| 141 Leon Ave | 0.00mi | 4/2.0 | 2,110 (0%) | 1mo | $364,990 | $173 | 100 |
| 118 Stanton Ave | 0.04mi | 4/2.0 | 2,110 (0%) | 1mo | $364,990 | $173 | 98 |
| 239 Windmill Dr | 0.05mi | 4/2.0 | 2,110 (0%) | 1mo | $379,605 | $180 | 96 |
| 119 Castell Ct | 0.06mi | 4/2.0 | 2,014 (-4%) | 3mo | $344,990 | $171 | 87 |
| 122 Stanton Ave | 0.05mi | 5/3.0 (+1) | 2,095 (-1%) | 2mo | $359,990 | $172 | 86 |
| 133 Medina Ln | 0.14mi | 4/2.0 | 2,014 (-4%) | 2mo | $354,990 | $176 | 85 |
| 130 Stanton Ave | 0.07mi | 5/3.0 (+1) | 2,120 (+0%) | 3mo | $371,790 | $175 | 85 |
| 127 Castell Ct | 0.09mi | 5/3.0 (+1) | 2,120 (+0%) | 2mo | $378,790 | $179 | 84 |
| 110 Stanton Ave | 0.02mi | 4/2.0 | 1,837 (-13%) | 0mo | $344,990 | $188 | 77 |
| 227 Buffalo Blvd | 0.33mi | 3/2.5 (-1) | 2,168 (+3%) | 1mo | $419,900 | $194 | 72 |
| 262 Lunayena Rd | 0.38mi | 5/2.5 (+1) | 2,141 (+2%) | 1mo | $360,000 | $168 | 72 |
| 138 Sandie Dr | 0.46mi | 4/3.0 | 2,399 (+14%) | 2mo | $489,990 | $204 | 50 |
Match score weights: distance 35% · size 25% · config 20% · recency 20%. Top-matched comps best support the ARV.
Projected returns pro-forma
10.0% appreciation · 3.0% rent growth · sell at horizon
- IRR
- 18.3%
- Equity multiple
- 2.50×
- Total profit
- $152,934
- Equity at exit
- $328,812
- IRR
- 17.1%
- Equity multiple
- 5.76×
- Total profit
- $486,657
- Equity at exit
- $709,095
Cash invested: $102,197 (down + closing). Projections, not guarantees.
Landlord ↔ Tenant lean methodology
- Overall (STATE)
- 87 Strongly Landlord-Friendly
- State Texas
- 87 Strongly Landlord-Friendly · R+5
- County
- — inherits STATE
- City
- — inherits STATE
ZIP-level market 76078
- Home prices YoY
- 6.5%
- Active inventory
- 264
- Price-to-rent
- 12.8×
Monthly cashflow live
- Estimated rent
- $2,381 medium interval (Pro) →
- Mortgage (P&I)
- −$1,914
- Tax est. 1.5%
- −$456 /mo · $5,475/yr
- Insurance
- −$152
- HOA
- −$80
- Vacancy / Maint / Mgmt
- −$500
- Net cashflow
- $-721
Break-even live
Sensitivity live
| Price | -10% $-469 | -5% $-595 | +0% $-721 | +5% $-847 | +10% $-973 |
|---|---|---|---|---|---|
| Rent | -10% $-909 | -5% $-815 | +0% $-721 | +5% $-627 | +10% $-533 |
| Rate | -1.0pp $-537 | -0.5pp $-628 | base $-721 | +0.5pp $-816 | +1.0pp $-912 |
UW: 25.0% down · 7.5% · 30yr · 1.5% tax · 5.0% vac · 8.0% maint · 8.0% mgmt
Financing live
Cash to close
- Down payment
- $91,248
- Closing costs
- $10,950
- Reserves months
- —
- Total cash needed
- —
Loan-product check · same deal, 3 products live
Conventional
25% down · 7.5% · 30yr
- Down + closing
- —
- Monthly P&I
- —
- Monthly cashflow
- —
- DSCR
- —
- Eligible?
- —
Personal DTI + credit; lowest rate.
DSCR
20% down · 8.5% · 30yr
- Down + closing
- —
- Monthly P&I
- —
- Monthly cashflow
- —
- DSCR
- —
- Eligible?
- —
No personal income docs; deal must DSCR.
Hard money
10% down · 12.0% · 12mo
- Down + closing
- —
- Monthly P&I
- —
- Monthly cashflow
- —
- DSCR
- —
- Eligible?
- —
Short-term bridge; refi at stabilization.
Rent comps 3 comps
| Address | Beds | Baths | Sqft | Rent | $/sqft | DOM | Units | Dist |
|---|---|---|---|---|---|---|---|---|
| 135 Lunayena Rd Rhome, TX | 4.0 | 2.0 | 2039 | $2,200 | $1.08 | 0d | 1 | 0.31mi |
| 135 Lunayena Rd Rhome, TX | 4.0 | 2.0 | 2039 | $2,200 | $1.08 | 24d | 1 | 0.31mi |
| 197 Private Road 4652 Unit 4652 Rhome, TX | 3.0 | 2.0 | 1428 | $2,295 | $1.61 | 0d | 1 | 1.21mi |
HOA detail
- Monthly dues
- $80 · $960/yr
- Likely covers
- watergas
Listing history 5 events
-
2026-04-23status Pending
-
2026-04-09price $364,990
-
2026-04-01price $389,218
-
2026-02-25price $383,150
-
2026-02-18$393,150 Active
ⓘ Source: listings_history table (triggers on properties + properties_extension) + one-shot
backfill from property_details.listing_events for pre-trigger history.
Climate risk First Street
- Flood 1/10 Low FEMA zone X (unshaded) · 0% chance over 30 yrs
- Wildfire 7/10 Severe
- Heat 7/10 Severe 7 d/yr ≥109°F today · 20 d/yr by 30 yrs out
- Wind 6/10 Major 27% chance of damaging wind over 30 yrs
- Air quality 2/10 Low 1 unhealthy d/yr today · 2 by 30 yrs out
Nearby sold comps map
Loading sold comps map…
Walkable amenities ~0.75 mi
Loading nearby amenities…
Taxation est. · year 1
- Rental income
- $28,575
- − Mortgage interest
- −$20,445
- − Property taxes
- −$5,475
- − Insurance
- −$1,825
- − Repairs & maintenance
- −$2,286
- − Management
- −$2,286
- − HOA
- −$960
- − Depreciation
- −$10,618
- Taxable loss
- −$15,320
- Est. tax savings @ 24.0%
- +$3,677
- After-tax cash flow
- $-4,978/yr
For passive investors: Depreciation is non-cash, so a rental often shows a tax loss while cash-flowing — sheltering income. Rental losses are passive: they offset passive income freely, and up to $25,000/yr can offset ordinary (W-2) income if you actively participate and your MAGI is under $100k (phasing out to $0 by $150k); unused losses carry forward. On sale, claimed depreciation is recaptured at up to 25%, and gains may owe capital-gains tax (a 1031 exchange can defer both). Figures are a year-1 estimate at your 24.0% rate — not tax advice; consult a CPA.
Schools (NCES district)
- District
- Northwest ISD
- NCES district ID
- 4833180
- Math proficiency
- 48% ▼ -15.00%
- Reading proficiency
- 52% ▼ -8.00%
- Median HH income
- $85,315
- Composite
- 46.15/100
- National rank
- #2504
- State rank
- #120 of 826 in TX
Livability — Rhome
- Score
- 74/100
- State rank
- #165
- US rank
- #4376
Category grades
Schools grade is shown separately in the Schools card above.
Census & demographics
- County
- Wise County · 49,037 people
- City population
- 10,200
- Metro
- Dallas-Fort Worth-Arlington, TX
- Population (ZIP)
- 10,828
- Household income
- $99,866
- Rent vs Own
- Severe rent burden
- 10.0
Population outlook (Wise County) Hauer SSP2
- Today (2025)
- 71,620 people
- By 2030
- 75,858 · +5.9%
- By 2040
- 83,908 · +17.2%
- By 2050
- 90,717 · +26.7%
- By 2075
- 107,583 · +50.2%
- By 2100
- 114,996 · +60.6%
Race, ethnicity, and origin ACS 2023
- Neighborhood character
- Predominantly White (69%)
- Race & ethnicity
- White 69% Hispanic / Latino 24% Two or more races 11% Native American 4% Black 2%
- Hispanic origin (detail)
- Mexican 20% Puerto Rican 3%
- Common ancestry
- Slovak 2% Lithuanian 2% Italian 1%
- Foreign-born
- 6% · Canada
- Languages at home
- 85% English-only · Spanish 14% German/W. Germanic 1%
Political lean MEDSL · Wise
- 2024 margin
- Solid R (+70.0) · D 14.7% · R 84.7%
- 2008→2024 swing
- -14.3pp toward R · 2008: -55.7pp · 2024: -70.0pp
- All cycles
- 2024: R+70.0 2020: R+68.2 2016: R+69.9 2012: R+67.5 2008: R+55.7
Not yet ingested
- Civics
- —
Market trends
- HPI YoY
- ▲ 19.94%
- Current HPI
- 325.22
- Rent YoY
- —
- Metro
- Dallas-Fort Worth-Arlington, TX
- State GDP YoY
- ▲ 3.95%
- F500 in state
- 110
Industry mix (Fortune 500 HQ in TX)
| Industry | F500 HQs | Revenue |
|---|---|---|
| Energy | 16 | $1,198B |
|
||
| Technology | 5 | $198B |
|
||
| Engineering / Construction | 4 | $72B |
|
||
| Energy Services | 3 | $60B |
|
||
| Utilities | 3 | $41B |
|
||
| Healthcare | 2 | $330B |
|
||
Price history
-7.2% since first listed5 events — show timeline
- 2026-04-23 Pending — NTREIS
- 2026-04-09 Price Changed $364,990 NTREIS
- 2026-04-01 Price Changed $389,218 NTREIS
- 2026-02-25 Price Changed $383,150 NTREIS
- 2026-02-18 Listed $393,150 NTREIS
Cash-flow waterfall
monthlySold comps — $/sqft
last 12 mo · ≤1 miLoading sold comps…