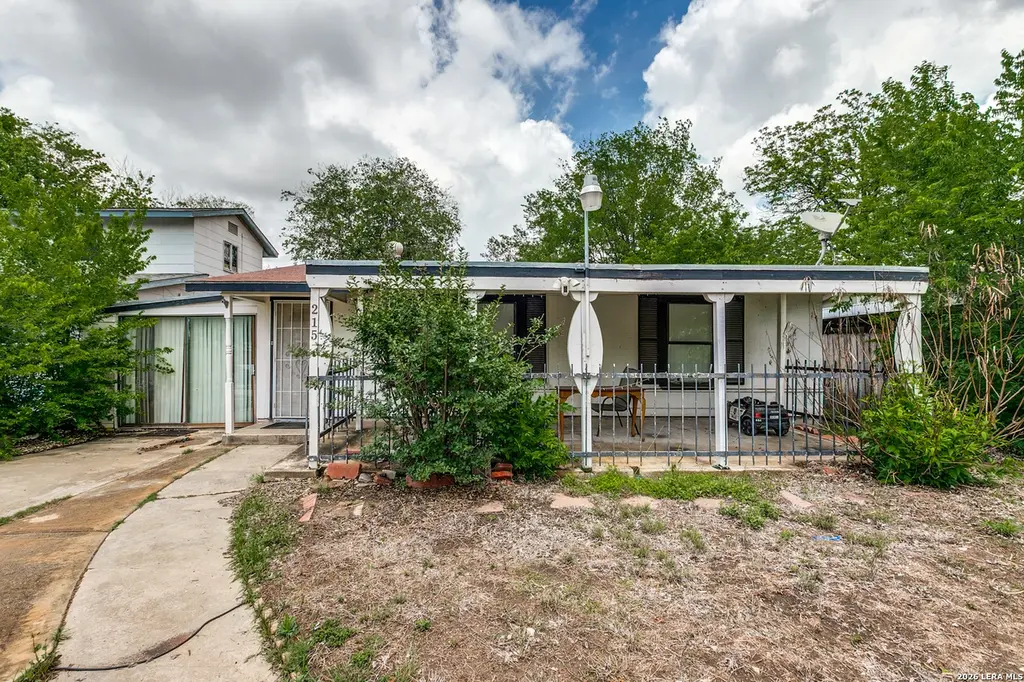
215 W Academy St · San Antonio, TX
Flood risk 1/10 · Minimal
- FEMA flood zone
- X (unshaded)
- Chance of flooding over 30 yrs
- 0.0%
- Est. flood insurance / yr
- $507 – $1,088
Fire risk 1/10 · Minimal
- Est. fire insurance / yr
- $1,222 – $2,270
Heat risk 8/10 · Major
- Hot days now (above 108°F)
- 7 days/yr
- Hot days in 30 yrs
- 22 days/yr
Wind risk 8/10 · Major
- Chance of severe wind over 30 yrs
- 80.0%
Air-quality risk 2/10 · Minimal
- Unhealthy air days now
- 1 days/yr
- Unhealthy air days in 30 yrs
- 2 days/yr
Risk factors via First Street. Map © Google.
Why this score? — see what drove the B+ grade
The composite is a weighted blend of 9 inputs, each scored 0–100. Each bar is that input's sub-score; the figure is the points it added to the 100-point composite (weight × sub-score).
- Cash flow +28.1/30.0
- ARV discount +15.0/15.0
- 1% rule +10.0/10.0
- DSCR +10.0/10.0
- Livability +4.0/5.0
- Appreciation +3.9/10.0
- Rent growth +2.5/5.0
- Condition / age +2.5/5.0
- Schools +1.3/10.0
$100,000
🖨 Deal sheet (PDF) 📄 Offer letter ✓ Due diligence
Listing remarks
Vacant property ready for its next chapter! This home is being sold as-is and presents a great opportunity for investors, renovators, or buyers looking to customize a space to their liking. Property has not been recently occupied, and current condition is unknown. Buyer to independently verify all details, including systems and overall condition.
Key facts
- 6,621 sq ft lot
- Built 1953
Property features AI
Finance
- HOA & community: Located in the Edgewood subdivision
Exterior
- Parking: Covered parking not specified
- Utilities: City water and sewer
- Home design: Wood exterior; Faces south; Pre-owned property
- Construction: Approximately 73 years old; Slab foundation; Composition roof
- Exterior features: Covered patio; Patio slab; Privacy fence; Storage building / shed; Paved streets, curbs, sidewalks, and alley access
Interior
- Kitchen: Kitchen — 11 x 8
- Bedrooms: Master bedroom (lower level) — 18 x 17; Bedroom 2 — 12 x 9; Bedroom 3 — 12 x 11
- Flooring: Ceramic tile floors
- Bathrooms: 2 full bathrooms; Master bathroom with shower only — 9 x 5
- Heating & cooling: Natural gas heating
- Interior features: Ceiling fans; Washer and dryer connections; All window coverings remain; One living area
- Laundry & utility: Utility room — 12 x 10; Washer and dryer connections
Neighborhood map
What this means for you Summary
Snapshot
- This is a 3-bed/1.0-bath single-family listed at $100k.
Deal economics
- At list price, monthly cash flow is $314 ($4k/yr) — positive.
- The deal already cash-flows at list — no discount required.
- Meets the 1% rule at list price ($2k rent vs $100k).
- Cap rate 10.1% vs local median 3.8% in San Antonio — top-decile yield for the area; either an underpriced asset or a hidden risk that comps aren't pricing in. Stress-test before assuming the spread holds.
Location & tenants
- Location reads 80/100 on livability (#31 in TX, #1,616 nationally) — a professional / high-income tenant draw. Strengths: amenities A+, commute A+, cost of living A+; Watch: crime F.
- Edgewood ISD (urban): math 12% / reading 21% proficiency, ranked #812 of 826 in TX (top 98%) — low school quality limits family demand, transient renter base, plan for 1-2y turnover.
- Zoned schools: Alonso S Perales El (math 22% / reading 27%, grade F, #3,052 of 4,322 statewide, top 74%, 353 students, 93% FRL); John F Kennedy H S (math 17% / reading 18%, grade F, #1,451 of 1,632 statewide, top 89%, 1,042 students, 92% FRL) — zoned schools average 93% FRL vs 24% district-wide (68 pts higher); higher-poverty schools than district average — tighter screening recommended.
- Market conditions: 8 active listings in the ZIP; 7 comparable units currently listed for rent nearby; rentals at typical pace (median 25d on market — plan ~3-4 weeks tenant-placement turnaround); 8,308 units permitted in Bexar County in 2024 (2,506 in 5+ unit buildings).
Forward outlook
- Local home prices are declining (-2.3%/yr); year-one equity from $691 of loan paydown is wiped out by about $2k of value loss. Plan a longer hold.
- Bexar County population projected at +50% by 2050 — long-run rental-demand tailwind backs the buy-and-hold thesis.
- At projected returns (-2.3% appreciation + 3.0% rent growth), your $28k cash investment doubles in ~8 years — after that, you're playing with house money.
Negotiation context
- Only 1 days on market — expect competitive offers; lowballing is unlikely to land.
- 3 sale attempts with the ask held roughly flat each time — persistent listings suggest the price (not the market) is what's stuck; bring a comps-based counter.
Risks & watch-outs
- Watch-outs: property tax is 4.0% of price; built in 1953 — expect roof / HVAC / electrical / plumbing capex.
- Climate carrying-cost: severe wind risk, 80% chance of damaging wind over 30y; extreme-heat days projected 7→22/yr by 2055 (HVAC capex compounding) — expect insurance premiums to compound above CPI over the hold.
Questions for the listing agent
- Built in 1953 — when were the roof, HVAC, electrical panel, plumbing, and water heater last replaced?
- Property tax is high relative to price — has the assessment been appealed recently, and will the sale trigger a re-assessment?
- Is there a deadline driving the sale (1031 exchange, divorce, estate, relocation)? That informs how much negotiation room exists.
- Crime grade is F in this area — have there been break-ins, vandalism, or insurance claims at this property in the last 3 years? What carrier currently insures it and at what premium?
- What's the average days-on-market for RENTAL listings here right now (not sales)? A rising rental-DOM trend means longer vacancies and softer asking-rent achievability than the comps imply.
- What's the recent tenant-quality profile in this submarket — average credit score on applications, eviction rate, late-payment / NSF rate, and stable-employment percentage? A property-management company in the area should have these aggregated.
- How much new for-sale + rental construction is in the pipeline within 1–3 miles? Heavy new supply typically softens prices + rents 12–24 months out; constrained supply supports both.
Investment metrics
- 1% rule
- 1.53% ✓
- Cap rate
- 10.06%
- Cash-on-cash
- 13.44%
- DSCR
- 1.60
- GRM
- 5.4
CMA / ARV
- ARV (on-the-fly)
- $194,724
- Comps found
- 3
Show comp detail 3 sales within ~0.75 mi
| Address | Dist | Beds/Ba | Sqft | Sold | Price | $/sf | Match |
|---|---|---|---|---|---|---|---|
| 710 Darby | 0.34mi | 3/2.0 | 1,672 (-7%) | 3mo | $160,000 | $96 | 65 |
| 270 Lansing Ln | 0.74mi | 3/2.0 | 1,850 (+3%) | 15mo | $199,000 | $108 | 45 |
| 827 Cavalier Ave | 0.67mi | 3/2.5 | 1,800 (-0%) | 24mo | $280,000 | $156 | 43 |
Match score weights: distance 35% · size 25% · config 20% · recency 20%. Top-matched comps best support the ARV.
Projected returns pro-forma
-2.26% appreciation · 3.0% rent growth · sell at horizon
- IRR
- 6.1%
- Equity multiple
- 1.25×
- Total profit
- $7,025
- Equity at exit
- $18,219
- IRR
- 14.4%
- Equity multiple
- 2.26×
- Total profit
- $35,173
- Equity at exit
- $14,438
Cash invested: $28,000 (down + closing). Projections, not guarantees.
Landlord ↔ Tenant lean methodology
- Overall (STATE)
- 87 Strongly Landlord-Friendly
- State Texas
- 87 Strongly Landlord-Friendly · R+5
- County
- — inherits STATE
- City
- — inherits STATE
ZIP-level market 78226
- Home prices YoY
- -0.9%
- Active inventory
- 8
- Price-to-rent
- 5.4×
Monthly cashflow live
- Estimated rent
- $1,530 high interval (Pro) →
- Mortgage (P&I)
- −$524
- Tax from tax record
- −$329 /mo · $3,951/yr
- Insurance
- −$42
- HOA
- −$0
- Vacancy / Maint / Mgmt
- −$321
- Net cashflow
- $314
Break-even live
Sensitivity live
| Price | -10% $370 | -5% $342 | +0% $314 | +5% $285 | +10% $257 |
|---|---|---|---|---|---|
| Rent | -10% $193 | -5% $253 | +0% $314 | +5% $374 | +10% $434 |
| Rate | -1.0pp $364 | -0.5pp $339 | base $314 | +0.5pp $288 | +1.0pp $261 |
UW: 25.0% down · 7.5% · 30yr · 1.5% tax · 5.0% vac · 8.0% maint · 8.0% mgmt
Financing live
Cash to close
- Down payment
- $25,000
- Closing costs
- $3,000
- Reserves months
- —
- Total cash needed
- —
Loan-product check · same deal, 3 products live
Conventional
25% down · 7.5% · 30yr
- Down + closing
- —
- Monthly P&I
- —
- Monthly cashflow
- —
- DSCR
- —
- Eligible?
- —
Personal DTI + credit; lowest rate.
DSCR
20% down · 8.5% · 30yr
- Down + closing
- —
- Monthly P&I
- —
- Monthly cashflow
- —
- DSCR
- —
- Eligible?
- —
No personal income docs; deal must DSCR.
Hard money
10% down · 12.0% · 12mo
- Down + closing
- —
- Monthly P&I
- —
- Monthly cashflow
- —
- DSCR
- —
- Eligible?
- —
Short-term bridge; refi at stabilization.
Rent comps 7 comps
| Address | Beds | Baths | Sqft | Rent | $/sqft | DOM | Units | Dist |
|---|---|---|---|---|---|---|---|---|
| 2114 Jupiter St San Antonio, TX | 3.0 | 3.0 | 1233 | $1,457 | $1.18 | 22d | 1 | 0.35mi |
| 118 Carthage Ct San Antonio, TX | 3.0 | 2.0 | 1368 | $1,450 | $1.06 | 18d | 1 | 0.88mi |
| 2003 S Zarzamora St San Antonio, TX | 1.0–4.0 | 1.0–2.0 | 1028 | $1,257 | $1.22 | 24d | 1 | 1.14mi |
| 323 Thompson Pl San Antonio, TX | 4.0 | 2.0 | 1600 | $1,800 | $1.12 | 44d | 1 | 1.36mi |
| 542 Drake Ave San Antonio, TX | 3.0 | 2.0 | 1368 | $1,875 | $1.37 | 44d | 1 | 1.40mi |
| 909 Sims Ave San Antonio, TX | 4.0 | 2.0 | 1400 | $1,750 | $1.25 | 24d | 1 | 1.44mi |
| 2910 S Laredo St Unit 2 San Antonio, TX | 2.0 | 2.0 | 2127 | $1,295 | $0.61 | 4d | 1 | 1.50mi |
Listing history 2 events
-
2026-05-31remarks 348-char remark
-
2026-05-31$100,000 Pending 1 DOM
ⓘ Source: listings_history table (triggers on properties + properties_extension) + one-shot
backfill from property_details.listing_events for pre-trigger history.
Tax reassessment forecast TX · Resets to sale price
- Current annual tax
- $3,951 · $329/mo
- Projected year-2 tax
- $3,951 · $329/mo
- Expected delta
- $0/yr ($0/mo · 0.0%)
ⓘ Screening estimate from a state-policy table — verify with the county assessor before closing.
Climate risk First Street
- Flood 1/10 Low FEMA zone X (unshaded) · 0% chance over 30 yrs
- Wildfire 1/10 Low
- Heat 8/10 Severe 7 d/yr ≥108°F today · 22 d/yr by 30 yrs out
- Wind 8/10 Severe 80% chance of damaging wind over 30 yrs
- Air quality 2/10 Low 1 unhealthy d/yr today · 2 by 30 yrs out
Nearby sold comps map
Loading sold comps map…
Walkable amenities ~0.75 mi
Loading nearby amenities…
Taxation est. · year 1
- Rental income
- $18,363
- − Mortgage interest
- −$5,602
- − Property taxes
- −$3,951
- − Insurance
- −$500
- − Repairs & maintenance
- −$1,469
- − Management
- −$1,469
- − Depreciation
- −$2,909
- Taxable income
- $2,463
- Est. tax owed @ 24.0%
- −$591
- After-tax cash flow
- $3,172/yr
For passive investors: Depreciation is non-cash, so a rental often shows a tax loss while cash-flowing — sheltering income. Rental losses are passive: they offset passive income freely, and up to $25,000/yr can offset ordinary (W-2) income if you actively participate and your MAGI is under $100k (phasing out to $0 by $150k); unused losses carry forward. On sale, claimed depreciation is recaptured at up to 25%, and gains may owe capital-gains tax (a 1031 exchange can defer both). Figures are a year-1 estimate at your 24.0% rate — not tax advice; consult a CPA.
Schools (NCES district)
- District
- Edgewood ISD
- NCES district ID
- 4818150
- Math proficiency
- 12% ▼ -18.00%
- Reading proficiency
- 21% ▼ -5.00%
- Median HH income
- $27,419
- Composite
- 12.82/100
- National rank
- #9597
- State rank
- #812 of 826 in TX
Livability — San Antonio
- Score
- 80/100
- State rank
- #31
- US rank
- #1616
Category grades
Schools grade is shown separately in the Schools card above.
Census & demographics
- Census place
- San Antonio, TX
- City population
- 1,806,925
- Population (ZIP)
- 6,907
Population outlook (Bexar County) Hauer SSP2
- Today (2025)
- 2,336,851 people
- By 2030
- 2,560,728 · +9.6%
- By 2040
- 3,020,569 · +29.3%
- By 2050
- 3,493,522 · +49.5%
- By 2075
- 4,668,459 · +99.8%
- By 2100
- 5,533,242 · +136.8%
Race, ethnicity, and origin ACS 2023
- Neighborhood character
- Predominantly Hispanic (87%)
- Race & ethnicity
- Hispanic / Latino 87% Two or more races 27% White 8% Black 4% Native American 2%
- Hispanic origin (detail)
- Mexican 73%
- Common ancestry
- Portuguese 1%
- Foreign-born
- 12% · Canada
- Languages at home
- 50% English-only · Spanish 50%
Political lean MEDSL · Bexar
- 2024 margin
- Lean D (+9.8) · D 54.3% · R 44.6% · Other 1.1%
- 2008→2024 swing
- +4.2pp toward D · 2008: 5.6pp · 2024: 9.8pp
- All cycles
- 2024: D+9.8 2020: D+18.2 2016: D+13.5 2012: D+4.6 2008: D+5.6
Not yet ingested
- Civics
- —
Market trends
- HPI YoY
- ▼ -2.26%
- Current HPI
- 244.9905
- Rent YoY
- —
- Metro
- —
- State GDP YoY
- ▲ 3.95%
- F500 in state
- 110
Industry mix (Fortune 500 HQ in TX)
| Industry | F500 HQs | Revenue |
|---|---|---|
| Energy | 16 | $1,198B |
|
||
| Technology | 5 | $198B |
|
||
| Engineering / Construction | 4 | $72B |
|
||
| Energy Services | 3 | $60B |
|
||
| Utilities | 3 | $41B |
|
||
| Healthcare | 2 | $330B |
|
||
Price history
-23.1% since first listed6 events — show timeline
- 2026-05-01 Listed $100,000 LERA
- 2026-05-01 Pending — LERA
- 2025-12-31 Listing Removed — LERA
- 2025-12-19 Listed $130,000 LERA
- 2025-11-20 Listing Removed — LERA
- 2025-06-12 Listed $130,000 LERA
Property tax history
+7.6%/yrLatest (2025): $3,951 · -3.9% YoY. Source: county tax records.
Cash-flow waterfall
monthlySold comps — $/sqft
last 12 mo · ≤1 miLoading sold comps…