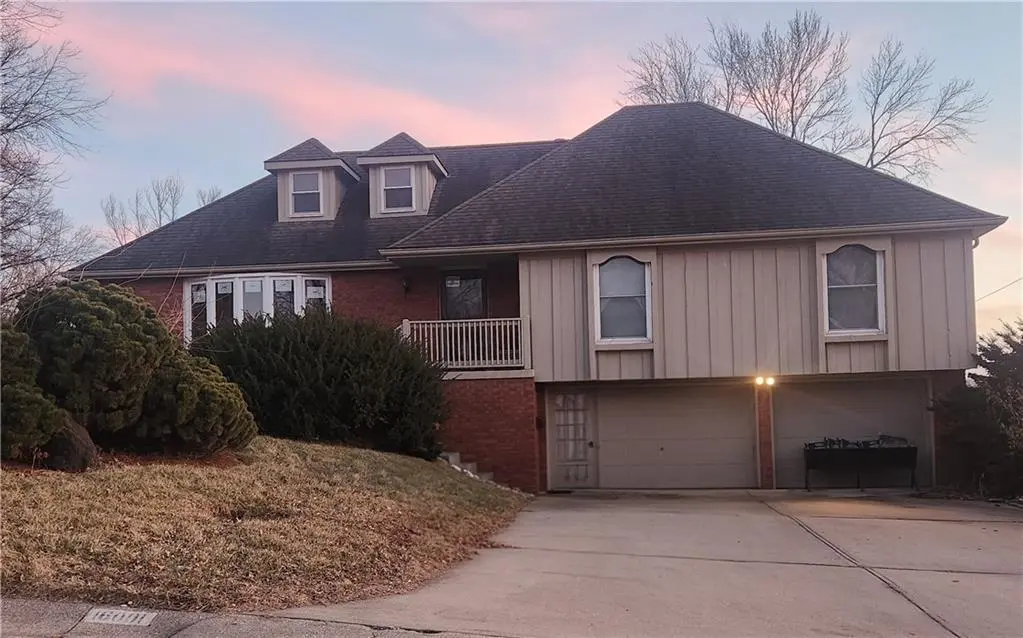
16001 E 30 St · Independence, MO
Flood risk 1/10 · Minimal
- FEMA flood zone
- X (unshaded)
- Chance of flooding over 30 yrs
- 0.0%
- Est. flood insurance / yr
- $473 – $860
Fire risk 1/10 · Minimal
- Est. fire insurance / yr
- $1,054 – $1,958
Heat risk 4/10 · Minor
- Hot days now (above 108°F)
- 7 days/yr
- Hot days in 30 yrs
- 17 days/yr
Wind risk 2/10 · Minimal
- Chance of severe wind over 30 yrs
- —
Air-quality risk 3/10 · Minor
- Unhealthy air days now
- 3 days/yr
- Unhealthy air days in 30 yrs
- 3 days/yr
Risk factors via First Street. Map © Google.
Why this score? — see what drove the C- grade
The composite is a weighted blend of 9 inputs, each scored 0–100. Each bar is that input's sub-score; the figure is the points it added to the 100-point composite (weight × sub-score).
- ARV discount +15.0/15.0
- Cash flow +14.6/30.0
- DSCR +4.4/10.0
- Livability +4.1/5.0
- 1% rule +4.0/10.0
- Rent growth +3.8/5.0
- Schools +2.7/10.0
- Condition / age +2.5/5.0
- Appreciation +0.0/10.0
$199,900
🖨 Deal sheet 📄 Offer letter ✓ Due diligence
Listing remarks
INVESTOR OPPORTUNITY!! Great location, nice floor plan, interior needs a lot of clean up and updating. Raised ranch floor plan with 3 bedrooms and 2 bathrooms on main level, a finished room upstairs that could be another bedroom or office. Ensuite bath in primary bedroom has been recently renovated and is beautiful. Large living room/dining room combo plus a family room with a fireplace. Some windows installed in 2025. Laundry room-half bath combo in basement. 2nd fireplace in basement, could make for another nice living space. Inground pool in back with torn vinyl liner.
Key facts
- 0.24 acre lot
- 2 garage spots
- Pool
Property features AI
Finance
- Other: Property listed in fixer condition; Not located in a flood plain
Exterior
- Parking: 2-car garage; Basement and built-in parking features
- Utilities: Public water; Public sewer
- Home design: Single-family residence; Raised ranch / 1.5-story; North-facing
- Construction: Board & batten siding with brick trim; Composition roof; Concrete basement
- Exterior features: Privacy wood fencing; In-ground pool; City lot on a corner
Interior
- Kitchen: Eat-in kitchen
- Bedrooms: 3 bedrooms (all on the first level)
- Flooring: Carpet; Vinyl
- Bathrooms: 2 full baths; 1 half bath; Shower only in one bathroom; Shower over tub in another bathroom
- Heating & cooling: Forced air heating; Electric cooling
- Interior features: Thermal windows; Balcony/Loft; Eat-in kitchen and living/dining combo
- Laundry & utility: Laundry in basement; Inside basement entrance
Neighborhood map
What this means for you Summary
Snapshot
- This is a 3-bed/1.5-bath single-family listed at $200k.
Deal economics
- At list price, monthly cash flow is $47 ($563/yr) — positive.
- The deal already cash-flows at list — no discount required.
- To meet the 1% rule (rent ≥ 1% of price), the offer needs to be $181k (9.6% below list).
- Recommended offer: $181k (9.6% below list) — sets the bar for 1% rule.
- Cap rate 6.6% vs local median 5.0% in Independence — top-decile yield for the area; either an underpriced asset or a hidden risk that comps aren't pricing in. Stress-test before assuming the spread holds.
Location & tenants
- Location reads 82/100 on livability (#10 in MO, #1,296 nationally) — a professional / high-income tenant draw. Strengths: amenities A+, commute A+, cost of living A+; Watch: employment D+, crime F.
- Independence 30 (suburban): math 26% / reading 38% proficiency, ranked #252 of 324 in MO (top 78%) — families likely to look elsewhere, expect single-tenant / working-renter base with shorter leases.
- Zoned schools: Glendale Elem. (math 37% / reading 47%, grade F, #481 of 1,115 statewide, top 46%, 458 students, 69% FRL); Truman High (math 18% / reading 34%, grade F, #430 of 521 statewide, top 83%, 1,662 students, 52% FRL) — zoned schools at 60% FRL track the district average.
- Market conditions: Rents rising fast (+5.1%/yr); 200 active listings in the ZIP; 17 comparable units currently listed for rent nearby; rentals leasing fast (median 8d on market — plan ~1-2 weeks tenant-placement turnaround); 4,002 units permitted in Jackson County in 2024 (2,271 in 5+ unit buildings).
- This rent runs 35% of the median local income ($62k/yr) — at the standard rent-burdened threshold; future hikes will face affordability resistance.
Forward outlook
- Local home prices are declining (-3.0%/yr); year-one equity from $1k of loan paydown is wiped out by about $6k of value loss. Plan a longer hold.
- Jackson County population projected at +4% by 2050 — modest demand growth; plan on rents tracking national, not racing it.
Negotiation context
- Only 2 days on market — expect competitive offers; lowballing is unlikely to land.
Questions for the listing agent
- Built in 1972 — when were the roof, HVAC, electrical panel, plumbing, and water heater last replaced?
- Is there a deadline driving the sale (1031 exchange, divorce, estate, relocation)? That informs how much negotiation room exists.
- Crime grade is F in this area — have there been break-ins, vandalism, or insurance claims at this property in the last 3 years? What carrier currently insures it and at what premium?
- What's the average days-on-market for RENTAL listings here right now (not sales)? A rising rental-DOM trend means longer vacancies and softer asking-rent achievability than the comps imply.
- What's the recent tenant-quality profile in this submarket — average credit score on applications, eviction rate, late-payment / NSF rate, and stable-employment percentage? A property-management company in the area should have these aggregated.
- How much new for-sale + rental construction is in the pipeline within 1–3 miles? Heavy new supply typically softens prices + rents 12–24 months out; constrained supply supports both.
Investment metrics
- 1% rule
- 0.90% ✗
- Cap rate
- 6.57%
- Cash-on-cash
- 1.01%
- DSCR
- 1.04
- GRM
- 9.2
CMA / ARV
- ARV (median comp)
- $253,540
- List price
- $199,900
- Delta
- -21.16%
- Verdict
- UNDERPRICED
- Comps
- 20 within 1.0 mi
Show comp detail 12 sales within ~0.75 mi
| Address | Dist | Beds/Ba | Sqft | Sold | Price | $/sf | Match |
|---|---|---|---|---|---|---|---|
| 16001 E 30 St | 0.00mi | 3/2.5 | 1,732 (0%) | 0mo | $199,900 | $115 | 96 |
| 2724 S Woodbury Dr | 0.40mi | 3/2.0 | 1,717 (-1%) | 1mo | $425,000 | $248 | 77 |
| 3232 S Queen Ridge Dr | 0.34mi | 3/1.0 | 1,680 (-3%) | 5mo | $225,000 | $134 | 73 |
| 16409 E 31st St S | 0.28mi | 3/2.5 | 1,841 (+6%) | 1mo | $259,000 | $141 | 72 |
| 15805 E 27th St S | 0.41mi | 3/3.0 | 1,740 (+0%) | 5mo | $389,900 | $224 | 70 |
| 16828 E 31 St S | 0.59mi | 4/2.0 (+1) | 1,728 (-0%) | 1mo | $273,000 | $158 | 64 |
| 16405 E Gudgell Ct | 0.51mi | 4/3.0 (+1) | 1,779 (+3%) | 1mo | $260,000 | $146 | 60 |
| 1842 Drumm Ave | 0.60mi | 4/2.5 (+1) | 1,775 (+2%) | 0mo | $325,000 | $183 | 59 |
| 16809 E 29th St S | 0.52mi | 4/2.0 (+1) | 1,844 (+6%) | 6mo | $240,000 | $130 | 53 |
| 3507 S Haden Dr | 0.67mi | 3/2.0 | 1,604 (-7%) | 2mo | $230,000 | $143 | 52 |
| 16403 E Ellison Way | 0.26mi | 4/3.5 (+1) | 1,986 (+15%) | 2mo | $280,000 | $141 | 49 |
| 16812 E 35th St | 0.74mi | 3/2.0 | 1,947 (+12%) | 4mo | $260,000 | $134 | 39 |
Match score weights: distance 35% · size 25% · config 20% · recency 20%. Top-matched comps best support the ARV.
Projected returns pro-forma
-3.0% appreciation · 5.09% rent growth · sell at horizon
- IRR
- -12.4%
- Equity multiple
- 0.54×
- Total profit
- $-25,494
- Equity at exit
- $29,806
- IRR
- -0.4%
- Equity multiple
- 0.97×
- Total profit
- $-1,618
- Equity at exit
- $17,284
Cash invested: $55,972 (down + closing). Projections, not guarantees.
Landlord ↔ Tenant lean methodology
- Overall (STATE)
- 81 Strongly Landlord-Friendly
- State Missouri
- 81 Strongly Landlord-Friendly · R+10
- County
- — inherits STATE
- City
- — inherits STATE
ZIP-level market 64055
- Rents YoY
- 5.1%
- Active inventory
- 200
- Price-to-rent
- 9.2×
Monthly cashflow live
- Estimated rent
- $1,808 high interval (Pro) →
- Mortgage (P&I)
- −$1,048
- Tax from tax record
- −$250 /mo · $2,995/yr
- Insurance
- −$83
- HOA
- −$0
- Vacancy / Maint / Mgmt
- −$380
- Net cashflow
- $47
Break-even live
UW: 25.0% down · 7.5% · 30yr · 1.5% tax · 5.0% vac · 8.0% maint · 8.0% mgmt
Financing live
Cash to close
- Down payment
- $49,975
- Closing costs
- $5,997
- Reserves months
- —
- Total cash needed
- —
Loan-product check · same deal, 3 products live
Conventional
25% down · 7.5% · 30yr
- Down + closing
- —
- Monthly P&I
- —
- Monthly cashflow
- —
- DSCR
- —
- Eligible?
- —
Personal DTI + credit; lowest rate.
DSCR
20% down · 8.5% · 30yr
- Down + closing
- —
- Monthly P&I
- —
- Monthly cashflow
- —
- DSCR
- —
- Eligible?
- —
No personal income docs; deal must DSCR.
Hard money
10% down · 12.0% · 12mo
- Down + closing
- —
- Monthly P&I
- —
- Monthly cashflow
- —
- DSCR
- —
- Eligible?
- —
Short-term bridge; refi at stabilization.
Rent comps 17 comps
| Address | Beds | Baths | Sqft | Rent | $/sqft | DOM | Units | Dist |
|---|---|---|---|---|---|---|---|---|
| 2905 S Lee's Summit Rd Independence, MO | 1.0–3.0 | 1.0–2.0 | 853 | $1,746 | $2.05 | 1d | 48 | 0.02mi |
| 16421 E 29th Ter S Independence, MO | 3.0 | 2.0 | 1225 | $1,606 | $1.31 | 43d | 1 | 0.30mi |
| 16504 E 33rd St S Independence, MO | 4.0 | 2.0 | 1495 | $2,055 | $1.37 | 1d | 1 | 0.48mi |
| 16700 E 31st Ter S Independence, MO | 3.0 | 2.0 | 1639 | $2,150 | $1.31 | 19d | 1 | 0.49mi |
| 16816 E 31st St S Independence, MO | 3.0 | 2.5 | 1696 | $1,749 | $1.03 | 1d | 1 | 0.57mi |
| 16801 E Larkspur Ln Independence, MO | 1.0–3.0 | 1.0–2.0 | 1125 | $1,650 | $1.47 | 1d | 7 | 0.66mi |
| 16801 E Larkspur Ln Independence, MO | 1.0–3.0 | 1.0–2.0 | 1042 | $1,549 | $1.49 | 43d | 26 | 0.66mi |
| 1223 E 25th St S Independence, MO | 3.0 | 2.5 | 1982 | $1,856 | $0.94 | 7d | 1 | 0.70mi |
| 3605 S Stayton Ave Independence, MO | 3.0 | 2.0 | 1078 | $1,631 | $1.51 | 7d | 1 | 0.77mi |
| 3023 S Shrank Rd Independence, MO | 2.0 | 2.5 | 1800 | $1,662 | $0.92 | 1d | 1 | 0.78mi |
| 718 E Gudgell Ave Independence, MO | 4.0 | 2.0 | 1624 | $1,775 | $1.09 | 16d | 1 | 0.89mi |
| 3610 S Pope Ave Independence, MO | 3.0 | 2.0 | 1640 | $1,725 | $1.05 | 14d | 1 | 1.17mi |
| 14521 E 36th Pl S Independence, MO | 3.0 | 3.5 | 1984 | $2,195 | $1.11 | 2d | 1 | 1.18mi |
| 15001 E 39th Ter S Independence, MO | 3.0 | 2.0 | 1769 | $1,811 | $1.02 | 43d | 1 | 1.26mi |
| 14220 E 36th St S Independence, MO | 4.0 | 2.5 | 1540 | $1,826 | $1.19 | 7d | 1 | 1.29mi |
| 14405 E 37th St S Independence, MO | 3.0 | 1.0 | 1300 | $1,800 | $1.38 | 2d | 1 | 1.30mi |
| 14216 E 37th Ter S Independence, MO | 3.0 | 3.0 | 1800 | $2,100 | $1.17 | 7d | 1 | 1.42mi |
Listing history 4 events
-
2026-05-13status Pending 578-char remark
-
2026-05-11$199,900 Active 578-char remark
-
2026-05-07historical $199,900 578-char remark
-
2021-02-02soldstatus
ⓘ Source: listings_history table (triggers on properties + properties_extension) + one-shot
backfill from property_details.listing_events for pre-trigger history.
Tax reassessment forecast MO · Resets to sale price
- Current annual tax
- $2,995 · $250/mo
- Projected year-2 tax
- $2,995 · $250/mo
- Expected delta
- $0/yr ($0/mo · 0.0%)
ⓘ Screening estimate from a state-policy table — verify with the county assessor before closing.
Climate risk First Street
- Flood 1/10 Low FEMA zone X (unshaded) · 0% chance over 30 yrs
- Wildfire 1/10 Low
- Heat 4/10 Moderate 7 d/yr ≥108°F today · 17 d/yr by 30 yrs out
- Wind 2/10 Low
- Air quality 3/10 Moderate 3 unhealthy d/yr today · 3 by 30 yrs out
Nearby sold comps map
Loading sold comps map…
Walkable amenities ~0.75 mi
Loading nearby amenities…
Taxation est. · year 1
- Rental income
- $21,693
- − Mortgage interest
- −$11,198
- − Property taxes
- −$2,995
- − Insurance
- −$1,000
- − Repairs & maintenance
- −$1,735
- − Management
- −$1,735
- − Depreciation
- −$5,815
- Taxable loss
- −$2,785
- Est. tax savings @ 24.0%
- +$668
- After-tax cash flow
- $1,232/yr
For passive investors: Depreciation is non-cash, so a rental often shows a tax loss while cash-flowing — sheltering income. Rental losses are passive: they offset passive income freely, and up to $25,000/yr can offset ordinary (W-2) income if you actively participate and your MAGI is under $100k (phasing out to $0 by $150k); unused losses carry forward. On sale, claimed depreciation is recaptured at up to 25%, and gains may owe capital-gains tax (a 1031 exchange can defer both). Figures are a year-1 estimate at your 24.0% rate — not tax advice; consult a CPA.
Schools (NCES district)
- District
- Independence 30
- NCES district ID
- 2915480
- Math proficiency
- 26% ▼ -8.00%
- Reading proficiency
- 38% ▼ -5.00%
- Median HH income
- $41,843
- Composite
- 27.04/100
- National rank
- #7054
- State rank
- #252 of 324 in MO
Livability — Independence
- Score
- 82/100
- State rank
- #10
- US rank
- #1296
Category grades
Schools grade is shown separately in the Schools card above.
Census & demographics
- Census place
- Independence, MO
- County
- Jackson County · 687,798 people
- City population
- 117,675
- Metro
- Kansas City, MO-KS
- Population (ZIP)
- 35,960
- Household income
- $62,439
- Rent vs Own
- Severe rent burden
- 1404.0
Population outlook (Jackson County) Hauer SSP2
- Today (2025)
- 719,589 people
- By 2030
- 731,456 · +1.6%
- By 2040
- 746,689 · +3.8%
- By 2050
- 749,289 · +4.1%
- By 2075
- 736,227 · +2.3%
- By 2100
- 668,210 · -7.1%
Race, ethnicity, and origin ACS 2023
- Neighborhood character
- Predominantly White (71%)
- Race & ethnicity
- White 71% Black 13% Hispanic / Latino 10% Two or more races 8% Asian 1%
- Hispanic origin (detail)
- Mexican 7% Puerto Rican 2%
- Common ancestry
- Italian 9% Lithuanian 2% Slovak 2%
- Foreign-born
- 4% · Canada
- Languages at home
- 94% English-only · Spanish 4%
Political lean MEDSL · Jackson
- 2024 margin
- D (+19.3) · D 58.9% · R 39.5% · Other 1.6%
- 2008→2024 swing
- -6.1pp toward R · 2008: 25.4pp · 2024: 19.3pp
- All cycles
- 2024: D+19.3 2020: D+22.0 2016: D+16.6 2012: D+19.0 2008: D+25.4
Not yet ingested
- Civics
- —
Market trends
- HPI YoY
- ▼ -180.54%
- Current HPI
- 245.3636
- Rent YoY
- ▲ 5.09%
- Metro
- Kansas City, MO-KS
- State GDP YoY
- ▲ 1.84%
- F500 in state
- 20
Industry mix (Fortune 500 HQ in MO)
| Industry | F500 HQs | Revenue |
|---|---|---|
| Healthcare | 1 | $163B |
|
||
| Insurance | 1 | $21B |
|
||
| Industrial Technology | 1 | $17B |
|
||
| Retail | 1 | $16B |
|
||
| Industrial Distribution | 1 | $10B |
|
||
| Utilities | 1 | $9B |
|
||
Price history
+0.0% since first listed5 events — show timeline
- 2026-06-15 Sold (MLS) — Heartland MLS as Distributed by MLS Grid
- 2026-05-13 Pending — Heartland MLS as Distributed by MLS Grid
- 2026-05-11 Listed $199,900 Heartland MLS as Distributed by MLS Grid
- 2026-05-07 Coming Soon $199,900 Heartland MLS as Distributed by MLS Grid
- 2021-02-02 Sold (Public Records) — Public Records
Property tax history
+3.8%/yrLatest (2025): $2,995 · +18.6% YoY. Source: county tax records.
Cash-flow waterfall
monthlySold comps — $/sqft
last 12 mo · ≤1 miLoading sold comps…