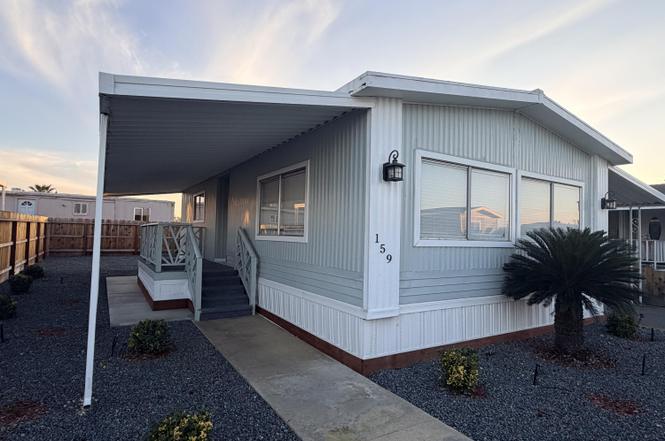
720 E Worth Ave #159 · Porterville, CA
Flood risk 1/10 · Minimal
- FEMA flood zone
- X (unshaded)
- Chance of flooding over 30 yrs
- 0.0%
- Est. flood insurance / yr
- $507 – $1,088
Fire risk 9/10 · Severe
- Est. fire insurance / yr
- $659 – $1,223
Heat risk 8/10 · Major
- Hot days now (above 105°F)
- 7 days/yr
- Hot days in 30 yrs
- 19 days/yr
Wind risk 1/10 · Minimal
- Chance of severe wind over 30 yrs
- —
Air-quality risk 10/10 · Severe
- Unhealthy air days now
- 38 days/yr
- Unhealthy air days in 30 yrs
- 42 days/yr
Risk factors via First Street. Map © Google.
Why this score? — see what drove the B- grade
The composite is a weighted blend of 9 inputs, each scored 0–100. Each bar is that input's sub-score; the figure is the points it added to the 100-point composite (weight × sub-score).
- Cash flow +30.0/30.0
- 1% rule +10.0/10.0
- DSCR +10.0/10.0
- ARV discount +7.5/15.0
- Rent growth +3.5/5.0
- Livability +3.0/5.0
- Schools +2.8/10.0
- Condition / age +2.5/5.0
- Appreciation +0.0/10.0
$54,000
🖨 Deal sheet (PDF) 📄 Offer letter ✓ Due diligence
Listing remarks
You're going to love this newly remodeled 2 bedroom 1 bathroom mobile home in Golden Hills Mobile Estates Park! This home is complete with new carpet in the bedrooms, new counter tops and sinks, new luxury plank flooring throughout, new cabinets, and new kitchen appliances! The floor plan is designed for comfortable living in the living room area and convenient access to the kitchen. Make your appointment today to view this home!
Key facts
- New counter tops
- New carpet
- New sinks
Tags
Neighborhood map
What this means for you Summary
Snapshot
- This is a 2-bed/1.0-bath land listed at $54k.
Deal economics
- At list price, monthly cash flow is $553 ($7k/yr) — positive.
- The deal already cash-flows at list — no discount required.
- Meets the 1% rule at list price ($1k rent vs $54k).
- Recommended offer: $51k (6.0% below list) — sets the bar for market timing.
- Cap rate 18.6% vs local median 2.7% in Porterville — top-decile yield for the area; either an underpriced asset or a hidden risk that comps aren't pricing in. Stress-test before assuming the spread holds.
Location & tenants
- Location reads 60/100 on livability (#561 in CA) — a middle-class / working-renter tenant base. Strengths: housing A, commute A-; Watch: crime C-, cost of living D+, amenities F.
- Porterville Unified (urban): math 18% / reading 50% proficiency, ranked #302 of 517 in CA (top 58%) — families likely to look elsewhere, expect single-tenant / working-renter base with shorter leases; 84% free/reduced lunch — lower-income household profile, screen leases tightly.
- Zoned schools: Vandalia Elementary (577 students, 90% FRL); Pioneer Middle (736 students, 94% FRL); Granite Hills High (math 19% / reading 48%, grade F, #656 of 1,170 statewide, top 57%, 1,242 students, 92% FRL).
- Market conditions: Rents rising fast (+4.1%/yr); 328 active listings in the ZIP; 2 comparable units currently listed for rent nearby; 1,447 units permitted in Tulare County in 2024 (307 in 5+ unit buildings).
Forward outlook
- Local home prices are declining (-3.0%/yr); year-one equity from $373 of loan paydown is wiped out by about $2k of value loss. Plan a longer hold.
- Tulare County population projected at +10% by 2050 — modest demand growth; plan on rents tracking national, not racing it.
- At projected returns (-3.0% appreciation + 4.1% rent growth), your $15k cash investment doubles in ~3 years — after that, you're playing with house money.
Negotiation context
- It's been on market 77 days — a 6% lower offer ($51k) is reasonable based on typical stale-listing flexibility.
- 3 sale attempts since 2y ago; this cycle's ask has dropped $5k (8%) from the opening price — seller is motivated, your offer sets the floor, not the list.
Risks & watch-outs
- Climate carrying-cost: severe wildfire risk; extreme-heat days projected 7→19/yr by 2055 (HVAC capex compounding) — expect insurance premiums to compound above CPI over the hold.
Questions for the listing agent
- It's been on market 77 days. Have you received any prior offers? Is the seller open to a 6% concession, seller financing, or rate buy-down credit?
- Built in 1975 — when were the roof, HVAC, electrical panel, plumbing, and water heater last replaced?
- Why hasn't it sold? Are there any deal-killer items the seller is aware of (foundation, flood, title, zoning, code violations)?
- Is there a deadline driving the sale (1031 exchange, divorce, estate, relocation)? That informs how much negotiation room exists.
- Schools are F-rated, which usually means shorter tenancies and higher turnover. Who's the typical renter profile here, and what's been the actual vacancy rate?
- What's the average days-on-market for RENTAL listings here right now (not sales)? A rising rental-DOM trend means longer vacancies and softer asking-rent achievability than the comps imply.
- What's the recent tenant-quality profile in this submarket — average credit score on applications, eviction rate, late-payment / NSF rate, and stable-employment percentage? A property-management company in the area should have these aggregated.
- How much new for-sale + rental construction is in the pipeline within 1–3 miles? Heavy new supply typically softens prices + rents 12–24 months out; constrained supply supports both.
Investment metrics
- 1% rule
- 2.17% ✓
- Cap rate
- 18.59%
- Cash-on-cash
- 43.90%
- DSCR
- 2.95
- GRM
- 3.8
CMA / ARV
No comps found within radius.
Projected returns pro-forma
-3.0% appreciation · 4.07% rent growth · sell at horizon
- IRR
- 42.1%
- Equity multiple
- 2.84×
- Total profit
- $27,776
- Equity at exit
- $8,052
- IRR
- 48.7%
- Equity multiple
- 5.96×
- Total profit
- $74,977
- Equity at exit
- $4,669
Cash invested: $15,120 (down + closing). Projections, not guarantees.
Landlord ↔ Tenant lean methodology
- Overall (STATE)
- 18 Strongly Tenant-Friendly
- State California
- 18 Strongly Tenant-Friendly · D+13
- County
- — inherits STATE
- City
- — inherits STATE
ZIP-level market 93257
- Rents YoY
- 4.1%
- Active inventory
- 328
- Price-to-rent
- 3.8×
Monthly cashflow live
- Estimated rent
- $1,173 medium interval (Pro) →
- Mortgage (P&I)
- −$283
- Tax est. 1.5%
- −$68 /mo · $810/yr
- Insurance
- −$22
- HOA
- −$0
- Lot rent
- −$0
- Vacancy / Maint / Mgmt
- −$246
- Net cashflow
- $553
Break-even live
Sensitivity live
| Price | -10% $591 | -5% $572 | +0% $553 | +5% $535 | +10% $516 |
|---|---|---|---|---|---|
| Rent | -10% $461 | -5% $507 | +0% $553 | +5% $600 | +10% $646 |
| Rate | -1.0pp $580 | -0.5pp $567 | base $553 | +0.5pp $539 | +1.0pp $525 |
UW: 25.0% down · 7.5% · 30yr · 1.5% tax · 5.0% vac · 8.0% maint · 8.0% mgmt
Financing live
Cash to close
- Down payment
- $13,500
- Closing costs
- $1,620
- Reserves months
- —
- Total cash needed
- —
Loan-product check · same deal, 3 products live
Conventional
25% down · 7.5% · 30yr
- Down + closing
- —
- Monthly P&I
- —
- Monthly cashflow
- —
- DSCR
- —
- Eligible?
- —
Personal DTI + credit; lowest rate.
DSCR
20% down · 8.5% · 30yr
- Down + closing
- —
- Monthly P&I
- —
- Monthly cashflow
- —
- DSCR
- —
- Eligible?
- —
No personal income docs; deal must DSCR.
Hard money
10% down · 12.0% · 12mo
- Down + closing
- —
- Monthly P&I
- —
- Monthly cashflow
- —
- DSCR
- —
- Eligible?
- —
Short-term bridge; refi at stabilization.
Rent comps 2 comps
| Address | Beds | Baths | Sqft | Rent | $/sqft | DOM | Units | Dist |
|---|---|---|---|---|---|---|---|---|
| 715 E River Ave Unit B Porterville, CA | 2.0 | 1.0 | 725 | $1,100 | $1.52 | 46d | 1 | 0.82mi |
| 195 E Mountain View Ave Porterville, CA | 2.0 | 1.0 | 1075 | $1,200 | $1.12 | 23d | 1 | 0.86mi |
Listing history 6 events
-
2026-04-16status Pending
-
2026-03-26price $54,000
-
2026-01-29$59,000 Active
-
2024-09-10$64,500 Active
-
2024-08-13price $69,900
-
2024-04-05$73,900 Active
ⓘ Source: listings_history table (triggers on properties + properties_extension) + one-shot
backfill from property_details.listing_events for pre-trigger history.
Climate risk First Street
- Flood 1/10 Low FEMA zone X (unshaded) · 0% chance over 30 yrs
- Wildfire 9/10 Extreme
- Heat 8/10 Severe 7 d/yr ≥105°F today · 19 d/yr by 30 yrs out
- Wind 1/10 Low
- Air quality 10/10 Extreme 38 unhealthy d/yr today · 42 by 30 yrs out
Nearby sold comps map
Loading sold comps map…
Walkable amenities ~0.75 mi
Loading nearby amenities…
Taxation est. · year 1
- Rental income
- $14,071
- − Mortgage interest
- −$3,025
- − Property taxes
- −$810
- − Insurance
- −$270
- − Repairs & maintenance
- −$1,126
- − Management
- −$1,126
- − Depreciation
- −$1,571
- Taxable income
- $6,144
- Est. tax owed @ 24.0%
- −$1,475
- After-tax cash flow
- $5,164/yr
For passive investors: Depreciation is non-cash, so a rental often shows a tax loss while cash-flowing — sheltering income. Rental losses are passive: they offset passive income freely, and up to $25,000/yr can offset ordinary (W-2) income if you actively participate and your MAGI is under $100k (phasing out to $0 by $150k); unused losses carry forward. On sale, claimed depreciation is recaptured at up to 25%, and gains may owe capital-gains tax (a 1031 exchange can defer both). Figures are a year-1 estimate at your 24.0% rate — not tax advice; consult a CPA.
Schools (NCES district)
- District
- Porterville Unified
- NCES district ID
- 0600064
- Math proficiency
- 18% ▼ -10.00%
- Reading proficiency
- 50% ▲ 6.00%
- Median HH income
- $35,157
- Composite
- 27.97/100
- National rank
- #6855
- State rank
- #302 of 517 in CA
Livability — Porterville
- Score
- 60/100
- State rank
- #561
- US rank
- #18537
Category grades
Schools grade is shown separately in the Schools card above.
Census & demographics
- County
- Tulare County · 323,826 people
- City population
- 80,467
- Metro
- Visalia, CA
- Population (ZIP)
- 80,467
- Household income
- $59,704
- Rent vs Own
- Severe rent burden
- 3028.0
Population outlook (Tulare County) Hauer SSP2
- Today (2025)
- 484,681 people
- By 2030
- 496,241 · +2.4%
- By 2040
- 518,507 · +7.0%
- By 2050
- 534,920 · +10.4%
- By 2075
- 548,417 · +13.2%
- By 2100
- 513,085 · +5.9%
Race, ethnicity, and origin ACS 2023
- Neighborhood character
- Predominantly Hispanic (72%)
- Race & ethnicity
- Hispanic / Latino 72% Two or more races 23% White 21% Native American 3% Asian 2%
- Hispanic origin (detail)
- Mexican 69%
- Common ancestry
- Iranian 1%
- Foreign-born
- 26% · Canada
- Languages at home
- 45% English-only · Spanish 52% Tagalog/Filipino 1% Arabic 1%
Political lean MEDSL · Tulare
- 2024 margin
- Strong R (+20.7) · D 38.5% · R 59.2% · Other 2.3%
- 2008→2024 swing
- -5.4pp toward R · 2008: -15.3pp · 2024: -20.7pp
- All cycles
- 2024: R+20.7 2020: R+7.8 2016: R+12.1 2012: R+17.8 2008: R+15.3
Not yet ingested
- Civics
- —
Market trends
- HPI YoY
- ▼ -375.52%
- Current HPI
- 362.656
- Rent YoY
- ▲ 4.07%
- Metro
- Visalia, CA
- State GDP YoY
- ▲ 3.21%
- F500 in state
- 116
Industry mix (Fortune 500 HQ in CA)
| Industry | F500 HQs | Revenue |
|---|---|---|
| Technology | 27 | $1,492B |
|
||
| Financial Services | 3 | $174B |
|
||
| Retail | 3 | $44B |
|
||
| Insurance | 3 | $26B |
|
||
| Media / Entertainment | 2 | $115B |
|
||
| Pharmaceuticals / Biotech | 2 | $62B |
|
||
Price history
-26.9% since first listed6 events — show timeline
- 2026-04-16 Pending — TCMLS
- 2026-03-26 Price Changed $54,000 TCMLS
- 2026-01-29 Listed $59,000 TCMLS
- 2024-09-10 Listed $64,500 GEMLS
- 2024-08-13 Price Changed $69,900 TCMLS
- 2024-04-05 Listed $73,900 TCMLS
Property tax history
-1.6%/yrLatest (2019): $67 · -3.2% YoY. Source: county tax records.
Cash-flow waterfall
monthlySold comps — $/sqft
last 12 mo · ≤1 miLoading sold comps…