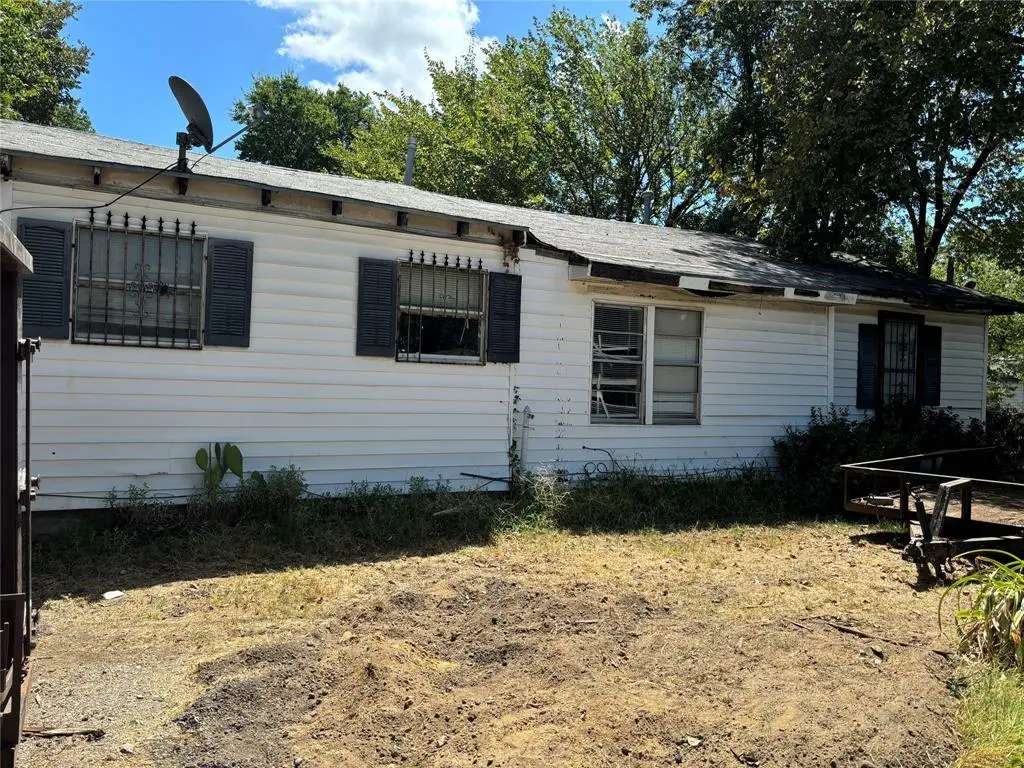
918 Local Vista Dr · Dallas, TX
Flood risk 1/10 · Minimal
- FEMA flood zone
- X (unshaded)
- Chance of flooding over 30 yrs
- 0.0%
- Est. flood insurance / yr
- $507 – $1,088
Fire risk 4/10 · Minor
- Est. fire insurance / yr
- $1,222 – $2,270
Heat risk 7/10 · Major
- Hot days now (above 110°F)
- 7 days/yr
- Hot days in 30 yrs
- 24 days/yr
Wind risk 6/10 · Moderate
- Chance of severe wind over 30 yrs
- 27.0%
Air-quality risk 2/10 · Minimal
- Unhealthy air days now
- 1 days/yr
- Unhealthy air days in 30 yrs
- 2 days/yr
Risk factors via First Street. Map © Google.
Why this score? — see what drove the B grade
The composite is a weighted blend of 9 inputs, each scored 0–100. Each bar is that input's sub-score; the figure is the points it added to the 100-point composite (weight × sub-score).
- Cash flow +27.6/30.0
- ARV discount +15.0/15.0
- 1% rule +9.8/10.0
- DSCR +9.7/10.0
- Livability +4.0/5.0
- Rent growth +2.8/5.0
- Schools +2.8/10.0
- Condition / age +2.5/5.0
- Appreciation +0.0/10.0
$130,000
🖨 Deal sheet (PDF) 📄 Offer letter ✓ Due diligence
Listing remarks
Calling all investors and Flippers 6 bed 2 bath! Tax rolls reflect a smaller Square footage. If your buyer is looking for a fix and flip, remodel to rent, or an affordable home for you and your family, look no further you have found the perfect property. Needs a full rehab. Huge back yard with an estimated Lot Sq Ft of 10,559 with plenty of outdoor space for gardening, entertaining, or future expansion. Utilities are off.
Key facts
- Future expansion
- Full rehab
- Huge back yard
Tags
Property features AI
Finance
- Other: Property located in Dallas County, TX; Subdivision: Prairie Creek Kissells Heights
- Financial info: Listing terms: Cash or Other; Treat as clear loan type; No second mortgage indicated
- HOA & community: No association
Exterior
- Parking: Driveway
- Utilities: City water; Not in a municipal utility district
- Home design: Single family residence; Residential property; Built in 1951; Not attached to another property
- Construction: Year built 1951
- Exterior features: Lot under 0.5 acre
Interior
- Kitchen: Includes appliances (listed as Other)
- Bedrooms: 6 bedrooms (all on main level)
- Bathrooms: 2 full bathrooms
- Interior features: Open floorplan; One level; 10 total rooms; 1 living area; 1 dining area
- Laundry & utility: No specific laundry details provided
Neighborhood map
What this means for you Summary
Snapshot
- This is a 3-bed/1.0-bath single-family listed at $130k.
Deal economics
- At list price, monthly cash flow is $388 ($5k/yr) — positive.
- The deal already cash-flows at list — no discount required.
- Meets the 1% rule at list price ($2k rent vs $130k).
- Recommended offer: $122k (6.0% below list) — sets the bar for market timing.
- Cap rate 9.9% vs local median 2.3% in Dallas — top-decile yield for the area; either an underpriced asset or a hidden risk that comps aren't pricing in. Stress-test before assuming the spread holds.
Location & tenants
- Location reads 81/100 on livability (#24 in TX, #1,380 nationally) — a professional / high-income tenant draw. Strengths: amenities A+, commute A+, housing A+; Watch: crime F.
- Dallas ISD (urban): math 31% / reading 36% proficiency, ranked #559 of 826 in TX (top 68%) — families likely to look elsewhere, expect single-tenant / working-renter base with shorter leases; 83% free/reduced lunch — lower-income household profile, screen leases tightly.
- Zoned schools: Nancy Moseley El (math 38% / reading 45%, grade F, #1,437 of 4,322 statewide, top 34%, 618 students, 96% FRL); Young Women'S Steam Academy At Balch Springs Middl (math 31% / reading 34%, grade F, #947 of 1,662 statewide, top 58%, 869 students, 91% FRL); H Grady Spruce H S (math 21% / reading 18%, grade F, #1,424 of 1,632 statewide, top 88%, 1,558 students, 96% FRL).
- Market conditions: Rents rising (+1.0%/yr); 206 active listings in the ZIP; 5 comparable units currently listed for rent nearby; rentals at typical pace (median 15d on market — plan ~3-4 weeks tenant-placement turnaround); 12,577 units permitted in Dallas County in 2024 (6,829 in 5+ unit buildings).
- This rent runs 41% of the median local income ($56k/yr) — at the standard rent-burdened threshold; future hikes will face affordability resistance.
Forward outlook
- Local home prices are declining (-3.0%/yr); year-one equity from $899 of loan paydown is wiped out by about $4k of value loss. Plan a longer hold.
- Dallas County population projected at +35% by 2050 — long-run rental-demand tailwind backs the buy-and-hold thesis.
Negotiation context
- It's been on market 65 days — a 6% lower offer ($122k) is reasonable based on typical stale-listing flexibility.
- 2 sale attempts with the ask held roughly flat each time — persistent listings suggest the price (not the market) is what's stuck; bring a comps-based counter.
Risks & watch-outs
- Watch-outs: property tax is 3.6% of price; built in 1951 — expect roof / HVAC / electrical / plumbing capex.
- Climate carrying-cost: major wind risk, 27% chance of damaging wind over 30y; extreme-heat days projected 7→24/yr by 2055 (HVAC capex compounding) — expect insurance premiums to compound above CPI over the hold.
Questions for the listing agent
- It's been on market 65 days. Have you received any prior offers? Is the seller open to a 6% concession, seller financing, or rate buy-down credit?
- Built in 1951 — when were the roof, HVAC, electrical panel, plumbing, and water heater last replaced?
- Property tax is high relative to price — has the assessment been appealed recently, and will the sale trigger a re-assessment?
- Why hasn't it sold? Are there any deal-killer items the seller is aware of (foundation, flood, title, zoning, code violations)?
- Is there a deadline driving the sale (1031 exchange, divorce, estate, relocation)? That informs how much negotiation room exists.
- Crime grade is F in this area — have there been break-ins, vandalism, or insurance claims at this property in the last 3 years? What carrier currently insures it and at what premium?
- What's the average days-on-market for RENTAL listings here right now (not sales)? A rising rental-DOM trend means longer vacancies and softer asking-rent achievability than the comps imply.
- What's the recent tenant-quality profile in this submarket — average credit score on applications, eviction rate, late-payment / NSF rate, and stable-employment percentage? A property-management company in the area should have these aggregated.
- How much new for-sale + rental construction is in the pipeline within 1–3 miles? Heavy new supply typically softens prices + rents 12–24 months out; constrained supply supports both.
Investment metrics
- 1% rule
- 1.48% ✓
- Cap rate
- 9.87%
- Cash-on-cash
- 12.79%
- DSCR
- 1.57
- GRM
- 5.6
CMA / ARV
- ARV (on-the-fly)
- $240,240
- Comps found
- 10
Show comp detail 10 sales within ~0.75 mi
| Address | Dist | Beds/Ba | Sqft | Sold | Price | $/sf | Match |
|---|---|---|---|---|---|---|---|
| 1041 Bradfield Rd | 0.15mi | 3/1.0 | 1,298 (+5%) | 4mo | $225,000 | $173 | 81 |
| 8430 Midland Ln | 0.25mi | 4/2.0 (+1) | 1,270 (+3%) | 20mo | $244,900 | $193 | 58 |
| 8626 Oak Haven Ln | 0.07mi | 3/2.0 | 1,090 (-12%) | 22mo | $257,990 | $237 | 55 |
| 8916 Catalonia Dr | 0.47mi | 3/2.0 | 1,408 (+14%) | 2mo | $264,900 | $188 | 48 |
| 1230 Cabot Dr | 0.48mi | 3/2.0 | 1,152 (-6%) | 18mo | $250,000 | $217 | 48 |
| 9046 Dorinda Cir | 0.53mi | 4/2.0 (+1) | 1,344 (+9%) | 5mo | $260,000 | $193 | 47 |
| 1236 Cabot Dr | 0.48mi | 3/2.0 | 1,308 (+6%) | 20mo | $274,500 | $210 | 47 |
| 911 Murdock Rd | 0.75mi | 3/2.0 | 1,080 (-12%) | 12mo | $254,999 | $236 | 31 |
| 8341 Lake Anna Dr | 0.54mi | 4/2.0 (+1) | 1,390 (+13%) | 22mo | $255,000 | $183 | 26 |
| 9426 Beacon Hill Cir | 0.74mi | 4/2.0 (+1) | 1,360 (+10%) | 21mo | $265,000 | $195 | 22 |
Match score weights: distance 35% · size 25% · config 20% · recency 20%. Top-matched comps best support the ARV.
Projected returns pro-forma
-3.0% appreciation · 1.02% rent growth · sell at horizon
- IRR
- 0.0%
- Equity multiple
- 1.00×
- Total profit
- $55
- Equity at exit
- $19,383
- IRR
- 7.2%
- Equity multiple
- 1.49×
- Total profit
- $17,754
- Equity at exit
- $11,240
Cash invested: $36,400 (down + closing). Projections, not guarantees.
Landlord ↔ Tenant lean methodology
- Overall (STATE)
- 87 Strongly Landlord-Friendly
- State Texas
- 87 Strongly Landlord-Friendly · R+5
- County
- — inherits STATE
- City
- — inherits STATE
ZIP-level market 75217
- Home prices YoY
- -4.3%
- Rents YoY
- 1.0%
- Active inventory
- 206
- Price-to-rent
- 5.6×
Monthly cashflow live
- Estimated rent
- $1,920 high interval (Pro) →
- Mortgage (P&I)
- −$682
- Tax from tax record
- −$393 /mo · $4,720/yr
- Insurance
- −$54
- HOA
- −$0
- Vacancy / Maint / Mgmt
- −$403
- Net cashflow
- $388
Break-even live
Sensitivity live
| Price | -10% $461 | -5% $425 | +0% $388 | +5% $351 | +10% $314 |
|---|---|---|---|---|---|
| Rent | -10% $236 | -5% $312 | +0% $388 | +5% $464 | +10% $540 |
| Rate | -1.0pp $453 | -0.5pp $421 | base $388 | +0.5pp $354 | +1.0pp $320 |
UW: 25.0% down · 7.5% · 30yr · 1.5% tax · 5.0% vac · 8.0% maint · 8.0% mgmt
Financing live
Cash to close
- Down payment
- $32,500
- Closing costs
- $3,900
- Reserves months
- —
- Total cash needed
- —
Loan-product check · same deal, 3 products live
Conventional
25% down · 7.5% · 30yr
- Down + closing
- —
- Monthly P&I
- —
- Monthly cashflow
- —
- DSCR
- —
- Eligible?
- —
Personal DTI + credit; lowest rate.
DSCR
20% down · 8.5% · 30yr
- Down + closing
- —
- Monthly P&I
- —
- Monthly cashflow
- —
- DSCR
- —
- Eligible?
- —
No personal income docs; deal must DSCR.
Hard money
10% down · 12.0% · 12mo
- Down + closing
- —
- Monthly P&I
- —
- Monthly cashflow
- —
- DSCR
- —
- Eligible?
- —
Short-term bridge; refi at stabilization.
Rent comps 5 comps
| Address | Beds | Baths | Sqft | Rent | $/sqft | DOM | Units | Dist |
|---|---|---|---|---|---|---|---|---|
| 442 S Saint Augustine Dr Dallas, TX | 3.0 | 1.0–2.0 | 703 | $1,800 | $2.56 | 24d | 1 | 1.06mi |
| 7911 Komalty Dr Dallas, TX | 4.0 | 2.0 | 1454 | $2,000 | $1.38 | 46d | 1 | 1.16mi |
| 9720 Brierwyck Dr Dallas, TX | 3.0 | 2.0 | 1229 | $1,986 | $1.62 | 8d | 1 | 1.20mi |
| 250 Prairie Grove Dr Dallas, TX | 3.0 | 2.0 | 1164 | $1,770 | $1.52 | 15d | 1 | 1.38mi |
| 9605 Grady Ln Dallas, TX | 3.0 | 2.0 | 950 | $800 | $0.84 | 0d | 1 | 1.38mi |
Listing history 9 events
-
2026-05-21status Pending
-
2026-04-29historical Active Option Contract
-
2026-03-17$130,000 Active
-
2025-09-27price $135,000
-
2025-09-08price $145,000
-
2025-08-18$155,000 Active
-
2004-01-16soldstatus
-
1998-12-15soldstatus
-
1998-10-26soldstatus
ⓘ Source: listings_history table (triggers on properties + properties_extension) + one-shot
backfill from property_details.listing_events for pre-trigger history.
Tax reassessment forecast TX · Resets to sale price
- Current annual tax
- $4,720 · $393/mo
- Projected year-2 tax
- $4,720 · $393/mo
- Expected delta
- $0/yr ($0/mo · 0.0%)
ⓘ Screening estimate from a state-policy table — verify with the county assessor before closing.
Climate risk First Street
- Flood 1/10 Low FEMA zone X (unshaded) · 0% chance over 30 yrs
- Wildfire 4/10 Moderate
- Heat 7/10 Severe 7 d/yr ≥110°F today · 24 d/yr by 30 yrs out
- Wind 6/10 Major 27% chance of damaging wind over 30 yrs
- Air quality 2/10 Low 1 unhealthy d/yr today · 2 by 30 yrs out
Nearby sold comps map
Loading sold comps map…
Walkable amenities ~0.75 mi
Loading nearby amenities…
Taxation est. · year 1
- Rental income
- $23,045
- − Mortgage interest
- −$7,282
- − Property taxes
- −$4,720
- − Insurance
- −$650
- − Repairs & maintenance
- −$1,844
- − Management
- −$1,844
- − Depreciation
- −$3,782
- Taxable income
- $2,923
- Est. tax owed @ 24.0%
- −$702
- After-tax cash flow
- $3,952/yr
For passive investors: Depreciation is non-cash, so a rental often shows a tax loss while cash-flowing — sheltering income. Rental losses are passive: they offset passive income freely, and up to $25,000/yr can offset ordinary (W-2) income if you actively participate and your MAGI is under $100k (phasing out to $0 by $150k); unused losses carry forward. On sale, claimed depreciation is recaptured at up to 25%, and gains may owe capital-gains tax (a 1031 exchange can defer both). Figures are a year-1 estimate at your 24.0% rate — not tax advice; consult a CPA.
Schools (NCES district)
- District
- Dallas ISD
- NCES district ID
- 4816230
- Math proficiency
- 31% ▼ -16.00%
- Reading proficiency
- 36% ▼ -4.00%
- Median HH income
- $42,881
- Composite
- 28.41/100
- National rank
- #6763
- State rank
- #559 of 826 in TX
Livability — Dallas
- Score
- 81/100
- State rank
- #24
- US rank
- #1380
Category grades
Schools grade is shown separately in the Schools card above.
Census & demographics
- Census place
- Dallas, TX
- County
- Dallas County · 2,612,404 people
- City population
- 1,168,437
- Metro
- Dallas-Fort Worth-Arlington, TX
- Population (ZIP)
- 85,028
- Household income
- $55,723
- Rent vs Own
- Severe rent burden
- 2649.0
Population outlook (Dallas County) Hauer SSP2
- Today (2025)
- 2,979,839 people
- By 2030
- 3,191,823 · +7.1%
- By 2040
- 3,619,611 · +21.5%
- By 2050
- 4,026,915 · +35.1%
- By 2075
- 4,957,073 · +66.4%
- By 2100
- 5,508,725 · +84.9%
Race, ethnicity, and origin ACS 2023
- Neighborhood character
- Predominantly Hispanic (73%)
- Race & ethnicity
- Hispanic / Latino 73% Two or more races 34% Black 20% White 6%
- Hispanic origin (detail)
- Mexican 68%
- Foreign-born
- 30% · Canada, Philippines
- Languages at home
- 34% English-only · Spanish 65% Other Asian/Pacific 1%
Political lean MEDSL · Dallas
- 2024 margin
- Strong D (+22.2) · D 60.2% · R 38.0% · Other 1.8%
- 2008→2024 swing
- +6.9pp toward D · 2008: 15.3pp · 2024: 22.2pp
- All cycles
- 2024: D+22.2 2020: D+31.6 2016: D+26.2 2012: D+15.4 2008: D+15.3
Not yet ingested
- Civics
- —
Market trends
- HPI YoY
- ▼ -17.04%
- Current HPI
- 382.5527
- Rent YoY
- ▲ 1.02%
- Metro
- Dallas-Fort Worth-Arlington, TX
- State GDP YoY
- ▲ 3.95%
- F500 in state
- 110
Industry mix (Fortune 500 HQ in TX)
| Industry | F500 HQs | Revenue |
|---|---|---|
| Energy | 16 | $1,198B |
|
||
| Technology | 5 | $198B |
|
||
| Engineering / Construction | 4 | $72B |
|
||
| Energy Services | 3 | $60B |
|
||
| Utilities | 3 | $41B |
|
||
| Healthcare | 2 | $330B |
|
||
Price history
-16.1% since first listed9 events — show timeline
- 2026-05-21 Pending — NTREIS
- 2026-04-29 Contingent — NTREIS
- 2026-03-17 Listed $130,000 NTREIS
- 2025-09-27 Price Changed $135,000 NTREIS
- 2025-09-08 Price Changed $145,000 NTREIS
- 2025-08-18 Listed $155,000 NTREIS
- 2004-01-16 Sold (Public Records) — Public Records
- 1998-12-15 Sold (Public Records) — Public Records
- 1998-10-26 Sold (Public Records) — Public Records
Property tax history
+11.8%/yrLatest (2025): $4,720 · -0.4% YoY. Source: county tax records.
Cash-flow waterfall
monthlySold comps — $/sqft
last 12 mo · ≤1 miLoading sold comps…