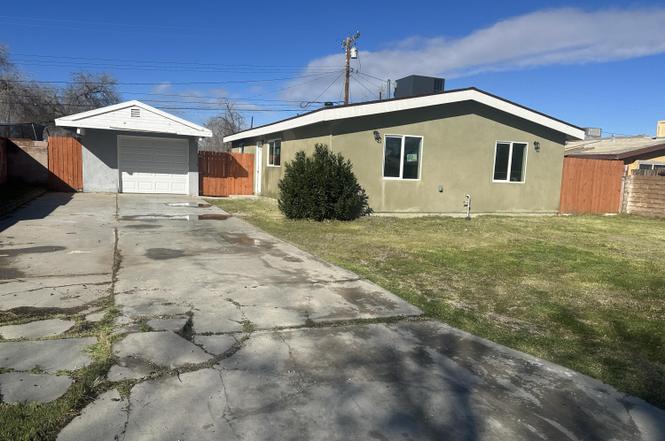
44655 E 4th St · Lancaster, CA
Flood risk 1/10 · Minimal
- FEMA flood zone
- X (unshaded)
- Chance of flooding over 30 yrs
- 0.0%
- Est. flood insurance / yr
- $507 – $1,088
Fire risk 1/10 · Minimal
- Est. fire insurance / yr
- $659 – $1,223
Heat risk 7/10 · Major
- Hot days now (above 101°F)
- 7 days/yr
- Hot days in 30 yrs
- 17 days/yr
Wind risk 1/10 · Minimal
- Chance of severe wind over 30 yrs
- —
Air-quality risk 8/10 · Major
- Unhealthy air days now
- 16 days/yr
- Unhealthy air days in 30 yrs
- 21 days/yr
Risk factors via First Street. Map © Google.
Why this score? — see what drove the D- grade
The composite is a weighted blend of 9 inputs, each scored 0–100. Each bar is that input's sub-score; the figure is the points it added to the 100-point composite (weight × sub-score).
- Cash flow +13.5/30.0
- ARV discount +6.6/15.0
- DSCR +4.1/10.0
- Livability +3.4/5.0
- 1% rule +2.9/10.0
- Rent growth +2.5/5.0
- Schools +2.5/10.0
- Condition / age +2.5/5.0
- Appreciation +0.0/10.0
$365,000
🖨 Deal sheet (PDF) 📄 Offer letter ✓ Due diligence
Listing remarks
BRAND NEW CONSTRUCTION BUILT 2024. This Home was just Completely Rebuilt.
Key facts
- 6,534 sq ft lot
- Garage
- Built 2025
Property features AI
Finance
- HOA & community: No HOA (see remarks)
Exterior
- Parking: Detached 1-car garage
- Utilities: Public water; Sewer connected (sewer available); Natural gas available; Cable TV available
- Home design: Contemporary ranch style; Single-story
- Construction: Stucco and wood construction; Composition shingle roof; Concrete slab foundation; Built on Tract #15; Rectangular lot shape; Paved public streets
- Exterior features: Back and block fencing; RV access possible; No solar
Interior
- Flooring: Tile flooring
- Bathrooms: One full bathroom; One three-quarter bathroom
- Heating & cooling: Central heating (gas and electric); Central air
- Interior features: Dining area; Hardscape
- Laundry & utility: Laundry hookups in kitchen with electric and gas connections
Neighborhood map
What this means for you Summary
Snapshot
- This is a 4-bed/2.0-bath single-family listed at $365k.
Deal economics
- At list price, monthly cash flow is $12 ($143/yr) — positive.
- The deal already cash-flows at list — no discount required.
- To meet the 1% rule (rent ≥ 1% of price), the offer needs to be $288k (21.0% below list).
- Recommended offer: $288k (21.0% below list) — sets the bar for 1% rule.
- Cap rate 6.3% vs local median 4.3% in Lancaster — top-decile yield for the area; either an underpriced asset or a hidden risk that comps aren't pricing in. Stress-test before assuming the spread holds.
Location & tenants
- Location reads 68/100 on livability (#282 in CA) — a middle-class / working-renter tenant base. Strengths: commute A+, housing A+, amenities B+; Watch: health & safety C-, crime F, cost of living F.
- Lancaster Elementary (suburban): math 18% / reading 32% proficiency, ranked #1,161 of 1,400 in CA (top 83%) — low school quality limits family demand, transient renter base, plan for 1-2y turnover; 72% free/reduced lunch — lower-income household profile, screen leases tightly.
- Zoned schools: El Dorado Elementary (755 students, 96% FRL); New Vista Middle (883 students, 94% FRL); Antelope Valley High (1,558 students, 83% FRL) — zoned schools average 91% FRL vs 72% district-wide (19 pts higher); higher-poverty schools than district average — tighter screening recommended.
- Market conditions: Rents flat; 1178 active listings in the ZIP; 34 comparable units currently listed for rent nearby; rentals leasing fast (median 0d on market — plan ~1-2 weeks tenant-placement turnaround); 19,697 units permitted in Los Angeles County in 2024 (9,426 in 5+ unit buildings).
- At $2,884/mo this rent would consume 49% of the median local household income ($70k/yr) (locally 2494% of renters already pay >50% of income on rent) — very limited rent-growth headroom before tenants either downsize or default.
Forward outlook
- Local home prices are declining (-3.0%/yr); year-one equity from $3k of loan paydown is wiped out by about $11k of value loss. Plan a longer hold.
- Los Angeles County population projected at +9% by 2050 — modest demand growth; plan on rents tracking national, not racing it.
Negotiation context
- It's been on market 123 days — a 12% lower offer ($321k) is reasonable based on typical stale-listing flexibility.
- 13 sale attempts since 25y ago; this cycle's ask has dropped $48k (12%) from the opening price — seller is motivated, your offer sets the floor, not the list.
- Current owner paid $63k; list at $365k implies a 479% gain — meaningful room to come down on a strong offer.
Risks & watch-outs
- Climate carrying-cost: extreme-heat days projected 7→17/yr by 2055 (HVAC capex compounding) — expect insurance premiums to compound above CPI over the hold.
Questions for the listing agent
- It's been on market 123 days. Have you received any prior offers? Is the seller open to a 21% concession, seller financing, or rate buy-down credit?
- Why hasn't it sold? Are there any deal-killer items the seller is aware of (foundation, flood, title, zoning, code violations)?
- Is there a deadline driving the sale (1031 exchange, divorce, estate, relocation)? That informs how much negotiation room exists.
- Schools are F-rated, which usually means shorter tenancies and higher turnover. Who's the typical renter profile here, and what's been the actual vacancy rate?
- Crime grade is F in this area — have there been break-ins, vandalism, or insurance claims at this property in the last 3 years? What carrier currently insures it and at what premium?
- The area grade is low — what's the realistic commute time and amenity access for the typical tenant pool here? Any planned neighborhood developments (good or bad) we should know about?
- What's the average days-on-market for RENTAL listings here right now (not sales)? A rising rental-DOM trend means longer vacancies and softer asking-rent achievability than the comps imply.
- What's the recent tenant-quality profile in this submarket — average credit score on applications, eviction rate, late-payment / NSF rate, and stable-employment percentage? A property-management company in the area should have these aggregated.
- How much new for-sale + rental construction is in the pipeline within 1–3 miles? Heavy new supply typically softens prices + rents 12–24 months out; constrained supply supports both.
Investment metrics
- 1% rule
- 0.79% ✗
- Cap rate
- 6.33%
- Cash-on-cash
- 0.14%
- DSCR
- 1.01
- GRM
- 10.5
CMA / ARV
- ARV (on-the-fly)
- $357,500
- Comps found
- 12
Show comp detail 12 sales within ~0.75 mi
| Address | Dist | Beds/Ba | Sqft | Sold | Price | $/sf | Match |
|---|---|---|---|---|---|---|---|
| 44627 Rodin | 0.33mi | 3/2.0 (-1) | 1,107 (+1%) | 3mo | $300,000 | $271 | 76 |
| 44551 Stanridge Ave | 0.22mi | 3/2.0 (-1) | 1,184 (+8%) | 5mo | $385,000 | $325 | 68 |
| 44265 Foxton Ave | 0.52mi | 3/1.0 (-1) | 1,088 (-1%) | 1mo | $261,800 | $241 | 64 |
| 646 E Nugent | 0.40mi | 4/2.0 | 1,227 (+12%) | 0mo | $340,000 | $277 | 62 |
| 44727 Andale | 0.38mi | 4/2.0 | 1,227 (+12%) | 2mo | $399,000 | $325 | 61 |
| 44415 Watford Ave | 0.43mi | 3/2.0 (-1) | 1,224 (+11%) | 0mo | $410,000 | $335 | 56 |
| 45001 Logue Ct | 0.58mi | 3/2.0 (-1) | 1,023 (-7%) | 4mo | $425,000 | $415 | 53 |
| 44221 4th St E | 0.60mi | 3/2.0 (-1) | 1,170 (+6%) | 4mo | $440,000 | $376 | 53 |
| 44325 3rd St E | 0.53mi | 3/1.0 (-1) | 1,184 (+8%) | 1mo | $375,000 | $317 | 53 |
| 44432 Stanridge | 0.33mi | 3/2.0 (-1) | 1,260 (+14%) | 4mo | $275,000 | $218 | 52 |
| 44329 3rd E | 0.52mi | 3/1.0 (-1) | 950 (-14%) | 1mo | $342,000 | $360 | 44 |
| 44238 3rd St E | 0.58mi | 3/1.0 (-1) | 943 (-14%) | 6mo | $287,000 | $304 | 35 |
Match score weights: distance 35% · size 25% · config 20% · recency 20%. Top-matched comps best support the ARV.
Projected returns pro-forma
-3.0% appreciation · 0.14% rent growth · sell at horizon
- IRR
- -19.0%
- Equity multiple
- 0.35×
- Total profit
- $-66,567
- Equity at exit
- $54,423
- IRR
- -18.1%
- Equity multiple
- 0.13×
- Total profit
- $-88,714
- Equity at exit
- $31,559
Cash invested: $102,200 (down + closing). Projections, not guarantees.
Landlord ↔ Tenant lean methodology
- Overall (STATE)
- 18 Strongly Tenant-Friendly
- State California
- 18 Strongly Tenant-Friendly · D+13
- County
- — inherits STATE
- City
- — inherits STATE
ZIP-level market 93535
- Home prices YoY
- -24.3%
- Rents YoY
- 0.1%
- Active inventory
- 1178
- Price-to-rent
- 10.5×
Monthly cashflow live
- Estimated rent
- $2,884 high interval (Pro) →
- Mortgage (P&I)
- −$1,914
- Tax from tax record
- −$200 /mo · $2,399/yr
- Insurance
- −$152
- HOA
- −$0
- Vacancy / Maint / Mgmt
- −$606
- Net cashflow
- $12
Break-even live
Sensitivity live
| Price | -10% $219 | -5% $115 | +0% $12 | +5% $-91 | +10% $-195 |
|---|---|---|---|---|---|
| Rent | -10% $-216 | -5% $-102 | +0% $12 | +5% $126 | +10% $240 |
| Rate | -1.0pp $196 | -0.5pp $105 | base $12 | +0.5pp $-83 | +1.0pp $-179 |
UW: 25.0% down · 7.5% · 30yr · 1.5% tax · 5.0% vac · 8.0% maint · 8.0% mgmt
Financing live
Cash to close
- Down payment
- $91,250
- Closing costs
- $10,950
- Reserves months
- —
- Total cash needed
- —
Loan-product check · same deal, 3 products live
Conventional
25% down · 7.5% · 30yr
- Down + closing
- —
- Monthly P&I
- —
- Monthly cashflow
- —
- DSCR
- —
- Eligible?
- —
Personal DTI + credit; lowest rate.
DSCR
20% down · 8.5% · 30yr
- Down + closing
- —
- Monthly P&I
- —
- Monthly cashflow
- —
- DSCR
- —
- Eligible?
- —
No personal income docs; deal must DSCR.
Hard money
10% down · 12.0% · 12mo
- Down + closing
- —
- Monthly P&I
- —
- Monthly cashflow
- —
- DSCR
- —
- Eligible?
- —
Short-term bridge; refi at stabilization.
Rent comps 34 comps
| Address | Beds | Baths | Sqft | Rent | $/sqft | DOM | Units | Dist |
|---|---|---|---|---|---|---|---|---|
| 44538 2nd St E Lancaster, CA | 3.0 | 2.0 | 1260 | $2,380 | $1.89 | 0d | 1 | 0.23mi |
| 44514 Stanridge Ave Lancaster, CA | 3.0 | 2.0 | 1260 | $2,646 | $2.10 | 0d | 1 | 0.24mi |
| 44946 3rd St E Lancaster, CA | 4.0 | 2.0 | 1256 | $2,395 | $1.91 | 17d | 1 | 0.34mi |
| 44961 5th St E Lancaster, CA | 4.0 | 2.0 | 1248 | $2,500 | $2.00 | 0d | 1 | 0.40mi |
| 44283 Raysack Ave Lancaster, CA | 4.0 | 2.0 | 1282 | $2,400 | $1.87 | 12d | 1 | 0.50mi |
| 44258 4th St E Lancaster, CA | 3.0 | 2.0 | 1170 | $2,495 | $2.13 | 0d | 1 | 0.53mi |
| 45027 Division St Lancaster, CA | 3.0 | 2.0 | 1221 | $2,600 | $2.13 | 0d | 1 | 0.54mi |
| 44908 Logue Ave Lancaster, CA | 3.0 | 2.0 | 1473 | $2,495 | $1.69 | 3d | 1 | 0.56mi |
| 201 W Kettering St Lancaster, CA | 4.0 | 2.0 | 1120 | $2,900 | $2.59 | 0d | 1 | 0.56mi |
| 44221 Foxton Ave Lancaster, CA | 3.0 | 1.5 | 1096 | $3,590 | $3.28 | 4d | 1 | 0.59mi |
| 44221 4th St E Lancaster, CA | 3.0 | 2.0 | 1170 | $2,400 | $2.05 | 0d | 1 | 0.59mi |
| 44221 4th St E Lancaster, CA | 3.0 | 2.0 | 1170 | $2,400 | $2.05 | 4d | 1 | 0.59mi |
| 44221 4th St E Lancaster, CA | 1.0–3.0 | 1.0–2.0 | 885 | $2,400 | $2.71 | 3d | 2 | 0.59mi |
| 817 E Kildare St Lancaster, CA | 3.0 | 2.0 | 1179 | $2,800 | $2.37 | 0d | 1 | 0.69mi |
| 44119 Kirkland Ave Lancaster, CA | 3.0 | 2.0 | 1341 | $2,750 | $2.05 | 14d | 1 | 0.71mi |
| 837 Sunrise Ct Lancaster, CA | 3.0 | 2.0 | 1259 | $3,000 | $2.38 | 23d | 1 | 0.74mi |
| 837 Sunrise Ct Lancaster, CA | 3.0 | 2.0 | 1259 | $2,895 | $2.30 | 5d | 1 | 0.74mi |
| 1004 E Newgrove St Lancaster, CA | 3.0 | 2.0 | 1160 | $2,800 | $2.41 | 0d | 1 | 0.75mi |
| 44021 3rd St E Lancaster, CA | 4.0 | 2.0 | 1465 | $2,900 | $1.98 | 21d | 1 | 0.81mi |
| 44021 3rd St E Unit 44021 Lancaster, CA | 4.0 | 2.0 | 1465 | $3,500 | $2.39 | 0d | 1 | 0.81mi |
| 429 E Avenue J7 Lancaster, CA | 3.0 | 2.0 | 1157 | $2,300 | $1.99 | 0d | 1 | 0.86mi |
| 44646 Elm Ave Lancaster, CA | 3.0 | 2.0 | 1200 | $2,700 | $2.25 | 4d | 1 | 0.91mi |
| 45402 5th St E Lancaster, CA | 4.0 | 2.0 | 1237 | $2,775 | $2.24 | 0d | 1 | 0.91mi |
| 45428 Raysack Ave Lancaster, CA | 4.0 | 2.0 | 1244 | $2,900 | $2.33 | 0d | 1 | 0.92mi |
| 45426 Stanridge Ave Lancaster, CA | 3.0 | 2.0 | 1443 | $2,975 | $2.06 | 17d | 1 | 0.92mi |
| 44732 12th St E Lancaster, CA | 3.0 | 2.0 | 1426 | $2,600 | $1.82 | 17d | 1 | 0.97mi |
| 43615 Stanridge Ave Lancaster, CA | 3.0 | 2.0 | 1113 | $2,646 | $2.38 | 0d | 1 | 1.32mi |
| 43611 Stanridge Ave Lancaster, CA | 3.0 | 2.0 | 1113 | $2,600 | $2.34 | 0d | 1 | 1.32mi |
| 45041 Colleen Dr Lancaster, CA | 3.0 | 3.0 | 1303 | $3,100 | $2.38 | 0d | 1 | 1.40mi |
| 730 W Avenue H12 Lancaster, CA | 3.0 | 1.0 | 972 | $2,375 | $2.44 | 0d | 1 | 1.42mi |
| 45329 Gadsden Ave Lancaster, CA | 3.0 | 1.0 | 1005 | $2,300 | $2.29 | 4d | 1 | 1.46mi |
| 45354 Gadsden Ave Lancaster, CA | 3.0 | 1.0 | 1388 | $2,943 | $2.12 | 0d | 1 | 1.46mi |
| 1647 Orchid Ln Lancaster, CA | 3.0 | 3.0 | 1084 | $1,950 | $1.80 | 23d | 1 | 1.46mi |
| 44928 Kingtree Ave Lancaster, CA | 3.0 | 2.0 | 1344 | $2,350 | $1.75 | 0d | 1 | 1.47mi |
Listing history 44 events
-
2026-06-21days on market $365,000 Active 123 DOM
-
2026-06-18days on market $365,000 Active 120 DOM
-
2026-06-17days on market $365,000 Active 119 DOM
-
2026-06-16days on market $365,000 Active 118 DOM
-
2026-06-15days on market $365,000 Active 117 DOM
-
2026-06-13days on market $365,000 Active 115 DOM
-
2026-06-13days on market $365,000 Active 114 DOM
-
2026-06-09days on market $365,000 Active 111 DOM
-
2026-06-08days on market $365,000 Active 110 DOM
-
2026-06-07days on market $365,000 Active 109 DOM
-
2026-06-04days on market $365,000 Active 106 DOM
-
2026-06-03days on market $365,000 Active 105 DOM
-
2026-06-02days on market $365,000 Active 104 DOM
-
2026-06-01days on market $365,000 Active 103 DOM
-
2026-05-31days on market $365,000 Active 102 DOM
-
2026-05-13price $365,000
-
2026-02-16$412,500 Active
-
2015-03-28historical
-
2015-03-28historical
-
2015-03-17historical
-
2012-10-11soldstatus $63,000
-
2010-04-30soldstatus $64,750
-
2010-04-02$54,900
-
2007-08-27historical
-
2007-08-27historical
-
2007-08-25historical
-
2007-08-15$229,900
-
2007-07-03$229,900
-
2007-06-23$229,900
-
2007-06-10$229,900
-
2007-06-10historical
-
2007-05-30$229,900
-
2007-05-30historical
-
2007-05-19$229,900
-
2007-05-02$229,900
-
2007-02-17historical
-
2006-06-11$246,900
-
2006-06-11$246,900
-
2002-05-29soldstatus $97,000
-
2002-04-03$97,000
-
2002-01-09soldstatus $58,000
-
2002-01-09soldstatus $58,000
-
2001-12-01$59,900
-
1978-07-03soldstatus $32,500
ⓘ Source: listings_history table (triggers on properties + properties_extension) + one-shot
backfill from property_details.listing_events for pre-trigger history.
Tax reassessment forecast CA · Resets to sale price
- Current annual tax
- $2,399 · $200/mo
- Projected year-2 tax
- $2,774 · $231/mo
- Expected delta
- +$375/yr (+$31/mo · 15.6%)
ⓘ Screening estimate from a state-policy table — verify with the county assessor before closing.
Climate risk First Street
- Flood 1/10 Low FEMA zone X (unshaded) · 0% chance over 30 yrs
- Wildfire 1/10 Low
- Heat 7/10 Severe 7 d/yr ≥101°F today · 17 d/yr by 30 yrs out
- Wind 1/10 Low
- Air quality 8/10 Severe 16 unhealthy d/yr today · 21 by 30 yrs out
Nearby sold comps map
Loading sold comps map…
Walkable amenities ~0.75 mi
Loading nearby amenities…
Taxation est. · year 1
- Rental income
- $34,603
- − Mortgage interest
- −$20,446
- − Property taxes
- −$2,399
- − Insurance
- −$1,825
- − Repairs & maintenance
- −$2,768
- − Management
- −$2,768
- − Depreciation
- −$10,618
- Taxable loss
- −$6,221
- Est. tax savings @ 24.0%
- +$1,493
- After-tax cash flow
- $1,636/yr
For passive investors: Depreciation is non-cash, so a rental often shows a tax loss while cash-flowing — sheltering income. Rental losses are passive: they offset passive income freely, and up to $25,000/yr can offset ordinary (W-2) income if you actively participate and your MAGI is under $100k (phasing out to $0 by $150k); unused losses carry forward. On sale, claimed depreciation is recaptured at up to 25%, and gains may owe capital-gains tax (a 1031 exchange can defer both). Figures are a year-1 estimate at your 24.0% rate — not tax advice; consult a CPA.
Schools (NCES district)
- District
- Lancaster Elementary
- NCES district ID
- 0620880
- Math proficiency
- 18% ▲ 1.00%
- Reading proficiency
- 32% ▬ 0.00%
- Median HH income
- $46,440
- Composite
- 24.73/100
- National rank
- #13028
- State rank
- #1161 of 1400 in CA
Livability — Lancaster
- Score
- 68/100
- State rank
- #282
- US rank
- #9504
Category grades
Schools grade is shown separately in the Schools card above.
Census & demographics
- Census place
- Lancaster, CA
- County
- Los Angeles County · 9,444,647 people
- City population
- 194,251
- Metro
- Los Angeles-Long Beach-Anaheim, CA
- Population (ZIP)
- 79,409
- Household income
- $70,360
- Rent vs Own
- Severe rent burden
- 2494.0
Population outlook (Los Angeles County) Hauer SSP2
- Today (2025)
- 10,940,515 people
- By 2030
- 11,256,481 · +2.9%
- By 2040
- 11,729,929 · +7.2%
- By 2050
- 11,948,407 · +9.2%
- By 2075
- 11,818,114 · +8.0%
- By 2100
- 10,842,928 · -0.9%
Race, ethnicity, and origin ACS 2023
- Neighborhood character
- Diverse neighborhood (Simpson 0.63)
- Race & ethnicity
- Hispanic / Latino 55% Two or more races 25% Black 21% White 17% Asian 2% Native American 1%
- Hispanic origin (detail)
- Mexican 42%
- Common ancestry
- Romanian 1% Italian 1% Lithuanian 1%
- Foreign-born
- 13% · Canada
- Languages at home
- 60% English-only · Spanish 37% Tagalog/Filipino 1% Other Indo-European 1%
Political lean MEDSL · Los Angeles
- 2024 margin
- Solid D (+32.9) · D 64.8% · R 31.9% · Other 3.3%
- 2008→2024 swing
- -7.4pp toward R · 2008: 40.4pp · 2024: 32.9pp
- All cycles
- 2024: D+32.9 2020: D+44.2 2016: D+48.0 2012: D+40.0 2008: D+40.4
Not yet ingested
- Civics
- —
Market trends
- HPI YoY
- ▼ -144.13%
- Current HPI
- 449.4494
- Rent YoY
- ▲ 0.14%
- Metro
- Los Angeles-Long Beach-Anaheim, CA
- State GDP YoY
- ▲ 3.21%
- F500 in state
- 116
Industry mix (Fortune 500 HQ in CA)
| Industry | F500 HQs | Revenue |
|---|---|---|
| Technology | 27 | $1,492B |
|
||
| Financial Services | 3 | $174B |
|
||
| Retail | 3 | $44B |
|
||
| Insurance | 3 | $26B |
|
||
| Media / Entertainment | 2 | $115B |
|
||
| Pharmaceuticals / Biotech | 2 | $62B |
|
||
Price history
+1023.1% since first listed29 events — show timeline
- 2026-05-13 Price Changed $365,000 AVMLS
- 2026-02-16 Listed $412,500 AVMLS
- 2015-03-28 Listing Removed — AVMLS
- 2015-03-28 Listing Removed — AVMLS
- 2015-03-17 Listing Removed — AVMLS
- 2012-10-11 Sold (Public Records) $63,000 Public Records
- 2010-04-30 Sold (MLS) $64,750 AVMLS
- 2010-04-02 Listed $54,900 AVMLS
- 2007-08-27 Listing Removed — AVMLS
- 2007-08-27 Listing Removed — AVMLS
- 2007-08-25 Listing Removed — CRMLS
- 2007-08-15 Listed $229,900 AVMLS
- 2007-07-03 Listed $229,900 AVMLS
- 2007-06-23 Listed $229,900 AVMLS
- 2007-06-10 Listing Removed — AVMLS
- 2007-06-10 Listed $229,900 AVMLS
- 2007-05-30 Listed $229,900 CRMLS
- 2007-05-30 Listing Removed — AVMLS
- 2007-05-19 Listed $229,900 AVMLS
- 2007-05-02 Listed $229,900 AVMLS
- 2007-02-17 Listing Removed — CRMLS
- 2006-06-11 Listed $246,900 CRMLS
- 2006-06-11 Listed $246,900 AVMLS
- 2002-05-29 Sold (MLS) $97,000 AVMLS
- 2002-04-03 Listed $97,000 AVMLS
- 2002-01-09 Sold (Public Records) $58,000 Public Records
- 2002-01-09 Sold (MLS) $58,000 AVMLS
- 2001-12-01 Listed $59,900 AVMLS
- 1978-07-03 Sold (Public Records) $32,500 Public Records
Property tax history
+1.8%/yrLatest (2025): $2,399 · +5.5% YoY. Source: county tax records.
Cash-flow waterfall
monthlySold comps — $/sqft
last 12 mo · ≤1 miLoading sold comps…