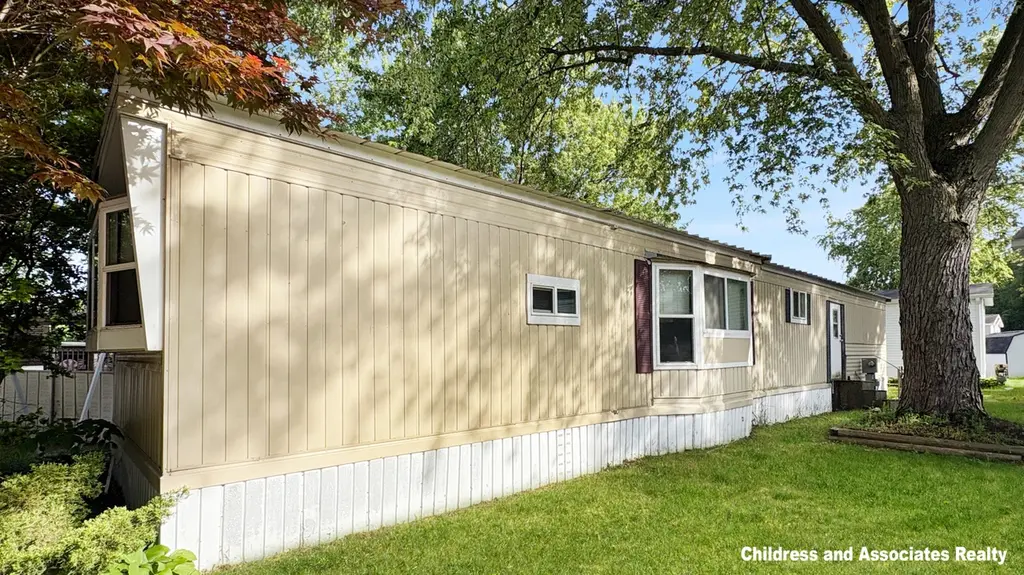
360 N Sword St SW · Byron, MI
Flood risk No data
- FEMA flood zone
- —
- Chance of flooding over 30 yrs
- —
- Est. flood insurance / yr
- —
Fire risk No data
- Est. fire insurance / yr
- —
Heat risk No data
- Hot days now (above threshold)
- —
- Hot days in 30 yrs
- —
Wind risk No data
- Chance of severe wind over 30 yrs
- —
Air-quality risk No data
- Unhealthy air days now
- —
- Unhealthy air days in 30 yrs
- —
Risk factors via First Street. Map © Google.
Why this score? — see what drove the D grade
The composite is a weighted blend of 9 inputs, each scored 0–100. Each bar is that input's sub-score; the figure is the points it added to the 100-point composite (weight × sub-score).
- Cash flow +15.0/30.0
- ARV discount +7.5/15.0
- 1% rule +5.0/10.0
- DSCR +5.0/10.0
- Schools +3.4/10.0
- Livability +3.3/5.0
- Rent growth +2.5/5.0
- Condition / age +2.5/5.0
- Appreciation +0.0/10.0
$20,000
🖨 Deal sheet (PDF) 📄 Offer letter ✓ Due diligence
Listing remarks MLS
Here's your chance to get into Cutler Estates at the right number. This 2-bedroom, 1-bathroom manufactured home needs some TLC, but the bones are there -- and the opportunity is real. The spacious kitchen has great potential for someone willing to put in the work. The deck and carport are already in place. And once you're done? You get to enjoy everything Cutler Estates has to offer -- pool, clubhouse, and a pet-friendly community that's tough to beat at this price.
Key facts
- Clubhouse
- Spacious kitchen
- Carport
Tags
Property features AI
Finance
- HOA & community: Monthly association fees; Community clubhouse; Community playground; Community pool; Community storage
Exterior
- Parking: Carport (no attached garage)
- Utilities: Public water
- Home design: Ranch-style residence; Built in 1970
- Construction: Vinyl siding
- Exterior features: Leased land
Interior
- Kitchen: Microwave
- Bathrooms: 1 full bathroom
- Heating & cooling: Forced air heating
- Interior features: Eat-in kitchen; 6 total rooms; Crawl space basement
- Laundry & utility: Washer; Dryer
Neighborhood map
What this means for you Summary
Snapshot
- This is a 2-bed/1.0-bath manufactured listed at $20k.
Deal economics
- At list price, monthly cash flow is $243 ($3k/yr) — positive.
- The deal already cash-flows at list — no discount required.
- Meets the 1% rule at list price ($1k rent vs $20k).
- Cap rate 20.9% vs local median 1.7% in Byron — top-decile yield for the area; either an underpriced asset or a hidden risk that comps aren't pricing in. Stress-test before assuming the spread holds.
Location & tenants
- Location reads 66/100 on livability (#410 in MI) — a middle-class / working-renter tenant base. Strengths: cost of living A+, housing A+, employment B; Watch: crime D+, amenities F, commute F.
- Kentwood Public Schools (suburban): math 34% / reading 46% proficiency, ranked #206 of 540 in MI (top 38%) — families likely to look elsewhere, expect single-tenant / working-renter base with shorter leases.
- Market conditions: 109 active listings in the ZIP; 5 comparable units currently listed for rent nearby; rentals leasing fast (median 11d on market — plan ~1-2 weeks tenant-placement turnaround); 2,253 units permitted in Kent County in 2024 (969 in 5+ unit buildings).
Forward outlook
- Local home prices are declining (-3.0%/yr); year-one equity from $138 of loan paydown is wiped out by about $600 of value loss. Plan a longer hold.
- Kent County population projected at +22% by 2050 — long-run rental-demand tailwind backs the buy-and-hold thesis.
- At projected returns (-3.0% appreciation + 3.0% rent growth), your $6k cash investment doubles in ~3 years — after that, you're playing with house money.
Negotiation context
- Only 10 days on market — expect competitive offers; lowballing is unlikely to land.
- 3 sale attempts with the ask held roughly flat each time — persistent listings suggest the price (not the market) is what's stuck; bring a comps-based counter.
Risks & watch-outs
- Watch-outs: HOA is 53% of rent.
Questions for the listing agent
- Built in 1970 — when were the roof, HVAC, electrical panel, plumbing, and water heater last replaced?
- What does the HOA fee cover, when was the last increase, and are there any pending special assessments or reserve-fund shortfalls?
- Is there a deadline driving the sale (1031 exchange, divorce, estate, relocation)? That informs how much negotiation room exists.
- Schools are B-rated — typically a magnet for longer-tenancy family renters. What's the average tenant stay here, and is there a school-zone premium baked into asking?
- Crime grade is D in this area — have there been break-ins, vandalism, or insurance claims at this property in the last 3 years? What carrier currently insures it and at what premium?
- The area grade is low — what's the realistic commute time and amenity access for the typical tenant pool here? Any planned neighborhood developments (good or bad) we should know about?
- What's the average days-on-market for RENTAL listings here right now (not sales)? A rising rental-DOM trend means longer vacancies and softer asking-rent achievability than the comps imply.
- What's the recent tenant-quality profile in this submarket — average credit score on applications, eviction rate, late-payment / NSF rate, and stable-employment percentage? A property-management company in the area should have these aggregated.
- How much new for-sale + rental construction is in the pipeline within 1–3 miles? Heavy new supply typically softens prices + rents 12–24 months out; constrained supply supports both.
Investment metrics
- 1% rule
- 7.46% ✓
- Cap rate
- 20.88%
- Cash-on-cash
- 52.11%
- DSCR
- 3.32
- GRM
- 1.1
CMA / ARV
- ARV (on-the-fly)
- $63,000
- Comps found
- 3
Show comp detail 3 sales within ~0.75 mi
| Address | Dist | Beds/Ba | Sqft | Sold | Price | $/sf | Match |
|---|---|---|---|---|---|---|---|
| 316 S Harewood Dr SW | 0.36mi | 3/2.0 (+1) | 1,216 (-4%) | 0mo | $31,700 | $26 | 68 |
| 6518 Dagger Ave SW | 0.21mi | 3/2.0 (+1) | 1,404 (+11%) | 3mo | $69,900 | $50 | 60 |
| 6516 Bayonet Ave SW | 0.18mi | 3/2.0 (+1) | 1,088 (-14%) | 10mo | $56,000 | $51 | 52 |
Match score weights: distance 35% · size 25% · config 20% · recency 20%. Top-matched comps best support the ARV.
Projected returns pro-forma
-3.0% appreciation · 3.0% rent growth · sell at horizon
- IRR
- 51.2%
- Equity multiple
- 3.28×
- Total profit
- $12,759
- Equity at exit
- $2,982
- IRR
- 57.0%
- Equity multiple
- 6.92×
- Total profit
- $33,135
- Equity at exit
- $1,729
Cash invested: $5,600 (down + closing). Projections, not guarantees.
Landlord ↔ Tenant lean methodology
- Overall (STATE)
- 62 Landlord-Friendly
- State Michigan
- 62 Landlord-Friendly · EVEN
- County
- — inherits STATE
- City
- — inherits STATE
ZIP-level market 49548
- Active inventory
- 109
- Price-to-rent
- 1.1×
Monthly cashflow live
- Estimated rent
- $1,492 high interval (Pro) →
- Mortgage (P&I)
- −$105
- Tax est. 1.5%
- −$25 /mo · $300/yr
- Insurance
- −$8
- HOA
- −$797
- Vacancy / Maint / Mgmt
- −$313
- Net cashflow
- $243
Break-even live
Sensitivity live
| Price | -10% $257 | -5% $250 | +0% $243 | +5% $236 | +10% $229 |
|---|---|---|---|---|---|
| Rent | -10% $125 | -5% $184 | +0% $243 | +5% $302 | +10% $361 |
| Rate | -1.0pp $253 | -0.5pp $248 | base $243 | +0.5pp $238 | +1.0pp $233 |
UW: 25.0% down · 7.5% · 30yr · 1.5% tax · 5.0% vac · 8.0% maint · 8.0% mgmt
Financing live
Cash to close
- Down payment
- $5,000
- Closing costs
- $600
- Reserves months
- —
- Total cash needed
- —
Loan-product check · same deal, 3 products live
Conventional
25% down · 7.5% · 30yr
- Down + closing
- —
- Monthly P&I
- —
- Monthly cashflow
- —
- DSCR
- —
- Eligible?
- —
Personal DTI + credit; lowest rate.
DSCR
20% down · 8.5% · 30yr
- Down + closing
- —
- Monthly P&I
- —
- Monthly cashflow
- —
- DSCR
- —
- Eligible?
- —
No personal income docs; deal must DSCR.
Hard money
10% down · 12.0% · 12mo
- Down + closing
- —
- Monthly P&I
- —
- Monthly cashflow
- —
- DSCR
- —
- Eligible?
- —
Short-term bridge; refi at stabilization.
Rent comps 5 comps
| Address | Beds | Baths | Sqft | Rent | $/sqft | DOM | Units | Dist |
|---|---|---|---|---|---|---|---|---|
| 6700 Creekstone Ln SW Grand Rapids, MI | 2.0 | 1.0 | 1000 | $1,285 | $1.28 | 3d | 1 | 0.30mi |
| 6263 Division Ave S Grand Rapids, MI | 2.0–3.0 | 2.0 | 1200 | $1,339 | $1.12 | 3d | 1 | 0.45mi |
| 7283 Division Ave S Grand Rapids, MI | 3.0 | 2.0 | 1152 | $1,514 | $1.31 | 22d | 1 | 0.87mi |
| 545 68th St SE Grand Rapids, MI | 3.0 | 2.5 | 1800 | $2,400 | $1.33 | 44d | 1 | 1.18mi |
| 5790 Madison Ave SE Unit 5790 Grand Rapids, MI | 3.0 | 1.0 | 1300 | $1,795 | $1.38 | 11d | 1 | 1.24mi |
HOA detail
- Monthly dues
- $797 · $9,564/yr
- Likely covers
- pool
Listing history 9 events
-
2026-06-18days on market $20,000 Active 10 DOM
-
2026-06-17days on market $20,000 Active 9 DOM
-
2026-06-16days on market $20,000 Active 8 DOM
-
2026-06-15days on market $20,000 Active 7 DOM
-
2026-06-14days on market $20,000 Active 5 DOM
-
2026-06-13days on market $20,000 Active 4 DOM
-
2026-06-10days on market $20,000 Active 2 DOM
-
2026-06-09remarks 470-char remark
-
2026-06-09$20,000 Active 1 DOM
ⓘ Source: listings_history table (triggers on properties + properties_extension) + one-shot
backfill from property_details.listing_events for pre-trigger history.
Nearby sold comps map
Loading sold comps map…
Walkable amenities ~0.75 mi
Loading nearby amenities…
Taxation est. · year 1
- Rental income
- $17,900
- − Mortgage interest
- −$1,120
- − Property taxes
- −$300
- − Insurance
- −$100
- − Repairs & maintenance
- −$1,432
- − Management
- −$1,432
- − HOA
- −$9,564
- − Depreciation
- −$582
- Taxable income
- $3,370
- Est. tax owed @ 24.0%
- −$809
- After-tax cash flow
- $2,109/yr
For passive investors: Depreciation is non-cash, so a rental often shows a tax loss while cash-flowing — sheltering income. Rental losses are passive: they offset passive income freely, and up to $25,000/yr can offset ordinary (W-2) income if you actively participate and your MAGI is under $100k (phasing out to $0 by $150k); unused losses carry forward. On sale, claimed depreciation is recaptured at up to 25%, and gains may owe capital-gains tax (a 1031 exchange can defer both). Figures are a year-1 estimate at your 24.0% rate — not tax advice; consult a CPA.
Schools (NCES district)
- District
- Kentwood Public Schools
- NCES district ID
- 2620340
- Math proficiency
- 34% ▼ -4.00%
- Reading proficiency
- 46% ▼ -3.00%
- Median HH income
- $48,962
- Composite
- 34.35/100
- National rank
- #5226
- State rank
- #206 of 540 in MI
Livability — Byron
- Score
- 66/100
- State rank
- #410
- US rank
- #11251
Category grades
Schools grade is shown separately in the Schools card above.
Census & demographics
- Census place
- Cutlerville, MI
- County
- Kent County · 533,805 people
- Metro
- Grand Rapids-Kentwood, MI
- Population (ZIP)
- 34,777
- Household income
- $61,636
- Rent vs Own
- Severe rent burden
- 781.0
Population outlook (Kent County) Hauer SSP2
- Today (2025)
- 712,484 people
- By 2030
- 748,618 · +5.1%
- By 2040
- 814,777 · +14.4%
- By 2050
- 868,556 · +21.9%
- By 2075
- 966,487 · +35.7%
- By 2100
- 967,975 · +35.9%
Race, ethnicity, and origin ACS 2023
- Neighborhood character
- Diverse neighborhood (Simpson 0.68)
- Race & ethnicity
- White 49% Hispanic / Latino 22% Two or more races 16% Black 15% Asian 6% Native American 1%
- Hispanic origin (detail)
- Mexican 15% Puerto Rican 4%
- Common ancestry
- Iranian 10% Romanian 4% Lithuanian 2%
- Foreign-born
- 13% · Canada, Vietnam, China
- Languages at home
- 78% English-only · Spanish 14% Vietnamese 2% French/Haitian/Cajun 1%
Political lean MEDSL · Kent
- 2024 margin
- Lean D (+5.4) · D 51.8% · R 46.5% · Other 1.7%
- 2008→2024 swing
- +4.8pp toward D · 2008: 0.5pp · 2024: 5.4pp
- All cycles
- 2024: D+5.4 2020: D+6.1 2016: R+3.1 2012: R+7.9 2008: D+0.5
Not yet ingested
- Civics
- —
Market trends
- HPI YoY
- ▼ -208.41%
- Current HPI
- 325.8096
- Rent YoY
- —
- Metro
- Grand Rapids-Kentwood, MI
- State GDP YoY
- ▲ 1.37%
- F500 in state
- 28
Industry mix (Fortune 500 HQ in MI)
| Industry | F500 HQs | Revenue |
|---|---|---|
| Automotive Parts | 3 | $48B |
|
||
| Automotive | 2 | $372B |
|
||
| Chemicals | 1 | $45B |
|
||
| Automotive Retail | 1 | $29B |
|
||
| Healthcare / Medical Devices | 1 | $23B |
|
||
| Automotive Technology | 1 | $20B |
|
||
Price history
+0.0% since first listed3 events — show timeline
- 2026-06-08 Listed $20,000 MiRealSource-MiMLS
- 2026-06-08 Listed $20,000 REALCOMP
- 2026-06-08 Listed $20,000 SW Michigan MLS
Cash-flow waterfall
monthlySold comps — $/sqft
last 12 mo · ≤1 miLoading sold comps…