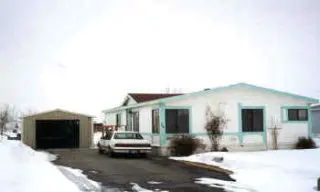
2143 N Whispering Pines Dr · Idaho Falls, ID
Flood risk No data
- FEMA flood zone
- —
- Chance of flooding over 30 yrs
- —
- Est. flood insurance / yr
- —
Fire risk No data
- Est. fire insurance / yr
- —
Heat risk No data
- Hot days now (above threshold)
- —
- Hot days in 30 yrs
- —
Wind risk No data
- Chance of severe wind over 30 yrs
- —
Air-quality risk No data
- Unhealthy air days now
- —
- Unhealthy air days in 30 yrs
- —
Risk factors via First Street. Map © Google.
Why this score? — see what drove the F grade
The composite is a weighted blend of 9 inputs, each scored 0–100. Each bar is that input's sub-score; the figure is the points it added to the 100-point composite (weight × sub-score).
- 1% rule +10.0/10.0
- ARV discount +7.5/15.0
- Livability +4.3/5.0
- Schools +4.2/10.0
- Rent growth +2.6/5.0
- Condition / age +2.5/5.0
- Cash flow +2.2/30.0
- DSCR +0.0/10.0
- Appreciation +0.0/10.0
$90,000
🖨 Deal sheet (PDF) 📄 Offer letter ✓ Due diligence
Listing remarks MLS
CLEAN, WELL CARED FOR SPACIOUS HOME. LOADED WITH EASY LIVING AMMENETIES. AUTO SPRINKLER IN YARD. T HREE CAR, SINGLE WIDE, STEEL GARAGE/SHOP!! CALL K EVIN TO SEE INSIDE.
Key facts
- Built-in pantry
- Extended carport
- Backyard with room
Tags
Property features AI
Finance
- HOA & community: Homeowners association with monthly fee of $925
Exterior
- Parking: Detached garage (1 car); Asphalt driveway
- Utilities: Public water; Public sewer; Natural gas available
- Home design: Manufactured home (without land); One story
- Construction: Vinyl siding
- Exterior features: Chain link fencing; Gazebo
Interior
- Kitchen: Dishwasher; Refrigerator
- Flooring: Linoleum; Carpet
- Bathrooms: 2 full bathrooms
- Heating & cooling: Forced air heating (natural gas); Central air conditioning
- Interior features: Accessible entrance; Dishwasher; Refrigerator
Neighborhood map
What this means for you Summary
Snapshot
- This is a ?-bed/2.0-bath manufactured listed at $90k.
Deal economics
- At list price, monthly cash flow is $-322 ($-4k/yr) — negative.
- To cash-flow at today's rent, offer at most $33k (63.3% below list).
- Meets the 1% rule at list price ($1k rent vs $90k).
- Recommended offer: $33k (63.3% below list) — sets the bar for cash-flow.
Location & tenants
- Location reads 86/100 on livability (#3 in ID, #428 nationally) — a professional / high-income tenant draw. Strengths: amenities A+, cost of living A+, housing A+.
- Bonneville Joint District (suburban): math 41% / reading 57% proficiency, ranked #30 of 92 in ID (top 33%) — families likely to look elsewhere, expect single-tenant / working-renter base with shorter leases.
- Zoned schools: Summit Hills Elementary School (math 39% / reading 55%, grade D-, #176 of 357 statewide, top 53%, 503 students, 35% FRL); Rocky Mountain Middle School (math 39% / reading 59%, grade C-, #34 of 109 statewide, top 34%, 536 students, 32% FRL); Bonneville High School (math 33% / reading 64%, grade D, #51 of 169 statewide, top 30%, 1,128 students, 23% FRL) — zoned schools at 30% FRL track the district average.
- Market conditions: Rents flat; 401 active listings in the ZIP; 5 comparable units currently listed for rent nearby; rentals at typical pace (median 23d on market — plan ~3-4 weeks tenant-placement turnaround); solid renter incomes; 2,253 units permitted in Bonneville County in 2024 (1,051 in 5+ unit buildings).
Forward outlook
- Local home prices are declining (-3.0%/yr); year-one equity from $622 of loan paydown is wiped out by about $3k of value loss. Plan a longer hold.
- Bonneville County population projected at +18% by 2050 — long-run rental-demand tailwind backs the buy-and-hold thesis.
Negotiation context
- It's been on market 67 days — a 6% lower offer ($85k) is reasonable based on typical stale-listing flexibility.
- 2 sale attempts since 25y ago with the ask held roughly flat each time — persistent listings suggest the price (not the market) is what's stuck; bring a comps-based counter.
Risks & watch-outs
- Watch-outs: HOA is 64% of rent.
Questions for the listing agent
- What do current leases actually rent for vs. the listed asking? Can we see a recent rent roll and the last 12 months of T-12 income?
- It's been on market 67 days. Have you received any prior offers? Is the seller open to a 63% concession, seller financing, or rate buy-down credit?
- What does the HOA fee cover, when was the last increase, and are there any pending special assessments or reserve-fund shortfalls?
- Why hasn't it sold? Are there any deal-killer items the seller is aware of (foundation, flood, title, zoning, code violations)?
- Is there a deadline driving the sale (1031 exchange, divorce, estate, relocation)? That informs how much negotiation room exists.
- The area grade is low — what's the realistic commute time and amenity access for the typical tenant pool here? Any planned neighborhood developments (good or bad) we should know about?
- What's the average days-on-market for RENTAL listings here right now (not sales)? A rising rental-DOM trend means longer vacancies and softer asking-rent achievability than the comps imply.
- What's the recent tenant-quality profile in this submarket — average credit score on applications, eviction rate, late-payment / NSF rate, and stable-employment percentage? A property-management company in the area should have these aggregated.
- How much new for-sale + rental construction is in the pipeline within 1–3 miles? Heavy new supply typically softens prices + rents 12–24 months out; constrained supply supports both.
Investment metrics
- 1% rule
- 1.60% ✓
- Cap rate
- 2.00%
- Cash-on-cash
- -15.35%
- DSCR
- 0.32
- GRM
- 5.2
CMA / ARV
No comps found within radius.
Projected returns pro-forma
-3.0% appreciation · 0.51% rent growth · sell at horizon
- IRR
- -54.8%
- Equity multiple
- -0.51×
- Total profit
- $-38,086
- Equity at exit
- $13,419
- IRR
- —
- Equity multiple
- -1.82×
- Total profit
- $-71,127
- Equity at exit
- $7,782
Cash invested: $25,200 (down + closing). Projections, not guarantees.
Landlord ↔ Tenant lean methodology
- Overall (STATE)
- 91 Strongly Landlord-Friendly
- State Idaho
- 91 Strongly Landlord-Friendly · R+18
- County
- — inherits STATE
- City
- — inherits STATE
ZIP-level market 83401
- Home prices YoY
- -30.6%
- Rents YoY
- 0.5%
- Active inventory
- 401
- Price-to-rent
- 5.2×
Monthly cashflow live
- Estimated rent
- $1,436 high interval (Pro) →
- Mortgage (P&I)
- −$472
- Tax from tax record
- −$22 /mo · $264/yr
- Insurance
- −$38
- HOA
- −$925
- Vacancy / Maint / Mgmt
- −$301
- Net cashflow
- $-322
Break-even live
Sensitivity live
| Price | -10% $-271 | -5% $-297 | +0% $-322 | +5% $-348 | +10% $-373 |
|---|---|---|---|---|---|
| Rent | -10% $-436 | -5% $-379 | +0% $-322 | +5% $-266 | +10% $-209 |
| Rate | -1.0pp $-277 | -0.5pp $-299 | base $-322 | +0.5pp $-346 | +1.0pp $-369 |
UW: 25.0% down · 7.5% · 30yr · 1.5% tax · 5.0% vac · 8.0% maint · 8.0% mgmt
Financing live
Cash to close
- Down payment
- $22,500
- Closing costs
- $2,700
- Reserves months
- —
- Total cash needed
- —
Loan-product check · same deal, 3 products live
Conventional
25% down · 7.5% · 30yr
- Down + closing
- —
- Monthly P&I
- —
- Monthly cashflow
- —
- DSCR
- —
- Eligible?
- —
Personal DTI + credit; lowest rate.
DSCR
20% down · 8.5% · 30yr
- Down + closing
- —
- Monthly P&I
- —
- Monthly cashflow
- —
- DSCR
- —
- Eligible?
- —
No personal income docs; deal must DSCR.
Hard money
10% down · 12.0% · 12mo
- Down + closing
- —
- Monthly P&I
- —
- Monthly cashflow
- —
- DSCR
- —
- Eligible?
- —
Short-term bridge; refi at stabilization.
Rent comps 5 comps
| Address | Beds | Baths | Sqft | Rent | $/sqft | DOM | Units | Dist |
|---|---|---|---|---|---|---|---|---|
| 1522 Quail Dr Idaho Falls, ID | 3.0 | 2.0 | 1204 | $1,865 | $1.55 | 15d | 1 | 0.48mi |
| 1428 Red RD Idaho Falls, ID | 2.0–3.0 | 2.0–2.5 | 1327 | $1,549 | $1.17 | 15d | 25 | 0.49mi |
| 1522 Quail Dr Unit 1207 Idaho Falls, ID | 2.0 | 2.0 | 990 | $1,545 | $1.56 | 23d | 1 | 0.54mi |
| 1522 Quail Dr Unit 3108 Idaho Falls, ID | 3.0 | 2.0 | 1204 | $1,865 | $1.55 | 23d | 1 | 0.56mi |
| 2910 E Lincoln Rd Idaho Falls, ID | 2.0 | 1.0 | 900 | $1,150 | $1.28 | 23d | 1 | 0.87mi |
HOA detail
- Monthly dues
- $925 · $11,100/yr
Listing history 5 events
-
2026-03-23$90,000 Active
-
2026-02-21price $90,000
-
2026-02-11price $100,000
-
2001-04-30soldstatus 169-char remark
Show marketing remark (169 chars)
CLEAN, WELL CARED FOR SPACIOUS HOME. LOADED WITH EASY LIVING AMMENETIES. AUTO SPRINKLER IN YARD. T HREE CAR, SINGLE WIDE, STEEL GARAGE/SHOP!! CALL K EVIN TO SEE INSIDE.
-
2001-02-27$29,500 169-char remark
Show marketing remark (169 chars)
CLEAN, WELL CARED FOR SPACIOUS HOME. LOADED WITH EASY LIVING AMMENETIES. AUTO SPRINKLER IN YARD. T HREE CAR, SINGLE WIDE, STEEL GARAGE/SHOP!! CALL K EVIN TO SEE INSIDE.
ⓘ Source: listings_history table (triggers on properties + properties_extension) + one-shot
backfill from property_details.listing_events for pre-trigger history.
Tax reassessment forecast ID · Resets to sale price
- Current annual tax
- $264 · $22/mo
- Projected year-2 tax
- $621 · $52/mo
- Expected delta
- +$357/yr (+$30/mo · 135.2%)
ⓘ Screening estimate from a state-policy table — verify with the county assessor before closing.
Nearby sold comps map
Loading sold comps map…
Walkable amenities ~0.75 mi
Loading nearby amenities…
Taxation est. · year 1
- Rental income
- $17,228
- − Mortgage interest
- −$5,041
- − Property taxes
- −$264
- − Insurance
- −$450
- − Repairs & maintenance
- −$1,378
- − Management
- −$1,378
- − HOA
- −$11,100
- − Depreciation
- −$2,618
- Taxable loss
- −$5,002
- Est. tax savings @ 24.0%
- +$1,201
- After-tax cash flow
- $-2,667/yr
For passive investors: Depreciation is non-cash, so a rental often shows a tax loss while cash-flowing — sheltering income. Rental losses are passive: they offset passive income freely, and up to $25,000/yr can offset ordinary (W-2) income if you actively participate and your MAGI is under $100k (phasing out to $0 by $150k); unused losses carry forward. On sale, claimed depreciation is recaptured at up to 25%, and gains may owe capital-gains tax (a 1031 exchange can defer both). Figures are a year-1 estimate at your 24.0% rate — not tax advice; consult a CPA.
Schools (NCES district)
- District
- Bonneville Joint District
- NCES district ID
- 1600930
- Math proficiency
- 41% ▼ -2.00%
- Reading proficiency
- 57% ▲ 1.00%
- Median HH income
- $55,775
- Composite
- 42.45/100
- National rank
- #3219
- State rank
- #30 of 92 in ID
Livability — Idaho Falls
- Score
- 86/100
- State rank
- #3
- US rank
- #428
Category grades
Schools grade is shown separately in the Schools card above.
Census & demographics
- Census place
- Idaho Falls, ID
- County
- Bonneville County · 125,162 people
- City population
- 105,466
- Metro
- Idaho Falls, ID
- Population (ZIP)
- 47,972
- Household income
- $78,497
- Rent vs Own
- Severe rent burden
- 422.0
Population outlook (Bonneville County) Hauer SSP2
- Today (2025)
- 120,170 people
- By 2030
- 124,993 · +4.0%
- By 2040
- 134,091 · +11.6%
- By 2050
- 142,122 · +18.3%
- By 2075
- 157,767 · +31.3%
- By 2100
- 160,316 · +33.4%
Race, ethnicity, and origin ACS 2023
- Neighborhood character
- Predominantly White (80%)
- Race & ethnicity
- White 80% Hispanic / Latino 15% Two or more races 8%
- Hispanic origin (detail)
- Mexican 11% Puerto Rican 1%
- Common ancestry
- Italian 4% Slovak 3% Portuguese 2%
- Foreign-born
- 4% · Canada
- Languages at home
- 90% English-only · Spanish 9%
Political lean MEDSL · Bonneville
- 2024 margin
- Solid R (+45.4) · D 25.6% · R 71.0% · Other 3.4%
- 2008→2024 swing
- -2.4pp toward R · 2008: -43.0pp · 2024: -45.4pp
- All cycles
- 2024: R+45.4 2020: R+43.6 2016: R+40.2 2012: R+51.8 2008: R+43.0
Not yet ingested
- Civics
- —
Market trends
- HPI YoY
- ▼ -164.87%
- Current HPI
- 374.2807
- Rent YoY
- ▲ 0.51%
- Metro
- Idaho Falls, ID
- State GDP YoY
- ▲ 4.51%
- F500 in state
- 6
Industry mix (Fortune 500 HQ in ID)
| Industry | F500 HQs | Revenue |
|---|---|---|
| Retail | 1 | $79B |
|
||
| Technology | 1 | $25B |
|
||
| Food / Agriculture | 1 | $6B |
|
||
Price history
+205.1% since first listed5 events — show timeline
- 2026-03-23 Listed $90,000 SRMLS
- 2026-02-21 Price Changed $90,000 SRMLS
- 2026-02-11 Price Changed $100,000 SRMLS
- 2001-04-30 Sold (MLS) — SRMLS
- 2001-02-27 Listed $29,500 SRMLS
Cash-flow waterfall
monthlySold comps — $/sqft
last 12 mo · ≤1 miLoading sold comps…