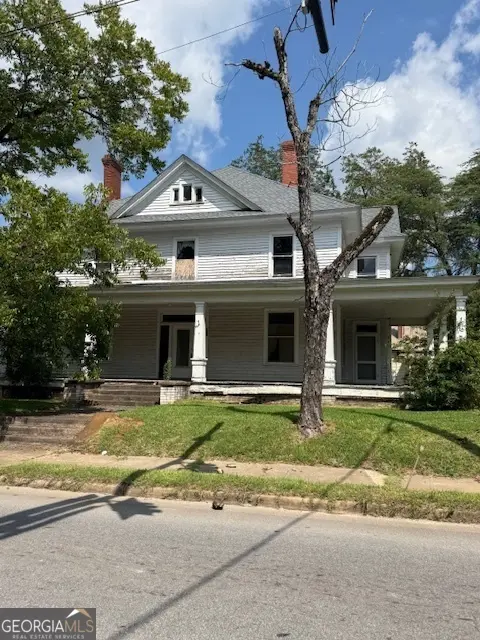
302 N Harris St · Sandersville, GA
Flood risk 1/10 · Minimal
- FEMA flood zone
- X (unshaded)
- Chance of flooding over 30 yrs
- 0.0%
- Est. flood insurance / yr
- $507 – $1,088
Fire risk 3/10 · Minor
- Est. fire insurance / yr
- $963 – $1,789
Heat risk 7/10 · Major
- Hot days now (above 107°F)
- 7 days/yr
- Hot days in 30 yrs
- 17 days/yr
Wind risk 6/10 · Moderate
- Chance of severe wind over 30 yrs
- 67.0%
Air-quality risk 2/10 · Minimal
- Unhealthy air days now
- 2 days/yr
- Unhealthy air days in 30 yrs
- 2 days/yr
Risk factors via First Street. Map © Google.
Why this score? — see what drove the D grade
The composite is a weighted blend of 9 inputs, each scored 0–100. Each bar is that input's sub-score; the figure is the points it added to the 100-point composite (weight × sub-score).
- Cash flow +16.8/30.0
- ARV discount +7.5/15.0
- DSCR +5.2/10.0
- 1% rule +3.6/10.0
- Livability +3.4/5.0
- Rent growth +2.5/5.0
- Condition / age +2.5/5.0
- Schools +1.9/10.0
- Appreciation +0.0/10.0
$159,000
🖨 Deal sheet (PDF) 📄 Offer letter ✓ Due diligence
Listing remarks MLS
This could be a stunning home. Situated on a beautiful corner lot on the main street in Sandersville with walking distance to the downtown square. Many of the rooms have had plaster removed and some has been completely gutted. NEW ROOF in 2022. Many nice architectural features. Spacious yard with a 20' x 31' outbuilding. This is a fixer-upper!
Key facts
- Spacious yard
- 20 x 31 outbuilding
- Corner lot
Tags
Neighborhood map
What this means for you Summary
Snapshot
- This is a 7-bed/2.0-bath single-family listed at $159k.
Deal economics
- At list price, monthly cash flow is $101 ($1k/yr) — positive.
- The deal already cash-flows at list — no discount required.
- To meet the 1% rule (rent ≥ 1% of price), the offer needs to be $138k (13.5% below list).
- Recommended offer: $138k (13.5% below list) — sets the bar for 1% rule.
- Cap rate 7.1% vs local median 3.8% in Sandersville — top-decile yield for the area; either an underpriced asset or a hidden risk that comps aren't pricing in. Stress-test before assuming the spread holds.
Location & tenants
- Location reads 68/100 on livability (#146 in GA) — a middle-class / working-renter tenant base. Strengths: cost of living A+, housing A+, health & safety A-; Watch: crime C-, amenities F, commute F.
- Washington County (town): math 24% / reading 21% proficiency, ranked #138 of 174 in GA (top 79%) — low school quality limits family demand, transient renter base, plan for 1-2y turnover; 65% free/reduced lunch — lower-income household profile, screen leases tightly.
- Zoned schools: Ridge Road Primary School (646 students, 96% FRL); T. J. Elder Middle School (math 16% / reading 23%, grade F, #356 of 470 statewide, top 78%, 662 students, 78% FRL); Washington County High School (math 17% / reading 17%, grade F, #277 of 424 statewide, top 67%, 896 students, 78% FRL) — zoned schools average 84% FRL vs 65% district-wide (19 pts higher); higher-poverty schools than district average — tighter screening recommended.
- Market conditions: 47 active listings in the ZIP; 66 units permitted in Washington County in 2024 (0 in 5+ unit buildings).
Forward outlook
- Local home prices are declining (-3.0%/yr); year-one equity from $1k of loan paydown is wiped out by about $5k of value loss. Plan a longer hold.
- Washington County population projected at -19% by 2050 — secular population decline; favor cash flow + early exit over multi-decade hold.
Negotiation context
- It's been on market 299 days — a 12% lower offer ($140k) is reasonable based on typical stale-listing flexibility.
- 2 sale attempts with the ask held roughly flat each time — persistent listings suggest the price (not the market) is what's stuck; bring a comps-based counter.
- Current owner paid $52k; list at $159k implies a 206% gain — meaningful room to come down on a strong offer.
Risks & watch-outs
- Watch-outs: built in 1940 — expect roof / HVAC / electrical / plumbing capex.
- Climate carrying-cost: major wind risk, 67% chance of damaging wind over 30y; extreme-heat days projected 7→17/yr by 2055 (HVAC capex compounding) — expect insurance premiums to compound above CPI over the hold.
Questions for the listing agent
- It's been on market 299 days. Have you received any prior offers? Is the seller open to a 14% concession, seller financing, or rate buy-down credit?
- Built in 1940 — when were the roof, HVAC, electrical panel, plumbing, and water heater last replaced?
- Why hasn't it sold? Are there any deal-killer items the seller is aware of (foundation, flood, title, zoning, code violations)?
- Is there a deadline driving the sale (1031 exchange, divorce, estate, relocation)? That informs how much negotiation room exists.
- Schools are F-rated, which usually means shorter tenancies and higher turnover. Who's the typical renter profile here, and what's been the actual vacancy rate?
- The area grade is low — what's the realistic commute time and amenity access for the typical tenant pool here? Any planned neighborhood developments (good or bad) we should know about?
- What's the average days-on-market for RENTAL listings here right now (not sales)? A rising rental-DOM trend means longer vacancies and softer asking-rent achievability than the comps imply.
- What's the recent tenant-quality profile in this submarket — average credit score on applications, eviction rate, late-payment / NSF rate, and stable-employment percentage? A property-management company in the area should have these aggregated.
- How much new for-sale + rental construction is in the pipeline within 1–3 miles? Heavy new supply typically softens prices + rents 12–24 months out; constrained supply supports both.
Investment metrics
- 1% rule
- 0.86% ✗
- Cap rate
- 7.05%
- Cash-on-cash
- 2.72%
- DSCR
- 1.12
- GRM
- 9.6
CMA / ARV
No comps found within radius.
Projected returns pro-forma
-3.0% appreciation · 3.0% rent growth · sell at horizon
- IRR
- -12.0%
- Equity multiple
- 0.56×
- Total profit
- $-19,393
- Equity at exit
- $23,707
- IRR
- -3.0%
- Equity multiple
- 0.80×
- Total profit
- $-8,819
- Equity at exit
- $13,747
Cash invested: $44,520 (down + closing). Projections, not guarantees.
Landlord ↔ Tenant lean methodology
- Overall (STATE)
- 90 Strongly Landlord-Friendly
- State Georgia
- 90 Strongly Landlord-Friendly · R+3
- County
- — inherits STATE
- City
- — inherits STATE
ZIP-level market 31082
- Home prices YoY
- -20.6%
- Active inventory
- 47
- Price-to-rent
- 9.6×
Monthly cashflow live
- Estimated rent
- $1,375 medium interval (Pro) →
- Mortgage (P&I)
- −$834
- Tax from tax record
- −$86 /mo · $1,027/yr
- Insurance
- −$66
- HOA
- −$0
- Vacancy / Maint / Mgmt
- −$289
- Net cashflow
- $101
Break-even live
Sensitivity live
| Price | -10% $191 | -5% $146 | +0% $101 | +5% $56 | +10% $11 |
|---|---|---|---|---|---|
| Rent | -10% $-8 | -5% $46 | +0% $101 | +5% $155 | +10% $209 |
| Rate | -1.0pp $181 | -0.5pp $141 | base $101 | +0.5pp $60 | +1.0pp $18 |
UW: 25.0% down · 7.5% · 30yr · 1.5% tax · 5.0% vac · 8.0% maint · 8.0% mgmt
Financing live
Cash to close
- Down payment
- $39,750
- Closing costs
- $4,770
- Reserves months
- —
- Total cash needed
- —
Loan-product check · same deal, 3 products live
Conventional
25% down · 7.5% · 30yr
- Down + closing
- —
- Monthly P&I
- —
- Monthly cashflow
- —
- DSCR
- —
- Eligible?
- —
Personal DTI + credit; lowest rate.
DSCR
20% down · 8.5% · 30yr
- Down + closing
- —
- Monthly P&I
- —
- Monthly cashflow
- —
- DSCR
- —
- Eligible?
- —
No personal income docs; deal must DSCR.
Hard money
10% down · 12.0% · 12mo
- Down + closing
- —
- Monthly P&I
- —
- Monthly cashflow
- —
- DSCR
- —
- Eligible?
- —
Short-term bridge; refi at stabilization.
Listing history 22 events
-
2026-06-21days on market $159,000 Active 299 DOM
-
2026-06-19days on market $159,000 Active 297 DOM
-
2026-06-18days on market $159,000 Active 296 DOM
-
2026-06-17days on market $159,000 Active 295 DOM
-
2026-06-16days on market $159,000 Active 294 DOM
-
2026-06-15days on market $159,000 Active 293 DOM
-
2026-06-14days on market $159,000 Active 291 DOM
-
2026-06-12days on market $159,000 Active 290 DOM
-
2026-06-09days on market $159,000 Active 287 DOM
-
2026-06-08days on market $159,000 Active 286 DOM
-
2026-06-07days on market $159,000 Active 285 DOM
-
2026-06-03days on market $159,000 Active 281 DOM
-
2026-06-02days on market $159,000 Active 280 DOM
-
2026-06-01days on market $159,000 Active 279 DOM
-
2026-05-31days on market $159,000 Active 278 DOM
-
2026-05-30days on market $159,000 Active 277 DOM
-
2026-04-20status Back On Market 348-char remark
Show marketing remark (348 chars)
This could be a stunning home. Situated on a beautiful corner lot on the main street in Sandersville with walking distance to the downtown square. Many of the rooms have had plaster removed and some has been completely gutted. NEW ROOF in 2022. Many nice architectural features. Spacious yard with a 20' x 31' outbuilding. This is a fixer-upper!
-
2026-04-15historical 348-char remark
Show marketing remark (348 chars)
This could be a stunning home. Situated on a beautiful corner lot on the main street in Sandersville with walking distance to the downtown square. Many of the rooms have had plaster removed and some has been completely gutted. NEW ROOF in 2022. Many nice architectural features. Spacious yard with a 20' x 31' outbuilding. This is a fixer-upper!
-
2026-01-15price $159,000 348-char remark
Show marketing remark (348 chars)
This could be a stunning home. Situated on a beautiful corner lot on the main street in Sandersville with walking distance to the downtown square. Many of the rooms have had plaster removed and some has been completely gutted. NEW ROOF in 2022. Many nice architectural features. Spacious yard with a 20' x 31' outbuilding. This is a fixer-upper!
-
2025-07-16$165,000 New 348-char remark
Show marketing remark (348 chars)
This could be a stunning home. Situated on a beautiful corner lot on the main street in Sandersville with walking distance to the downtown square. Many of the rooms have had plaster removed and some has been completely gutted. NEW ROOF in 2022. Many nice architectural features. Spacious yard with a 20' x 31' outbuilding. This is a fixer-upper!
-
2020-09-08soldstatus $52,000
-
2020-09-05soldstatus $52,000 773-char remark
Show marketing remark (773 chars)
A sprawling wrap-around porch welcomes you to this "Diamond in the Rough." Fixing up an old house is such a rewarding project!! Located on historic "Silk Stocking Street" in Sandersville, Georgia, this 100+ year old home is just waiting to be brought back to life. If you're looking to polish up an old gem, take a look at this home that is priced right and full of potential. Lots of natural light, a nice wood staircase, historic mantels, hardwood floors, large lot and a barn. Both downstairs and upstairs have 6 large rooms and a wide hallway. Parts have been gutted and the plaster on many rooms has been removed. Just a short walk to the beautiful Brown House Museum and downtown Sandersville. Make this home and its rocking chair porch....YOURS!
ⓘ Source: listings_history table (triggers on properties + properties_extension) + one-shot
backfill from property_details.listing_events for pre-trigger history.
Tax reassessment forecast GA · Resets to sale price
- Current annual tax
- $1,027 · $86/mo
- Projected year-2 tax
- $1,463 · $122/mo
- Expected delta
- +$436/yr (+$36/mo · 42.5%)
ⓘ Screening estimate from a state-policy table — verify with the county assessor before closing.
Climate risk First Street
- Flood 1/10 Low FEMA zone X (unshaded) · 0% chance over 30 yrs
- Wildfire 3/10 Moderate
- Heat 7/10 Severe 7 d/yr ≥107°F today · 17 d/yr by 30 yrs out
- Wind 6/10 Major 67% chance of damaging wind over 30 yrs
- Air quality 2/10 Low 2 unhealthy d/yr today · 2 by 30 yrs out
Nearby sold comps map
Loading sold comps map…
Walkable amenities ~0.75 mi
Loading nearby amenities…
Taxation est. · year 1
- Rental income
- $16,503
- − Mortgage interest
- −$8,906
- − Property taxes
- −$1,027
- − Insurance
- −$795
- − Repairs & maintenance
- −$1,320
- − Management
- −$1,320
- − Depreciation
- −$4,625
- Taxable loss
- −$1,491
- Est. tax savings @ 24.0%
- +$358
- After-tax cash flow
- $1,568/yr
For passive investors: Depreciation is non-cash, so a rental often shows a tax loss while cash-flowing — sheltering income. Rental losses are passive: they offset passive income freely, and up to $25,000/yr can offset ordinary (W-2) income if you actively participate and your MAGI is under $100k (phasing out to $0 by $150k); unused losses carry forward. On sale, claimed depreciation is recaptured at up to 25%, and gains may owe capital-gains tax (a 1031 exchange can defer both). Figures are a year-1 estimate at your 24.0% rate — not tax advice; consult a CPA.
Schools (NCES district)
- District
- Washington County
- NCES district ID
- 1305490
- Math proficiency
- 24% ▼ -8.00%
- Reading proficiency
- 21% ▼ -9.00%
- Median HH income
- $34,464
- Composite
- 18.52/100
- National rank
- #8916
- State rank
- #138 of 174 in GA
Livability — Sandersville
- Score
- 68/100
- State rank
- #146
- US rank
- #9735
Category grades
Schools grade is shown separately in the Schools card above.
Census & demographics
- Census place
- Sandersville, GA
- Population (ZIP)
- 10,479
Population outlook (Washington County) Hauer SSP2
- Today (2025)
- 20,052 people
- By 2030
- 19,417 · -3.2%
- By 2040
- 17,900 · -10.7%
- By 2050
- 16,237 · -19.0%
- By 2075
- 12,990 · -35.2%
- By 2100
- 9,709 · -51.6%
Race, ethnicity, and origin ACS 2023
- Neighborhood character
- Diverse neighborhood (Simpson 0.58)
- Race & ethnicity
- Black 47% White 45% Two or more races 5% Hispanic / Latino 2%
- Common ancestry
- Italian 1% Serbian 1% Lithuanian 1%
- Foreign-born
- 2% · Canada
- Languages at home
- 97% English-only · Spanish 2% Other Indo-European 1%
Political lean MEDSL · Washington
- 2024 margin
- Toss-up / Even · D 48.9% · R 50.8%
- 2008→2024 swing
- -6.3pp toward R · 2008: 4.4pp · 2024: -1.9pp
- All cycles
- 2024: R+1.9 2020: D+0.8 2016: D+0.6 2012: D+7.6 2008: D+4.4
Not yet ingested
- Civics
- —
Market trends
- HPI YoY
- ▼ -44.38%
- Current HPI
- 171.5216
- Rent YoY
- —
- Metro
- —
- State GDP YoY
- ▲ 2.66%
- F500 in state
- 28
Industry mix (Fortune 500 HQ in GA)
| Industry | F500 HQs | Revenue |
|---|---|---|
| Paper / Packaging | 2 | $29B |
|
||
| Retail | 1 | $160B |
|
||
| Transportation / Logistics | 1 | $91B |
|
||
| Airlines | 1 | $62B |
|
||
| Consumer Goods | 1 | $47B |
|
||
| Utilities | 1 | $25B |
|
||
Price history
+205.8% since first listed6 events — show timeline
- 2026-04-20 Relisted — GAMLS
- 2026-04-15 Listing Removed — GAMLS
- 2026-01-15 Price Changed $159,000 GAMLS
- 2025-07-16 Listed $165,000 GAMLS
- 2020-09-08 Sold (Public Records) $52,000 Public Records
- 2020-09-05 Sold (MLS) $52,000 GAMLS
Property tax history
+0.9%/yrLatest (2025): $1,027 · -0.3% YoY. Source: county tax records.
Cash-flow waterfall
monthlySold comps — $/sqft
last 12 mo · ≤1 miLoading sold comps…