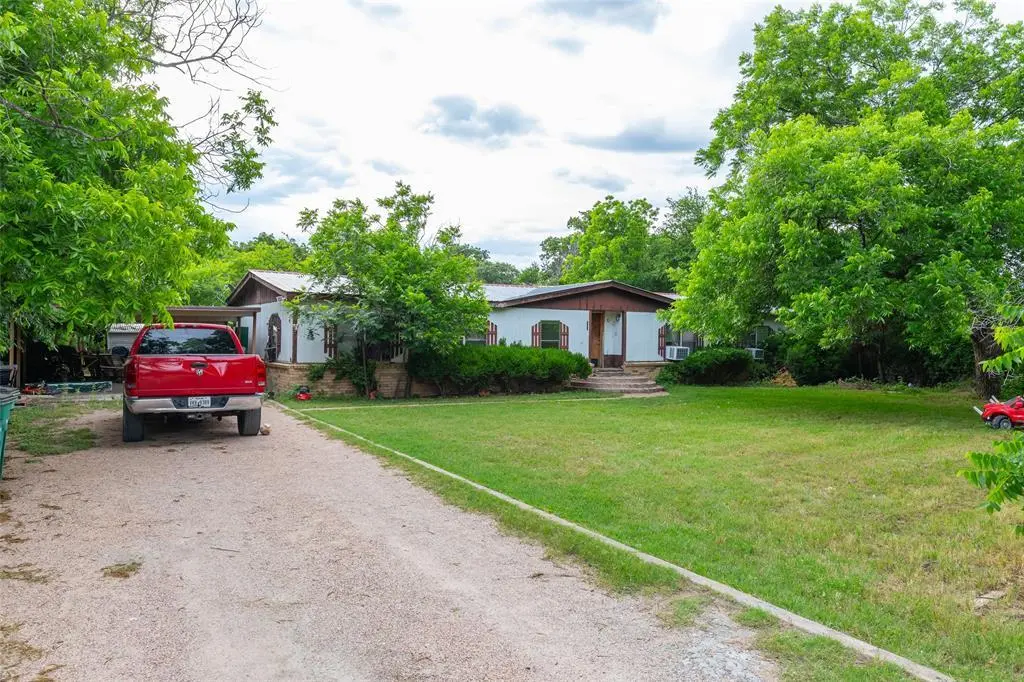
509 Rusk St · Clyde, TX
Flood risk No data
- FEMA flood zone
- —
- Chance of flooding over 30 yrs
- —
- Est. flood insurance / yr
- —
Fire risk No data
- Est. fire insurance / yr
- —
Heat risk No data
- Hot days now (above threshold)
- —
- Hot days in 30 yrs
- —
Wind risk No data
- Chance of severe wind over 30 yrs
- —
Air-quality risk No data
- Unhealthy air days now
- —
- Unhealthy air days in 30 yrs
- —
Risk factors via First Street. Map © Google.
Why this score? — see what drove the B- grade
The composite is a weighted blend of 9 inputs, each scored 0–100. Each bar is that input's sub-score; the figure is the points it added to the 100-point composite (weight × sub-score).
- Cash flow +30.0/30.0
- 1% rule +10.0/10.0
- DSCR +10.0/10.0
- ARV discount +7.5/15.0
- Schools +3.6/10.0
- Livability +3.4/5.0
- Rent growth +2.5/5.0
- Condition / age +2.5/5.0
- Appreciation +0.0/10.0
$59,900
🖨 Deal sheet 📄 Offer letter ✓ Due diligence
Key facts
- 0.35 acre lot
- 2 parking spots
- Built 1981
Property features AI
Finance
- Other: Property listed for sale; Possession at closing/funding
- Financial info: Listing terms: Cash or Conventional; No second mortgage
- HOA & community: No association
Exterior
- Parking: Covered carport with 2 spaces
- Utilities: City water; City sewer; Cable available
- Home design: Single-family residence; Residential property; Single story
- Construction: Built in 1981; Metal siding; Metal roof; Pillar/post/pier foundation
- Exterior features: Wood fencing; Lot less than 0.5 acre (about 0.35 acre)
Interior
- Kitchen: Dishwasher; Garbage disposal; Electric cooktop; Double oven
- Bedrooms: 3 bedrooms (primary bedroom on level 1)
- Flooring: Carpet; Vinyl
- Bathrooms: 2 full bathrooms
- Heating & cooling: Ceiling fan(s); Wall/window unit(s)
- Interior features: Cable TV available; High-speed internet available; One living area; One dining area; One level (single story)
- Laundry & utility: Full-size washer/dryer area
Neighborhood map
What this means for you Summary
Snapshot
- This is a 3-bed/2.0-bath manufactured listed at $60k.
Deal economics
- At list price, monthly cash flow is $721 ($9k/yr) — positive.
- The deal already cash-flows at list — no discount required.
- Meets the 1% rule at list price ($1k rent vs $60k).
- Recommended offer: $58k (3.0% below list) — sets the bar for market timing.
- Cap rate 20.7% vs local median 3.2% in Clyde — top-decile yield for the area; either an underpriced asset or a hidden risk that comps aren't pricing in. Stress-test before assuming the spread holds.
Location & tenants
- Location reads 68/100 on livability (#498 in TX) — a middle-class / working-renter tenant base. Strengths: crime A+, cost of living A+, housing A+; Watch: employment C-, health & safety D+, amenities F.
- Clyde CISD (town): math 42% / reading 42% proficiency, ranked #341 of 826 in TX (top 41%) — families likely to look elsewhere, expect single-tenant / working-renter base with shorter leases.
- Zoned schools: Clyde El (366 students, 58% FRL).
- Market conditions: 132 active listings in the ZIP; 11 units permitted in Callahan County in 2024 (0 in 5+ unit buildings).
Forward outlook
- Local home prices are declining (-3.0%/yr); year-one equity from $414 of loan paydown is wiped out by about $2k of value loss. Plan a longer hold.
- Callahan County population projected to shrink 5% by 2050 — rents likely to lag national; underwrite the cash flow, not the appreciation.
- At projected returns (-3.0% appreciation + 3.0% rent growth), your $17k cash investment doubles in ~3 years — after that, you're playing with house money.
Negotiation context
- It's been on market 34 days — a 3% lower offer ($58k) is reasonable based on typical stale-listing flexibility.
Questions for the listing agent
- It's been on market 34 days. Have you received any prior offers? Is the seller open to a 3% concession, seller financing, or rate buy-down credit?
- Is there a deadline driving the sale (1031 exchange, divorce, estate, relocation)? That informs how much negotiation room exists.
- What's the average days-on-market for RENTAL listings here right now (not sales)? A rising rental-DOM trend means longer vacancies and softer asking-rent achievability than the comps imply.
- What's the recent tenant-quality profile in this submarket — average credit score on applications, eviction rate, late-payment / NSF rate, and stable-employment percentage? A property-management company in the area should have these aggregated.
- How much new for-sale + rental construction is in the pipeline within 1–3 miles? Heavy new supply typically softens prices + rents 12–24 months out; constrained supply supports both.
Investment metrics
- 1% rule
- 2.39% ✓
- Cap rate
- 20.74%
- Cash-on-cash
- 51.59%
- DSCR
- 3.30
- GRM
- 3.5
CMA / ARV
No comps found within radius.
Projected returns pro-forma
-3.0% appreciation · 3.0% rent growth · sell at horizon
- IRR
- 49.5%
- Equity multiple
- 3.16×
- Total profit
- $36,239
- Equity at exit
- $8,931
- IRR
- 55.0%
- Equity multiple
- 6.41×
- Total profit
- $90,768
- Equity at exit
- $5,179
Cash invested: $16,772 (down + closing). Projections, not guarantees.
Landlord ↔ Tenant lean methodology
- Overall (STATE)
- 87 Strongly Landlord-Friendly
- State Texas
- 87 Strongly Landlord-Friendly · R+5
- County
- — inherits STATE
- City
- — inherits STATE
ZIP-level market 79510
- Home prices YoY
- -21.6%
- Active inventory
- 132
- Price-to-rent
- 3.5×
Monthly cashflow live
- Estimated rent
- $1,430 medium interval (Pro) →
- Mortgage (P&I)
- −$314
- Tax from tax record
- −$69 /mo · $833/yr
- Insurance
- −$25
- HOA
- −$0
- Vacancy / Maint / Mgmt
- −$300
- Net cashflow
- $721
Break-even live
UW: 25.0% down · 7.5% · 30yr · 1.5% tax · 5.0% vac · 8.0% maint · 8.0% mgmt
Financing live
Cash to close
- Down payment
- $14,975
- Closing costs
- $1,797
- Reserves months
- —
- Total cash needed
- —
Loan-product check · same deal, 3 products live
Conventional
25% down · 7.5% · 30yr
- Down + closing
- —
- Monthly P&I
- —
- Monthly cashflow
- —
- DSCR
- —
- Eligible?
- —
Personal DTI + credit; lowest rate.
DSCR
20% down · 8.5% · 30yr
- Down + closing
- —
- Monthly P&I
- —
- Monthly cashflow
- —
- DSCR
- —
- Eligible?
- —
No personal income docs; deal must DSCR.
Hard money
10% down · 12.0% · 12mo
- Down + closing
- —
- Monthly P&I
- —
- Monthly cashflow
- —
- DSCR
- —
- Eligible?
- —
Short-term bridge; refi at stabilization.
Listing history 17 events
-
2026-06-19days on market $59,900 Active 34 DOM
-
2026-06-18days on market $59,900 Active 33 DOM
-
2026-06-17days on market $59,900 Active 32 DOM
-
2026-06-16days on market $59,900 Active 31 DOM
-
2026-06-15days on market $59,900 Active 30 DOM
-
2026-06-14days on market $59,900 Active 28 DOM
-
2026-06-13days on market $59,900 Active 27 DOM
-
2026-06-10days on market $59,900 Active 25 DOM
-
2026-06-09days on market $59,900 Active 24 DOM
-
2026-06-08days on market $59,900 Active 23 DOM
-
2026-06-07days on market $59,900 Active 22 DOM
-
2026-06-02days on market $59,900 Active 17 DOM
-
2026-06-01days on market $59,900 Active 16 DOM
-
2026-05-31days on market $59,900 Active 15 DOM
-
2026-05-30days on market $59,900 Active 14 DOM
-
2026-05-12$69,900 Active
-
2012-07-09soldstatus
ⓘ Source: listings_history table (triggers on properties + properties_extension) + one-shot
backfill from property_details.listing_events for pre-trigger history.
Tax reassessment forecast TX · Resets to sale price
- Current annual tax
- $833 · $69/mo
- Projected year-2 tax
- $1,096 · $91/mo
- Expected delta
- +$263/yr (+$22/mo · 31.6%)
ⓘ Screening estimate from a state-policy table — verify with the county assessor before closing.
Nearby sold comps map
Loading sold comps map…
Walkable amenities ~0.75 mi
Loading nearby amenities…
Taxation est. · year 1
- Rental income
- $17,158
- − Mortgage interest
- −$3,355
- − Property taxes
- −$833
- − Insurance
- −$300
- − Repairs & maintenance
- −$1,373
- − Management
- −$1,373
- − Depreciation
- −$1,743
- Taxable income
- $8,183
- Est. tax owed @ 24.0%
- −$1,964
- After-tax cash flow
- $6,689/yr
For passive investors: Depreciation is non-cash, so a rental often shows a tax loss while cash-flowing — sheltering income. Rental losses are passive: they offset passive income freely, and up to $25,000/yr can offset ordinary (W-2) income if you actively participate and your MAGI is under $100k (phasing out to $0 by $150k); unused losses carry forward. On sale, claimed depreciation is recaptured at up to 25%, and gains may owe capital-gains tax (a 1031 exchange can defer both). Figures are a year-1 estimate at your 24.0% rate — not tax advice; consult a CPA.
Schools (NCES district)
- District
- Clyde CISD
- NCES district ID
- 4814450
- Math proficiency
- 42% ▼ -7.00%
- Reading proficiency
- 42% ▼ -2.00%
- Median HH income
- $46,614
- Composite
- 35.84/100
- National rank
- #4824
- State rank
- #341 of 826 in TX
Livability — Clyde
- Score
- 68/100
- State rank
- #498
- US rank
- #9935
Category grades
Schools grade is shown separately in the Schools card above.
Census & demographics
- Census place
- Clyde, TX
- Population (ZIP)
- 8,135
Population outlook (Callahan County) Hauer SSP2
- Today (2025)
- 13,664 people
- By 2030
- 13,578 · -0.6%
- By 2040
- 13,283 · -2.8%
- By 2050
- 13,008 · -4.8%
- By 2075
- 12,354 · -9.6%
- By 2100
- 11,326 · -17.1%
Race, ethnicity, and origin ACS 2023
- Neighborhood character
- Predominantly White (79%)
- Race & ethnicity
- White 79% Hispanic / Latino 13% Two or more races 12% Black 2%
- Hispanic origin (detail)
- Mexican 13%
- Common ancestry
- Italian 8% Slovak 3% Serbian 3%
- Foreign-born
- 1% · China
- Languages at home
- 93% English-only · Spanish 5% German/W. Germanic 2%
Political lean MEDSL · Callahan
- 2024 margin
- Solid R (+77.6) · D 10.9% · R 88.5%
- 2008→2024 swing
- -15.9pp toward R · 2008: -61.7pp · 2024: -77.6pp
- All cycles
- 2024: R+77.6 2020: R+77.3 2016: R+77.2 2012: R+69.8 2008: R+61.7
Not yet ingested
- Civics
- —
Market trends
- HPI YoY
- ▼ -51.42%
- Current HPI
- 186.6326
- Rent YoY
- —
- Metro
- —
- State GDP YoY
- ▲ 3.95%
- F500 in state
- 110
Industry mix (Fortune 500 HQ in TX)
| Industry | F500 HQs | Revenue |
|---|---|---|
| Energy | 16 | $1,198B |
|
||
| Technology | 5 | $198B |
|
||
| Engineering / Construction | 4 | $72B |
|
||
| Energy Services | 3 | $60B |
|
||
| Utilities | 3 | $41B |
|
||
| Healthcare | 2 | $330B |
|
||
Price history
2 events — show timeline
- 2026-05-12 Listed $69,900 NTREIS
- 2012-07-09 Sold (Public Records) — Public Records
Property tax history
+5.2%/yrLatest (2025): $833 · -5.8% YoY. Source: county tax records.
Cash-flow waterfall
monthlySold comps — $/sqft
last 12 mo · ≤1 miLoading sold comps…