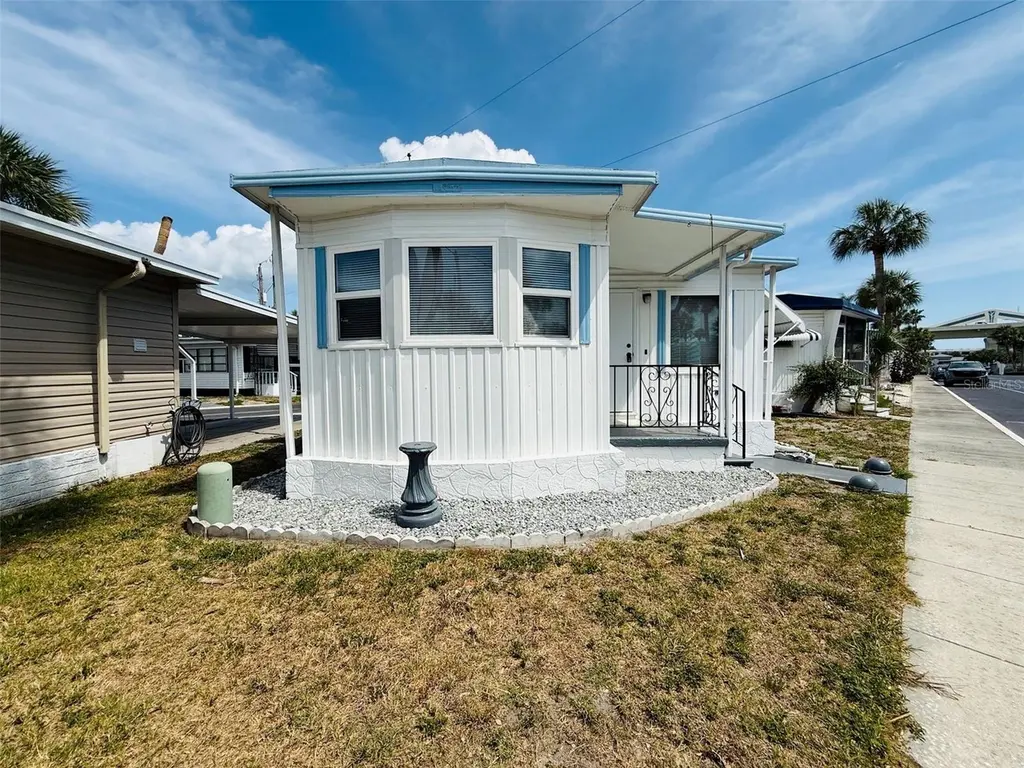
4851 W Gandy Blvd Unit B7L13 · Tampa, FL
Flood risk 10/10 · Severe
- FEMA flood zone
- AE
- Chance of flooding over 30 yrs
- 0.99%
- Est. flood insurance / yr
- $1,737 – $8,500
Fire risk 1/10 · Minimal
- Est. fire insurance / yr
- $947 – $1,759
Heat risk 10/10 · Severe
- Hot days now (above 107°F)
- 7 days/yr
- Hot days in 30 yrs
- 29 days/yr
Wind risk 10/10 · Severe
- Chance of severe wind over 30 yrs
- 99.0%
Air-quality risk 4/10 · Minor
- Unhealthy air days now
- 4 days/yr
- Unhealthy air days in 30 yrs
- 4 days/yr
Risk factors via First Street. Map © Google.
Why this score? — see what drove the B grade
The composite is a weighted blend of 9 inputs, each scored 0–100. Each bar is that input's sub-score; the figure is the points it added to the 100-point composite (weight × sub-score).
- Cash flow +30.0/30.0
- 1% rule +10.0/10.0
- DSCR +10.0/10.0
- ARV discount +7.5/15.0
- Schools +4.2/10.0
- Livability +4.0/5.0
- Rent growth +2.7/5.0
- Condition / age +2.5/5.0
- Appreciation +0.0/10.0
$88,000
🖨 Deal sheet 📄 Offer letter ✓ Due diligence
Listing remarks
Under contract-accepting backup offers. Ready for Florida Living? Welcome to this lovely rental home in a beautiful 55+ community filled with amenities, including a gated entrance, clubhouse, swimming pool, shuffleboard, spacious common gathering areas, community events, and stunning sunsets! Lovely, lovely, lovely—it truly bears repeating. This charming new listing is ready to rent and offers thoughtful updates throughout, from the contemporary flooring to the beautifully detailed kitchen with stainless steel appliances. You’ll also appreciate the enclosed washer and dryer area and the convenient hidden carport located at the back of the home. This one is full of Florida
Key facts
- Clubhouse
- Gated entrance
- Swimming pool
Tags
Property features AI
Finance
- Financial info: Lease restrictions apply; Total annual fees $4,560; Total monthly fees $380
- HOA & community: Part of Regency Cove cooperative; Monthly association fee $380 (required); Association approval required; Senior community; Community amenities: fitness center, pool, golf carts allowed; Pets not allowed
Exterior
- Parking: Carport (1 space)
- Utilities: Public water; Public sewer; Cable available
- Home design: Residential mobile home; Double wide; Single-story; East-facing
- Construction: Metal siding and frame construction; Metal roof; Foundation information not provided
- Exterior features: Awnings; Rain gutters; Asphalt road access
Interior
- Kitchen: Range; Refrigerator
- Bedrooms: 1 bedroom
- Flooring: Vinyl
- Bathrooms: 1 full bathroom
- Heating & cooling: Central heating (electric); Central air conditioning
- Interior features: Ceiling fans
- Laundry & utility: Indoor laundry
Neighborhood map
What this means for you Summary
Snapshot
- This is a 2-bed/1.0-bath condo listed at $88k.
Deal economics
- At list price, monthly cash flow is $314 ($4k/yr) — positive.
- The deal already cash-flows at list — no discount required.
- Meets the 1% rule at list price ($2k rent vs $88k).
- Recommended offer: $87k (1.5% below list) — sets the bar for market timing.
Location & tenants
- Location reads 79/100 on livability (#142 in FL, #2,135 nationally) — a middle-class / working-renter tenant base. Strengths: commute A+, housing A+, health & safety A+; Watch: schools C-, crime D+.
- Hillsborough (suburban): math 47% / reading 50% proficiency, ranked #41 of 73 in FL (top 56%) — families likely to look elsewhere, expect single-tenant / working-renter base with shorter leases.
- Market conditions: Rents flat; 416 active listings in the ZIP; 14 comparable units currently listed for rent nearby; rentals leasing fast (median 3d on market — plan ~1-2 weeks tenant-placement turnaround); solid renter incomes; 9,053 units permitted in Hillsborough County in 2024 (4,555 in 5+ unit buildings).
Forward outlook
- Local home prices are declining (-3.0%/yr); year-one equity from $608 of loan paydown is wiped out by about $3k of value loss. Plan a longer hold.
- Hillsborough County population projected at +37% by 2050 — long-run rental-demand tailwind backs the buy-and-hold thesis.
Negotiation context
- It's been on market 27 days — a 2% lower offer ($87k) is reasonable based on typical stale-listing flexibility.
Risks & watch-outs
- Watch-outs: flood insurance adds $427/mo.
- Climate carrying-cost: in FEMA flood zone AE (mandatory federal flood insurance); severe wind risk, 99% chance of damaging wind over 30y; extreme-heat days projected 7→29/yr by 2055 (HVAC capex compounding) — expect insurance premiums to compound above CPI over the hold.
Questions for the listing agent
- Built in 1970 — when were the roof, HVAC, electrical panel, plumbing, and water heater last replaced?
- What's the actual annual flood-insurance premium (NFIP or private), and is the property in a SFHA with mandatory coverage?
- What does the HOA fee cover, when was the last increase, and are there any pending special assessments or reserve-fund shortfalls?
- Any open or pending special assessments — roof, HVAC, plumbing, elevator, façade? What's the per-unit balance and payoff schedule, and is the seller paying it off at close or rolling it to the buyer?
- Is there a deadline driving the sale (1031 exchange, divorce, estate, relocation)? That informs how much negotiation room exists.
- Crime grade is D in this area — have there been break-ins, vandalism, or insurance claims at this property in the last 3 years? What carrier currently insures it and at what premium?
- What's the average days-on-market for RENTAL listings here right now (not sales)? A rising rental-DOM trend means longer vacancies and softer asking-rent achievability than the comps imply.
- What's the recent tenant-quality profile in this submarket — average credit score on applications, eviction rate, late-payment / NSF rate, and stable-employment percentage? A property-management company in the area should have these aggregated.
- How much new apartment / multifamily construction is in the pipeline within 1–3 miles? Heavy new supply (>2% of stock underway) typically softens rents 12–24 months out; light construction supports rent growth.
Investment metrics
- 1% rule
- 2.47% ✓
- Cap rate
- 16.39%
- Cash-on-cash
- 36.04%
- DSCR
- 2.60
- GRM
- 3.4
CMA / ARV
No comps found within radius.
Projected returns pro-forma
-3.0% appreciation · 0.69% rent growth · sell at horizon
- IRR
- 1.4%
- Equity multiple
- 1.05×
- Total profit
- $1,286
- Equity at exit
- $13,121
- IRR
- 6.4%
- Equity multiple
- 1.39×
- Total profit
- $9,578
- Equity at exit
- $7,609
Cash invested: $24,640 (down + closing). Projections, not guarantees.
Landlord ↔ Tenant lean methodology
- Overall (STATE)
- 87 Strongly Landlord-Friendly
- State Florida
- 87 Strongly Landlord-Friendly · R+3
- County
- — inherits STATE
- City
- — inherits STATE
ZIP-level market 33611
- Rents YoY
- 0.7%
- Active inventory
- 416
- Price-to-rent
- 3.4×
Monthly cashflow live
- Estimated rent
- $2,178 high interval (Pro) →
- Mortgage (P&I)
- −$461
- Tax from tax record
- −$102 /mo · $1,226/yr
- Insurance
- −$37
- Flood insurance flood zone
- −$427 /mo · $5,118/yr
- HOA
- −$380
- Vacancy / Maint / Mgmt
- −$457
- Net cashflow
- $314
Break-even live
UW: 25.0% down · 7.5% · 30yr · 1.5% tax · 5.0% vac · 8.0% maint · 8.0% mgmt
Financing live
Cash to close
- Down payment
- $22,000
- Closing costs
- $2,640
- Reserves months
- —
- Total cash needed
- —
Loan-product check · same deal, 3 products live
Conventional
25% down · 7.5% · 30yr
- Down + closing
- —
- Monthly P&I
- —
- Monthly cashflow
- —
- DSCR
- —
- Eligible?
- —
Personal DTI + credit; lowest rate.
DSCR
20% down · 8.5% · 30yr
- Down + closing
- —
- Monthly P&I
- —
- Monthly cashflow
- —
- DSCR
- —
- Eligible?
- —
No personal income docs; deal must DSCR.
Hard money
10% down · 12.0% · 12mo
- Down + closing
- —
- Monthly P&I
- —
- Monthly cashflow
- —
- DSCR
- —
- Eligible?
- —
Short-term bridge; refi at stabilization.
Rent comps 14 comps
| Address | Beds | Baths | Sqft | Rent | $/sqft | DOM | Units | Dist |
|---|---|---|---|---|---|---|---|---|
| 5000 Culbreath Key Way Tampa, FL | 1.0–2.0 | 1.0–2.0 | 847 | $2,995 | $3.54 | 3d | 3 | 0.06mi |
| 4851 W Gandy Blvd Tampa, FL | 1.0–2.0 | 1.0–1.5 | 615 | $1,400 | $2.28 | 17d | 2 | 0.09mi |
| 4922 W Gandy Blvd #102 Tampa, FL | 1.0 | 1.0 | 595 | $1,450 | $2.44 | 12d | 1 | 0.16mi |
| 4800 S West Shore Blvd Tampa, FL | 1.0–2.0 | 1.0–2.0 | 801 | $2,256 | $2.82 | 2d | 18 | 0.20mi |
| 5001 Bridge St Tampa, FL | 3.0 | 1.0–2.0 | 1005 | $2,954 | $2.94 | 2d | 10 | 0.38mi |
| 5127 W Tyson Ave Tampa, FL | 3.0 | 1.0–2.5 | 1078 | $4,469 | $4.14 | 5d | 25 | 0.57mi |
| 5320 S West Shore Blvd Tampa, FL | 2.0 | 1.0–2.0 | 798 | $2,731 | $3.42 | 2d | 17 | 0.58mi |
| 4003 S West Shore Blvd Tampa, FL | 2.0 | 1.0–2.0 | 690 | $1,950 | $2.82 | 2d | 303 | 0.75mi |
| 5432 W Tyson Ave Tampa, FL | 1.0–2.0 | 1.0–2.0 | 911 | $3,653 | $4.01 | 2d | 51 | 0.92mi |
| 4002 S Manhattan Ave Tampa, FL | 1.0 | 1.0 | 650 | $1,524 | $2.34 | 3d | 3 | 1.05mi |
| 6207 S West Shore Blvd Tampa, FL | 3.0 | 1.0–2.0 | 1076 | $3,930 | $3.65 | 2d | 36 | 1.11mi |
| 5145 S Dale Mabry Hwy Tampa, FL | 3.0 | 1.0–2.0 | 1057 | $3,253 | $3.08 | 3d | 20 | 1.15mi |
| 5055 S Dale Mabry Hwy Tampa, FL | 2.0 | 1.0–2.0 | 797 | $2,000 | $2.51 | 3d | 28 | 1.24mi |
| 6301 S West Shore Blvd Tampa, FL | 2.0 | 1.0–2.0 | 687 | $1,979 | $2.88 | 2d | 33 | 1.31mi |
HOA detail condo
- Monthly dues
- $380 · $4,560/yr
- Likely covers
- poolsecurity
- Assessments
- None detected in remarks — confirm with the listing agent.
Listing history 5 events
-
2026-06-02remarks 687-char remark
-
2026-06-02status $88,000 Pending 27 DOM
-
2026-06-01days on market $88,000 Active 27 DOM
-
2026-05-31days on market $88,000 Active 26 DOM
-
2026-05-05$88,000 Active 695-char remark
ⓘ Source: listings_history table (triggers on properties + properties_extension) + one-shot
backfill from property_details.listing_events for pre-trigger history.
Tax reassessment forecast FL · Resets to sale price
- Current annual tax
- $1,226 · $102/mo
- Projected year-2 tax
- $1,226 · $102/mo
- Expected delta
- $0/yr ($0/mo · 0.0%)
ⓘ Screening estimate from a state-policy table — verify with the county assessor before closing.
Climate risk First Street
- Flood 10/10 Extreme FEMA zone AE · 99% chance over 30 yrs
- Wildfire 1/10 Low
- Heat 10/10 Extreme 7 d/yr ≥107°F today · 29 d/yr by 30 yrs out
- Wind 10/10 Extreme 99% chance of damaging wind over 30 yrs
- Air quality 4/10 Moderate 4 unhealthy d/yr today · 4 by 30 yrs out
Nearby sold comps map
Loading sold comps map…
Walkable amenities ~0.75 mi
Loading nearby amenities…
Taxation est. · year 1
- Rental income
- $26,133
- − Mortgage interest
- −$4,929
- − Property taxes
- −$1,226
- − Insurance
- −$5,558
- − Repairs & maintenance
- −$2,091
- − Management
- −$2,091
- − HOA
- −$4,560
- − Depreciation
- −$2,560
- Taxable income
- $3,118
- Est. tax owed @ 24.0%
- −$748
- After-tax cash flow
- $3,014/yr
For passive investors: Depreciation is non-cash, so a rental often shows a tax loss while cash-flowing — sheltering income. Rental losses are passive: they offset passive income freely, and up to $25,000/yr can offset ordinary (W-2) income if you actively participate and your MAGI is under $100k (phasing out to $0 by $150k); unused losses carry forward. On sale, claimed depreciation is recaptured at up to 25%, and gains may owe capital-gains tax (a 1031 exchange can defer both). Figures are a year-1 estimate at your 24.0% rate — not tax advice; consult a CPA.
Schools (NCES district)
- District
- Hillsborough
- NCES district ID
- 1200870
- Math proficiency
- 47% ▼ -8.00%
- Reading proficiency
- 50% ▼ -4.00%
- Median HH income
- $50,622
- Composite
- 41.6/100
- National rank
- #3435
- State rank
- #41 of 73 in FL
Livability — Tampa
- Score
- 79/100
- State rank
- #142
- US rank
- #2135
Category grades
Schools grade is shown separately in the Schools card above.
Census & demographics
- Census place
- Tampa, FL
- County
- Hillsborough County · 1,540,968 people
- City population
- 523,346
- Metro
- Tampa-St. Petersburg-Clearwater, FL
- Population (ZIP)
- 36,810
- Household income
- $90,910
- Rent vs Own
- Severe rent burden
- 1761.0
Population outlook (Hillsborough County) Hauer SSP2
- Today (2025)
- 1,607,022 people
- By 2030
- 1,733,968 · +7.9%
- By 2040
- 1,979,565 · +23.2%
- By 2050
- 2,203,427 · +37.1%
- By 2075
- 2,667,893 · +66.0%
- By 2100
- 2,891,558 · +79.9%
Race, ethnicity, and origin ACS 2023
- Neighborhood character
- Predominantly White (70%)
- Race & ethnicity
- White 70% Hispanic / Latino 14% Two or more races 12% Black 5% Asian 5%
- Hispanic origin (detail)
- Mexican 2% Puerto Rican 3% Cuban 4%
- Common ancestry
- Romanian 3% Slovak 2% Lithuanian 2%
- Foreign-born
- 12% · Canada, Vietnam, Jamaica
- Languages at home
- 85% English-only · Spanish 7% Other Indo-European 2% Vietnamese 1%
Political lean MEDSL · Hillsborough
- 2024 margin
- Toss-up / Even · D 47.8% · R 50.9% · Other 1.3%
- 2008→2024 swing
- -10.2pp toward R · 2008: 7.1pp · 2024: -3.1pp
- All cycles
- 2024: R+3.1 2020: D+6.9 2016: D+6.8 2012: D+6.7 2008: D+7.1
Not yet ingested
- Civics
- —
Market trends
- HPI YoY
- ▼ -328.23%
- Current HPI
- 374.7996
- Rent YoY
- ▲ 0.69%
- Metro
- Tampa-St. Petersburg-Clearwater, FL
- State GDP YoY
- ▲ 3.28%
- F500 in state
- 36
Industry mix (Fortune 500 HQ in FL)
| Industry | F500 HQs | Revenue |
|---|---|---|
| Industrial Technology | 2 | $29B |
|
||
| Insurance | 2 | $17B |
|
||
| Retail | 1 | $60B |
|
||
| Technology Distribution | 1 | $58B |
|
||
| Homebuilding | 1 | $35B |
|
||
| Technology Manufacturing | 1 | $35B |
|
||
Price history
2 events — show timeline
- 2026-06-01 Pending — Stellar MLS as Distributed by MLS Grid
- 2026-05-05 Listed $88,000 Stellar MLS as Distributed by MLS Grid
Property tax history
+6.1%/yrLatest (2025): $1,226 · +3.6% YoY. Source: county tax records.
Cash-flow waterfall
monthlySold comps — $/sqft
last 12 mo · ≤1 miLoading sold comps…