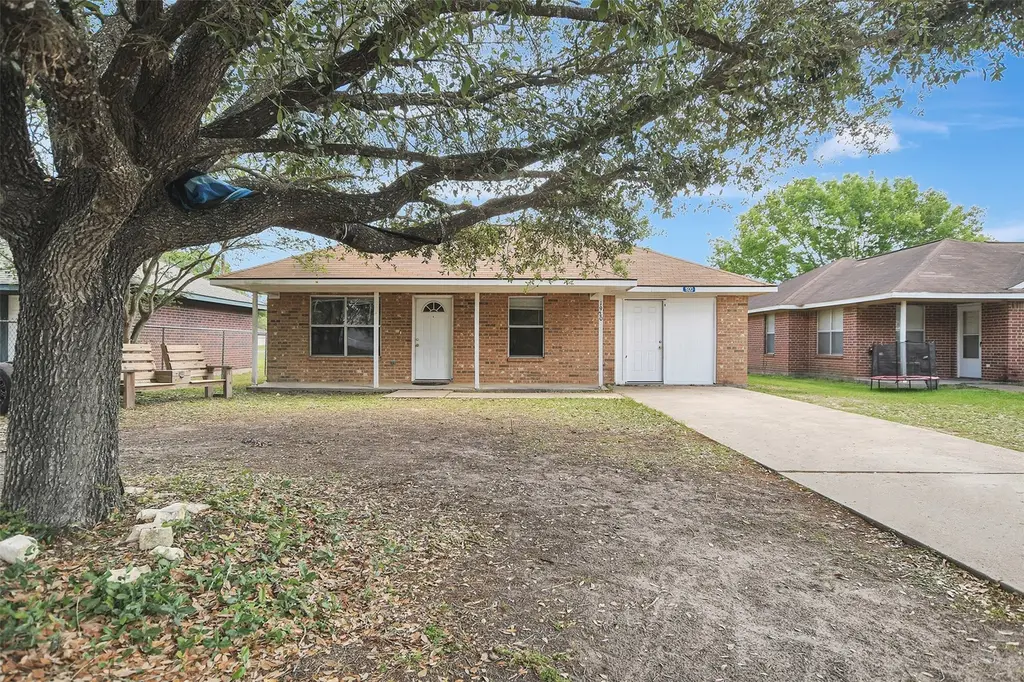
1920 6th St · Hempstead, TX
Flood risk 1/10 · Minimal
- FEMA flood zone
- X (unshaded)
- Chance of flooding over 30 yrs
- 0.0%
- Est. flood insurance / yr
- $507 – $1,088
Fire risk 3/10 · Minor
- Est. fire insurance / yr
- $1,222 – $2,270
Heat risk 9/10 · Severe
- Hot days now (above 111°F)
- 7 days/yr
- Hot days in 30 yrs
- 23 days/yr
Wind risk 8/10 · Major
- Chance of severe wind over 30 yrs
- 99.0%
Air-quality risk 2/10 · Minimal
- Unhealthy air days now
- 1 days/yr
- Unhealthy air days in 30 yrs
- 1 days/yr
Risk factors via First Street. Map © Google.
Why this score? — see what drove the D grade
The composite is a weighted blend of 9 inputs, each scored 0–100. Each bar is that input's sub-score; the figure is the points it added to the 100-point composite (weight × sub-score).
- ARV discount +13.3/15.0
- Appreciation +10.0/10.0
- Cash flow +6.1/30.0
- Livability +3.0/5.0
- Rent growth +2.5/5.0
- Condition / age +2.5/5.0
- 1% rule +2.0/10.0
- Schools +1.5/10.0
- DSCR +0.5/10.0
$183,000
🖨 Deal sheet (PDF) 📄 Offer letter ✓ Due diligence
Listing remarks MLS
Welcome to this charming all-brick home nestled in a quiet, established neighborhood in Hempstead! Located at 1920 6th Street, this 3-bedroom, 1.5-bath property offers the perfect blend of comfort, functionality, and small-town charm. Step inside to find a cozy and inviting layout with plenty of natural light throughout. The spacious living area flows seamlessly into the kitchen and dining space, making it ideal for both everyday living and entertaining. Each bedroom offers comfortable space and versatility. Outside, enjoy the peace and privacy of the surrounding neighborhood, with ample yard space for relaxing, gardening, or creating your own outdoor retreat. The durable all-brick exterior provides timeless curb appeal and low-maintenance living. Whether you’re a first-time homebuyer, downsizing, or looking for an investment opportunity, this property is full of potential & ready to welcome you home! Schedule your showing today!
Key facts
- All brick home
- Ample yard space
- Durable exterior
Tags
Neighborhood map
What this means for you Summary
Snapshot
- This is a 3-bed/1.5-bath single-family listed at $183k.
Deal economics
- At list price, monthly cash flow is $-338 ($-4k/yr) — negative.
- To cash-flow at today's rent, offer at most $123k (32.6% below list).
- To meet the 1% rule (rent ≥ 1% of price), the offer needs to be $127k (30.4% below list).
- Recommended offer: $123k (32.6% below list) — sets the bar for cash-flow.
- Cap rate 4.1% vs local median 2.4% in Hempstead — top-decile yield for the area; either an underpriced asset or a hidden risk that comps aren't pricing in. Stress-test before assuming the spread holds.
Location & tenants
- Location reads 60/100 on livability (#1,099 in TX) — a middle-class / working-renter tenant base. Strengths: cost of living A+, housing A+; Watch: crime D+, employment D, amenities F.
- Hempstead ISD (town): math 16% / reading 19% proficiency, ranked #795 of 826 in TX (top 96%) — low school quality limits family demand, transient renter base, plan for 1-2y turnover; 70% free/reduced lunch — lower-income household profile, screen leases tightly.
- Zoned schools: Hempstead El (math 19% / reading 15%, grade F, #3,836 of 4,322 statewide, top 91%, 834 students, 90% FRL); Hempstead Middle (math 14% / reading 16%, grade F, #1,569 of 1,662 statewide, top 95%, 339 students, 84% FRL); Hempstead H S (math 12% / reading 32%, grade F, #1,366 of 1,632 statewide, top 84%, 465 students, 80% FRL).
- Market conditions: 425 active listings in the ZIP; 6 comparable units currently listed for rent nearby; rentals lingering (median 46d on market — plan ~5-8 weeks vacancy on turnover, expect pricing pressure); 50% of comp listings sitting > 30 days — soft ceiling on asking rent; 483 units permitted in Waller County in 2024 (89 in 5+ unit buildings).
Forward outlook
- In year one you build about $20k of equity ($1k loan paydown + $18k appreciation (10.0% local appreciation)).
- Waller County population projected at +62% by 2050 — long-run rental-demand tailwind backs the buy-and-hold thesis.
- By year 2, paydown + projected appreciation supports a ~$31k cash-out refi (75% LTV) — recoverable capital for the next deal without selling this one.
Negotiation context
- It's been on market 73 days — a 6% lower offer ($172k) is reasonable based on typical stale-listing flexibility.
- 2 sale attempts since 11y ago; this cycle's ask has dropped $17k (8%) from the opening price — seller is motivated, your offer sets the floor, not the list.
- Current owner paid $54k; list at $183k implies a 242% gain — meaningful room to come down on a strong offer.
Risks & watch-outs
- Climate carrying-cost: severe wind risk, 99% chance of damaging wind over 30y; extreme-heat days projected 7→23/yr by 2055 (HVAC capex compounding) — expect insurance premiums to compound above CPI over the hold.
Questions for the listing agent
- What do current leases actually rent for vs. the listed asking? Can we see a recent rent roll and the last 12 months of T-12 income?
- It's been on market 73 days. Have you received any prior offers? Is the seller open to a 33% concession, seller financing, or rate buy-down credit?
- Why hasn't it sold? Are there any deal-killer items the seller is aware of (foundation, flood, title, zoning, code violations)?
- Is there a deadline driving the sale (1031 exchange, divorce, estate, relocation)? That informs how much negotiation room exists.
- Schools are F-rated, which usually means shorter tenancies and higher turnover. Who's the typical renter profile here, and what's been the actual vacancy rate?
- Crime grade is D in this area — have there been break-ins, vandalism, or insurance claims at this property in the last 3 years? What carrier currently insures it and at what premium?
- The area grade is low — what's the realistic commute time and amenity access for the typical tenant pool here? Any planned neighborhood developments (good or bad) we should know about?
- What's the average days-on-market for RENTAL listings here right now (not sales)? A rising rental-DOM trend means longer vacancies and softer asking-rent achievability than the comps imply.
- What's the recent tenant-quality profile in this submarket — average credit score on applications, eviction rate, late-payment / NSF rate, and stable-employment percentage? A property-management company in the area should have these aggregated.
- How much new for-sale + rental construction is in the pipeline within 1–3 miles? Heavy new supply typically softens prices + rents 12–24 months out; constrained supply supports both.
Investment metrics
- 1% rule
- 0.70% ✗
- Cap rate
- 4.08%
- Cash-on-cash
- -7.91%
- DSCR
- 0.65
- GRM
- 12.0
CMA / ARV
- ARV (median comp)
- $210,211
- List price
- $183,000
- Delta
- -12.94%
- Verdict
- UNDERPRICED
- Comps
- 20 within 1.0 mi
Show comp detail 12 sales within ~0.75 mi
| Address | Dist | Beds/Ba | Sqft | Sold | Price | $/sf | Match |
|---|---|---|---|---|---|---|---|
| 2031 7th St | 0.13mi | 3/2.0 | 1,341 (-6%) | 4mo | $200,000 | $149 | 78 |
| 1915 8th St | 0.18mi | 3/2.0 | 1,334 (-7%) | 4mo | $255,000 | $191 | 75 |
| 1920 1st St | 0.35mi | 3/2.0 | 1,380 (-4%) | 12mo | $250,000 | $181 | 66 |
| 1910 1st St | 0.35mi | 3/2.0 | 1,380 (-4%) | 13mo | $250,000 | $181 | 65 |
| 1246 5th St | 0.43mi | 3/2.0 | 1,353 (-6%) | 9mo | $110,000 | $81 | 62 |
| 1112 1st St | 0.62mi | 3/1.5 | 1,344 (-6%) | 9mo | $55,000 | $41 | 53 |
| 1020 2nd St | 0.64mi | 3/2.5 | 1,376 (-4%) | 14mo | $235,000 | $171 | 48 |
| 925 7th St | 0.64mi | 3/2.0 | 1,336 (-7%) | 12mo | $130,000 | $97 | 47 |
| 1926 16th St | 0.71mi | 3/2.0 | 1,559 (+9%) | 5mo | $245,000 | $157 | 46 |
| 1041 Zero St | 0.64mi | 3/2.0 | 1,282 (-10%) | 8mo | $199,000 | $155 | 44 |
| 1036 8th St | 0.57mi | 2/3.0 (-1) | 1,600 (+12%) | 0mo | $160,000 | $100 | 43 |
| 1275 Baker St | 0.50mi | 3/2.0 | 1,244 (-13%) | 12mo | $129,950 | $104 | 42 |
Match score weights: distance 35% · size 25% · config 20% · recency 20%. Top-matched comps best support the ARV.
Projected returns pro-forma
10.0% appreciation · 3.0% rent growth · sell at horizon
- IRR
- 18.7%
- Equity multiple
- 2.53×
- Total profit
- $78,229
- Equity at exit
- $164,861
- IRR
- 17.4%
- Equity multiple
- 5.83×
- Total profit
- $247,419
- Equity at exit
- $355,529
Cash invested: $51,240 (down + closing). Projections, not guarantees.
Landlord ↔ Tenant lean methodology
- Overall (STATE)
- 87 Strongly Landlord-Friendly
- State Texas
- 87 Strongly Landlord-Friendly · R+5
- County
- — inherits STATE
- City
- — inherits STATE
ZIP-level market 77445
- Home prices YoY
- 12.3%
- Active inventory
- 425
- Price-to-rent
- 12.0×
Monthly cashflow live
- Estimated rent
- $1,274 high interval (Pro) →
- Mortgage (P&I)
- −$960
- Tax from tax record
- −$308 /mo · $3,702/yr
- Insurance
- −$76
- HOA
- −$0
- Vacancy / Maint / Mgmt
- −$268
- Net cashflow
- $-338
Break-even live
Sensitivity live
| Price | -10% $-234 | -5% $-286 | +0% $-338 | +5% $-389 | +10% $-441 |
|---|---|---|---|---|---|
| Rent | -10% $-438 | -5% $-388 | +0% $-338 | +5% $-287 | +10% $-237 |
| Rate | -1.0pp $-246 | -0.5pp $-291 | base $-338 | +0.5pp $-385 | +1.0pp $-433 |
UW: 25.0% down · 7.5% · 30yr · 1.5% tax · 5.0% vac · 8.0% maint · 8.0% mgmt
Financing live
Cash to close
- Down payment
- $45,750
- Closing costs
- $5,490
- Reserves months
- —
- Total cash needed
- —
Loan-product check · same deal, 3 products live
Conventional
25% down · 7.5% · 30yr
- Down + closing
- —
- Monthly P&I
- —
- Monthly cashflow
- —
- DSCR
- —
- Eligible?
- —
Personal DTI + credit; lowest rate.
DSCR
20% down · 8.5% · 30yr
- Down + closing
- —
- Monthly P&I
- —
- Monthly cashflow
- —
- DSCR
- —
- Eligible?
- —
No personal income docs; deal must DSCR.
Hard money
10% down · 12.0% · 12mo
- Down + closing
- —
- Monthly P&I
- —
- Monthly cashflow
- —
- DSCR
- —
- Eligible?
- —
Short-term bridge; refi at stabilization.
Rent comps 6 comps
| Address | Beds | Baths | Sqft | Rent | $/sqft | DOM | Units | Dist |
|---|---|---|---|---|---|---|---|---|
| 1246 5th St Hempstead, TX | 2.0 | 1.5 | 1353 | $1,400 | $1.03 | 12d | 1 | 0.41mi |
| 1305 9th St Hempstead, TX | 3.0 | 1.0 | 1568 | $1,450 | $0.92 | 6d | 1 | 0.44mi |
| 1235 11th St Apt 8 Hempstead, TX | 2.0 | 1.0 | 900 | $975 | $1.08 | 46d | 1 | 0.59mi |
| 1235 11th St Unit 15 Hempstead, TX | 2.0 | 1.0 | 900 | $950 | $1.06 | 45d | 1 | 0.59mi |
| 1046 15th St Hempstead, TX | 2.0 | 1.0 | 884 | $1,100 | $1.24 | 14d | 1 | 0.83mi |
| 302 16th St Hempstead, TX | 3.0 | 2.0 | 1408 | $1,450 | $1.03 | 45d | 1 | 1.23mi |
Listing history 22 events
-
2026-06-21days on market $183,000 Active 73 DOM
-
2026-06-18days on market $183,000 Active 70 DOM
-
2026-06-18price $183,000 Active 69 DOM
-
2026-06-17days on market $189,000 Active 69 DOM
-
2026-06-16days on market $189,000 Active 68 DOM
-
2026-06-15days on market $189,000 Active 67 DOM
-
2026-06-13days on market $189,000 Active 65 DOM
-
2026-06-09days on market $189,000 Active 61 DOM
-
2026-06-08days on market $189,000 Active 60 DOM
-
2026-06-07days on market $189,000 Active 59 DOM
-
2026-06-04days on market $189,000 Active 56 DOM
-
2026-06-03days on market $189,000 Active 55 DOM
-
2026-06-02days on market $189,000 Active 54 DOM
-
2026-06-01days on market $189,000 Active 53 DOM
-
2026-05-31days on market $189,000 Active 52 DOM
-
2026-05-06price $189,000 953-char remark
Show marketing remark (953 chars)
Welcome to this charming all-brick home nestled in a quiet, established neighborhood in Hempstead! Located at 1920 6th Street, this 3-bedroom, 1.5-bath property offers the perfect blend of comfort, functionality, and small-town charm. Step inside to find a cozy and inviting layout with plenty of natural light throughout. The spacious living area flows seamlessly into the kitchen and dining space, making it ideal for both everyday living and entertaining. Each bedroom offers comfortable space and versatility. Outside, enjoy the peace and privacy of the surrounding neighborhood, with ample yard space for relaxing, gardening, or creating your own outdoor retreat. The durable all-brick exterior provides timeless curb appeal and low-maintenance living. Whether you’re a first-time homebuyer, downsizing, or looking for an investment opportunity, this property is full of potential & ready to welcome you home! Schedule your showing today!
-
2026-04-09$199,999 Active 953-char remark
Show marketing remark (953 chars)
Welcome to this charming all-brick home nestled in a quiet, established neighborhood in Hempstead! Located at 1920 6th Street, this 3-bedroom, 1.5-bath property offers the perfect blend of comfort, functionality, and small-town charm. Step inside to find a cozy and inviting layout with plenty of natural light throughout. The spacious living area flows seamlessly into the kitchen and dining space, making it ideal for both everyday living and entertaining. Each bedroom offers comfortable space and versatility. Outside, enjoy the peace and privacy of the surrounding neighborhood, with ample yard space for relaxing, gardening, or creating your own outdoor retreat. The durable all-brick exterior provides timeless curb appeal and low-maintenance living. Whether you’re a first-time homebuyer, downsizing, or looking for an investment opportunity, this property is full of potential & ready to welcome you home! Schedule your showing today!
-
2016-03-24soldstatus Sold 85-char remark
Show marketing remark (85 chars)
Beautiful 3/1.5 home located in a quiet neighborhood with easy access to major roads.
-
2016-02-18status Pending 85-char remark
Show marketing remark (85 chars)
Beautiful 3/1.5 home located in a quiet neighborhood with easy access to major roads.
-
2016-01-21price $57,500 85-char remark
Show marketing remark (85 chars)
Beautiful 3/1.5 home located in a quiet neighborhood with easy access to major roads.
-
2015-12-16$62,500 Active 85-char remark
Show marketing remark (85 chars)
Beautiful 3/1.5 home located in a quiet neighborhood with easy access to major roads.
-
1995-03-16soldstatus $53,500
ⓘ Source: listings_history table (triggers on properties + properties_extension) + one-shot
backfill from property_details.listing_events for pre-trigger history.
Tax reassessment forecast TX · Resets to sale price
- Current annual tax
- $3,702 · $308/mo
- Projected year-2 tax
- $3,702 · $308/mo
- Expected delta
- $0/yr ($0/mo · -0.0%)
ⓘ Screening estimate from a state-policy table — verify with the county assessor before closing.
Climate risk First Street
- Flood 1/10 Low FEMA zone X (unshaded) · 0% chance over 30 yrs
- Wildfire 3/10 Moderate
- Heat 9/10 Extreme 7 d/yr ≥111°F today · 23 d/yr by 30 yrs out
- Wind 8/10 Severe 99% chance of damaging wind over 30 yrs
- Air quality 2/10 Low 1 unhealthy d/yr today · 1 by 30 yrs out
Nearby sold comps map
Loading sold comps map…
Walkable amenities ~0.75 mi
Loading nearby amenities…
Taxation est. · year 1
- Rental income
- $15,293
- − Mortgage interest
- −$10,251
- − Property taxes
- −$3,702
- − Insurance
- −$915
- − Repairs & maintenance
- −$1,223
- − Management
- −$1,223
- − Depreciation
- −$5,324
- Taxable loss
- −$7,346
- Est. tax savings @ 24.0%
- +$1,763
- After-tax cash flow
- $-2,289/yr
For passive investors: Depreciation is non-cash, so a rental often shows a tax loss while cash-flowing — sheltering income. Rental losses are passive: they offset passive income freely, and up to $25,000/yr can offset ordinary (W-2) income if you actively participate and your MAGI is under $100k (phasing out to $0 by $150k); unused losses carry forward. On sale, claimed depreciation is recaptured at up to 25%, and gains may owe capital-gains tax (a 1031 exchange can defer both). Figures are a year-1 estimate at your 24.0% rate — not tax advice; consult a CPA.
Schools (NCES district)
- District
- Hempstead ISD
- NCES district ID
- 4822920
- Math proficiency
- 16% ▼ -8.00%
- Reading proficiency
- 19% ▼ -4.00%
- Median HH income
- $40,396
- Composite
- 14.92/100
- National rank
- #9371
- State rank
- #795 of 826 in TX
Livability — Hempstead
- Score
- 60/100
- State rank
- #1099
- US rank
- #19446
Category grades
Schools grade is shown separately in the Schools card above.
Census & demographics
- Census place
- Hempstead, TX
- City population
- 14,943
- Population (ZIP)
- 14,943
Population outlook (Waller County) Hauer SSP2
- Today (2025)
- 60,772 people
- By 2030
- 67,616 · +11.3%
- By 2040
- 82,283 · +35.4%
- By 2050
- 98,276 · +61.7%
- By 2075
- 142,860 · +135.1%
- By 2100
- 175,596 · +188.9%
Race, ethnicity, and origin ACS 2023
- Neighborhood character
- Diverse neighborhood (Simpson 0.69)
- Race & ethnicity
- Hispanic / Latino 34% White 32% Black 31% Two or more races 10% Native American 2%
- Hispanic origin (detail)
- Mexican 30% Cuban 1%
- Common ancestry
- Romanian 2% Lithuanian 2% Slovak 1%
- Foreign-born
- 13% · Canada
- Languages at home
- 74% English-only · Spanish 25%
Political lean MEDSL · Waller
- 2024 margin
- Strong R (+25.0) · D 37.0% · R 62.0% · Other 1.0%
- 2008→2024 swing
- -17.9pp toward R · 2008: -7.2pp · 2024: -25.0pp
- All cycles
- 2024: R+25.0 2020: R+26.7 2016: R+28.6 2012: R+17.6 2008: R+7.2
Not yet ingested
- Civics
- —
Market trends
- HPI YoY
- ▲ 39.43%
- Current HPI
- 359.93
- Rent YoY
- —
- Metro
- —
- State GDP YoY
- ▲ 3.95%
- F500 in state
- 110
Industry mix (Fortune 500 HQ in TX)
| Industry | F500 HQs | Revenue |
|---|---|---|
| Energy | 16 | $1,198B |
|
||
| Technology | 5 | $198B |
|
||
| Engineering / Construction | 4 | $72B |
|
||
| Energy Services | 3 | $60B |
|
||
| Utilities | 3 | $41B |
|
||
| Healthcare | 2 | $330B |
|
||
Price history
+253.3% since first listed7 events — show timeline
- 2026-05-06 Price Changed $189,000 HARMLS
- 2026-04-09 Listed $199,999 HARMLS
- 2016-03-24 Sold (MLS) — HARMLS
- 2016-02-18 Pending — HARMLS
- 2016-01-21 Price Changed $57,500 HARMLS
- 2015-12-16 Listed $62,500 HARMLS
- 1995-03-16 Sold (Public Records) $53,500 Public Records
Property tax history
+4.6%/yrLatest (2025): $3,702 · +17.4% YoY. Source: county tax records.
Cash-flow waterfall
monthlySold comps — $/sqft
last 12 mo · ≤1 miLoading sold comps…