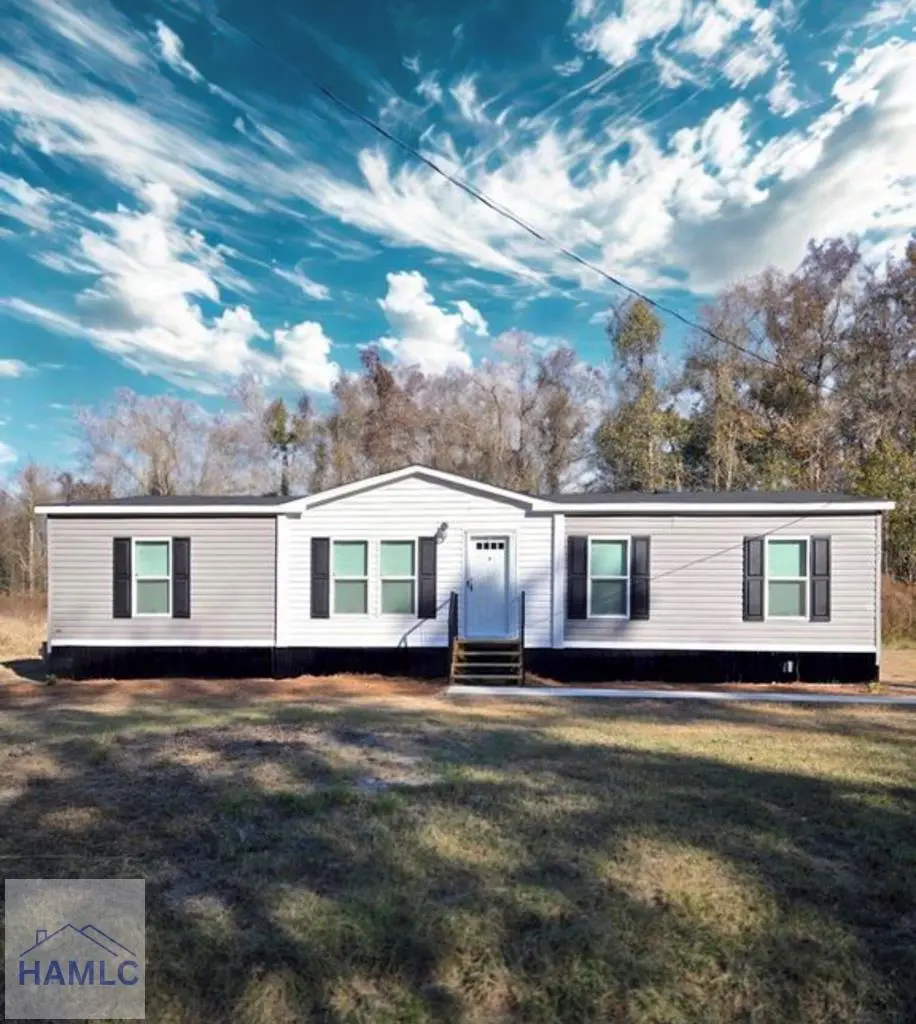
15 Joshua Way · Walthourville, GA
Flood risk 1/10 · Minimal
- FEMA flood zone
- X (shaded)
- Chance of flooding over 30 yrs
- 0.0%
- Est. flood insurance / yr
- $507 – $1,088
Fire risk 6/10 · Moderate
- Est. fire insurance / yr
- $963 – $1,789
Heat risk 9/10 · Severe
- Hot days now (above 110°F)
- 7 days/yr
- Hot days in 30 yrs
- 18 days/yr
Wind risk 8/10 · Major
- Chance of severe wind over 30 yrs
- 99.0%
Air-quality risk 2/10 · Minimal
- Unhealthy air days now
- 2 days/yr
- Unhealthy air days in 30 yrs
- 2 days/yr
Risk factors via First Street. Map © Google.
Why this score? — see what drove the C+ grade
The composite is a weighted blend of 9 inputs, each scored 0–100. Each bar is that input's sub-score; the figure is the points it added to the 100-point composite (weight × sub-score).
- Cash flow +21.7/30.0
- ARV discount +12.1/15.0
- DSCR +6.9/10.0
- 1% rule +5.7/10.0
- Appreciation +5.1/10.0
- Condition / age +4.8/5.0
- Livability +3.2/5.0
- Rent growth +2.5/5.0
- Schools +2.3/10.0
$199,954
🖨 Deal sheet 📄 Offer letter ✓ Due diligence
Listing remarks
LOT 42 SIT ON ABOUT HALF AN ACRE!!! Don't miss out on this Charming NEW 4 bedroom / 2-bathroom home that HAS IT ALL!!! Open and inviting floor plan, elegant white cabinetry, upgraded lighting fixtures and recessed lighting. Complete modern home essentials with a comfortable layout. Double vanity in master bathroom with a tub/shower. Brand new appliances! Home has a 1-year manufacture warranty. VISIT the property today. Seller is a licensed Realtor in GA. Grass Seed has been planted. Homes qualify for FHA and VA loans with a permanent foundation.
Key facts
- 0.3 acre lot
- Built 2026
- Listed 27 days
Neighborhood map
What this means for you Summary
Snapshot
- This is a 4-bed/2.0-bath single-family listed at $200k. Condition is rated excellent.
Deal economics
- At list price, monthly cash flow is $308 ($4k/yr) — positive.
- The deal already cash-flows at list — no discount required.
- Meets the 1% rule at list price ($2k rent vs $200k).
- Recommended offer: $197k (1.5% below list) — sets the bar for market timing.
- Cap rate 8.1% vs local median 5.4% in Walthourville — top-decile yield for the area; either an underpriced asset or a hidden risk that comps aren't pricing in. Stress-test before assuming the spread holds.
Location & tenants
- Location reads 64/100 on livability (#255 in GA) — a middle-class / working-renter tenant base. Strengths: cost of living A+, housing A+, crime B; Watch: employment D, schools F, amenities F.
- Long County (rural): math 26% / reading 26% proficiency, ranked #115 of 174 in GA (top 66%) — low school quality limits family demand, transient renter base, plan for 1-2y turnover; 61% free/reduced lunch — lower-income household profile, screen leases tightly.
- Market conditions: 140 active listings in the ZIP; 5 comparable units currently listed for rent nearby; rentals lingering (median 44d on market — plan ~5-8 weeks vacancy on turnover, expect pricing pressure); 100% of comp listings sitting > 30 days — soft ceiling on asking rent; 298 units permitted in Long County in 2024 (0 in 5+ unit buildings).
- This rent runs 39% of the median local income ($65k/yr) — at the standard rent-burdened threshold; future hikes will face affordability resistance.
Forward outlook
- In year one you build about $2k of equity ($1k loan paydown + $311 appreciation (0.2% local appreciation)).
- Long County population projected at +72% by 2050 — long-run rental-demand tailwind backs the buy-and-hold thesis.
- At projected returns (0.2% appreciation + 3.0% rent growth), your $56k cash investment doubles in ~8 years — after that, you're playing with house money.
Negotiation context
- It's been on market 27 days — a 2% lower offer ($197k) is reasonable based on typical stale-listing flexibility.
Risks & watch-outs
- Climate carrying-cost: severe wind risk, 99% chance of damaging wind over 30y; major wildfire risk; extreme-heat days projected 7→18/yr by 2055 (HVAC capex compounding) — expect insurance premiums to compound above CPI over the hold.
Questions for the listing agent
- Is there a deadline driving the sale (1031 exchange, divorce, estate, relocation)? That informs how much negotiation room exists.
- Schools are F-rated, which usually means shorter tenancies and higher turnover. Who's the typical renter profile here, and what's been the actual vacancy rate?
- What's the average days-on-market for RENTAL listings here right now (not sales)? A rising rental-DOM trend means longer vacancies and softer asking-rent achievability than the comps imply.
- What's the recent tenant-quality profile in this submarket — average credit score on applications, eviction rate, late-payment / NSF rate, and stable-employment percentage? A property-management company in the area should have these aggregated.
- How much new for-sale + rental construction is in the pipeline within 1–3 miles? Heavy new supply typically softens prices + rents 12–24 months out; constrained supply supports both.
Investment metrics
- 1% rule
- 1.07% ✓
- Cap rate
- 8.14%
- Cash-on-cash
- 6.61%
- DSCR
- 1.29
- GRM
- 7.8
CMA / ARV
- ARV (median comp)
- $222,522
- List price
- $199,954
- Delta
- -10.14%
- Verdict
- UNDERPRICED
- Comps
- 20 within 1.0 mi
Show comp detail 9 sales within ~0.75 mi
| Address | Dist | Beds/Ba | Sqft | Sold | Price | $/sf | Match |
|---|---|---|---|---|---|---|---|
| 3573 SE Arnall Dr | 0.53mi | 3/2.0 (-1) | 1,596 (+5%) | 2mo | $246,900 | $155 | 61 |
| 184 Fawn Ct | 0.53mi | 3/2.0 (-1) | 1,527 (+0%) | 11mo | $282,595 | $185 | 60 |
| 83 Pinewood Ln | 0.46mi | 3/2.0 (-1) | 1,423 (-7%) | 10mo | $274,500 | $193 | 55 |
| 425 Winchester Way SE | 0.51mi | 3/2.0 (-1) | 1,459 (-4%) | 13mo | $219,000 | $150 | 54 |
| 1261 Talmadge Rd | 0.61mi | 4/2.5 | 1,609 (+6%) | 13mo | $271,000 | $168 | 50 |
| 74 Griffin Rd | 0.67mi | 4/2.0 | 1,565 (+3%) | 22mo | $265,000 | $169 | 46 |
| 3649 Arnold Drive Dr SE | 0.48mi | 3/2.0 (-1) | 1,631 (+7%) | 23mo | $233,850 | $143 | 42 |
| 65 Morningside Dr | 0.70mi | 3/2.0 (-1) | 1,300 (-15%) | 9mo | $248,500 | $191 | 30 |
| 139 Winchester Way SE | 0.61mi | 3/2.0 (-1) | 1,729 (+14%) | 20mo | $255,000 | $147 | 27 |
Match score weights: distance 35% · size 25% · config 20% · recency 20%. Top-matched comps best support the ARV.
Projected returns pro-forma
0.16% appreciation · 3.0% rent growth · sell at horizon
- IRR
- 5.7%
- Equity multiple
- 1.27×
- Total profit
- $15,286
- Equity at exit
- $59,619
- IRR
- 10.7%
- Equity multiple
- 2.19×
- Total profit
- $66,626
- Equity at exit
- $72,921
Cash invested: $55,987 (down + closing). Projections, not guarantees.
Landlord ↔ Tenant lean methodology
- Overall (STATE)
- 90 Strongly Landlord-Friendly
- State Georgia
- 90 Strongly Landlord-Friendly · R+3
- County
- — inherits STATE
- City
- — inherits STATE
ZIP-level market 31301
- Home prices YoY
- 0.1%
- Active inventory
- 140
- Price-to-rent
- 7.8×
Monthly cashflow live
- Estimated rent
- $2,139 high interval (Pro) →
- Mortgage (P&I)
- −$1,049
- Tax est. 1.5%
- −$250 /mo · $2,999/yr
- Insurance
- −$83
- HOA
- −$0
- Vacancy / Maint / Mgmt
- −$449
- Net cashflow
- $308
Break-even live
UW: 25.0% down · 7.5% · 30yr · 1.5% tax · 5.0% vac · 8.0% maint · 8.0% mgmt
Financing live
Cash to close
- Down payment
- $49,988
- Closing costs
- $5,999
- Reserves months
- —
- Total cash needed
- —
Loan-product check · same deal, 3 products live
Conventional
25% down · 7.5% · 30yr
- Down + closing
- —
- Monthly P&I
- —
- Monthly cashflow
- —
- DSCR
- —
- Eligible?
- —
Personal DTI + credit; lowest rate.
DSCR
20% down · 8.5% · 30yr
- Down + closing
- —
- Monthly P&I
- —
- Monthly cashflow
- —
- DSCR
- —
- Eligible?
- —
No personal income docs; deal must DSCR.
Hard money
10% down · 12.0% · 12mo
- Down + closing
- —
- Monthly P&I
- —
- Monthly cashflow
- —
- DSCR
- —
- Eligible?
- —
Short-term bridge; refi at stabilization.
Rent comps 5 comps
| Address | Beds | Baths | Sqft | Rent | $/sqft | DOM | Units | Dist |
|---|---|---|---|---|---|---|---|---|
| 43 Sandy Run Rd SE Allenhurst, GA | 4.0 | 2.0 | 1450 | $1,800 | $1.24 | 43d | 1 | 1.00mi |
| 373 Carter Rd Unit A Allenhurst, GA | 3.0 | 2.0 | 1196 | $1,900 | $1.59 | 43d | 1 | 1.20mi |
| 119 Belleau Woods Cir Unit 27 Hinesville, GA | 3.0 | 2.5 | 1444 | $2,075 | $1.44 | 43d | 1 | 1.41mi |
| 23 Belleau Woods Cir Hinesville, GA | 3.0 | 2.5 | 1444 | $1,975 | $1.37 | 43d | 1 | 1.42mi |
| 559 McCumber Dr Allenhurst, GA | 3.0 | 2.0 | 1936 | $1,800 | $0.93 | 43d | 1 | 1.48mi |
Listing history 38 events
-
2026-06-02status $199,954 Pending 27 DOM
-
2026-06-01days on market $199,954 Active 27 DOM
-
2026-05-31days on market $199,954 Active 26 DOM
-
2026-05-30days on market $199,954 Active 25 DOM
-
2026-05-19price $199,958 552-char remark
-
2026-05-15price $199,959 552-char remark
-
2026-05-12price $199,961 552-char remark
-
2026-05-12status Pending 555-char remark
-
2026-05-05price $199,962 552-char remark
-
2026-05-05price $199,873 555-char remark
-
2026-05-04price $199,963 552-char remark
-
2026-05-04price $199,874 555-char remark
-
2026-05-01price $199,875 555-char remark
-
2026-05-01price $199,965 552-char remark
-
2026-05-01price $199,966 552-char remark
-
2026-04-29price $199,876 555-char remark
-
2026-04-28price $199,877 555-char remark
-
2026-04-27price $199,878 555-char remark
-
2026-04-23price $199,879 555-char remark
-
2026-04-23price $199,880 555-char remark
-
2026-04-22price $199,881 555-char remark
-
2026-04-21price $199,882 555-char remark
-
2026-04-20price $199,883 555-char remark
-
2026-04-16price $199,884 555-char remark
-
2026-04-15price $199,886 555-char remark
-
2026-04-15price $199,887 555-char remark
-
2026-04-10price $199,889 555-char remark
-
2026-04-09price $199,890 555-char remark
-
2026-04-08price $199,892 555-char remark
-
2026-04-07price $199,893 555-char remark
-
2026-04-07price $199,894 555-char remark
-
2026-04-04price $199,895 555-char remark
-
2026-04-02price $199,896 555-char remark
-
2026-04-01price $199,898 555-char remark
-
2026-03-31price $199,899 555-char remark
-
2026-03-30price $199,997 555-char remark
-
2026-03-10$199,968 Active 552-char remark
-
2026-02-15$199,998 Active 555-char remark
ⓘ Source: listings_history table (triggers on properties + properties_extension) + one-shot
backfill from property_details.listing_events for pre-trigger history.
Climate risk First Street
- Flood 1/10 Low FEMA zone X (shaded) · 0% chance over 30 yrs
- Wildfire 6/10 Major
- Heat 9/10 Extreme 7 d/yr ≥110°F today · 18 d/yr by 30 yrs out
- Wind 8/10 Severe 99% chance of damaging wind over 30 yrs
- Air quality 2/10 Low 2 unhealthy d/yr today · 2 by 30 yrs out
Nearby sold comps map
Loading sold comps map…
Walkable amenities ~0.75 mi
Loading nearby amenities…
Taxation est. · year 1
- Rental income
- $25,673
- − Mortgage interest
- −$11,201
- − Property taxes
- −$2,999
- − Insurance
- −$1,000
- − Repairs & maintenance
- −$2,054
- − Management
- −$2,054
- − Depreciation
- −$5,817
- Taxable income
- $549
- Est. tax owed @ 24.0%
- −$132
- After-tax cash flow
- $3,568/yr
For passive investors: Depreciation is non-cash, so a rental often shows a tax loss while cash-flowing — sheltering income. Rental losses are passive: they offset passive income freely, and up to $25,000/yr can offset ordinary (W-2) income if you actively participate and your MAGI is under $100k (phasing out to $0 by $150k); unused losses carry forward. On sale, claimed depreciation is recaptured at up to 25%, and gains may owe capital-gains tax (a 1031 exchange can defer both). Figures are a year-1 estimate at your 24.0% rate — not tax advice; consult a CPA.
Condition & rehab AI · 12 photos
This home is in excellent condition with modern updates and a well-maintained exterior. It's move-in ready and would benefit from a fresh coat of paint and some small aesthetic upgrades to further enhance its value.
Value-add opportunities
- Resale Paint exterior siding — Fresh paint can enhance curb appeal and home value
- Resale Install new window treatments — Updated window treatments can improve the home's aesthetic
- Both Add a small front porch — A front porch can increase both resale and rental value by providing a welcoming entrance
Renovation cost estimate screening
Value-add ROI direction
- Resale Paint exterior siding — Fresh paint can enhance curb appeal and home value ↑
- Resale Install new window treatments — Updated window treatments can improve the home's aesthetic ↑
- Both Add a small front porch — A front porch can increase both resale and rental value by providing a welcoming entrance ↑
ⓘ Cost ranges are severity-bucket heuristics (US national rule-of-thumb). Get contractor quotes + a written scope before underwriting a rehab budget.
Schools (NCES district)
- District
- Long County
- NCES district ID
- 1303360
- Math proficiency
- 26% ▼ -14.00%
- Reading proficiency
- 26% ▼ -13.00%
- Median HH income
- $45,958
- Composite
- 22.51/100
- National rank
- #8090
- State rank
- #115 of 174 in GA
Livability — Walthourville
- Score
- 64/100
- State rank
- #255
- US rank
- #14108
Category grades
Schools grade is shown separately in the Schools card above.
Census & demographics
- County
- Liberty County · 58,565 people
- City population
- 4,933
- Metro
- Hinesville, GA
- Population (ZIP)
- 4,933
- Household income
- $65,417
- Rent vs Own
- Severe rent burden
- 121.0
Population outlook (Long County) Hauer SSP2
- Today (2025)
- 24,669 people
- By 2030
- 28,223 · +14.4%
- By 2040
- 35,430 · +43.6%
- By 2050
- 42,403 · +71.9%
- By 2075
- 56,996 · +131.0%
- By 2100
- 64,185 · +160.2%
Race, ethnicity, and origin ACS 2023
- Neighborhood character
- Diverse neighborhood (Simpson 0.64)
- Race & ethnicity
- Black 51% White 31% Two or more races 15% Hispanic / Latino 9%
- Hispanic origin (detail)
- Mexican 2% Puerto Rican 7%
- Common ancestry
- Slovak 1% Lithuanian 1%
- Foreign-born
- 3% · Canada
- Languages at home
- 96% English-only · Spanish 2%
Political lean MEDSL · Long
- 2024 margin
- Strong R (+29.5) · D 35.1% · R 64.6%
- 2008→2024 swing
- -5.4pp toward R · 2008: -24.1pp · 2024: -29.5pp
- All cycles
- 2024: R+29.5 2020: R+26.4 2016: R+30.8 2012: R+22.9 2008: R+24.1
Not yet ingested
- Civics
- —
Market trends
- HPI YoY
- ▲ 0.16%
- Current HPI
- 187.7716
- Rent YoY
- —
- Metro
- Hinesville, GA
- State GDP YoY
- ▲ 2.66%
- F500 in state
- 28
Industry mix (Fortune 500 HQ in GA)
| Industry | F500 HQs | Revenue |
|---|---|---|
| Paper / Packaging | 2 | $29B |
|
||
| Retail | 1 | $160B |
|
||
| Transportation / Logistics | 1 | $91B |
|
||
| Airlines | 1 | $62B |
|
||
| Consumer Goods | 1 | $47B |
|
||
| Utilities | 1 | $25B |
|
||
Price history
-0.0% since first listed34 events — show timeline
- 2026-05-29 Price Changed $199,954 HABR
- 2026-05-27 Price Changed $199,955 HABR
- 2026-05-26 Price Changed $199,957 HABR
- 2026-05-19 Price Changed $199,958 HABR
- 2026-05-15 Price Changed $199,959 HABR
- 2026-05-12 Price Changed $199,961 HABR
- 2026-05-05 Price Changed $199,962 HABR
- 2026-05-05 Price Changed $199,873 HABR
- 2026-05-04 Price Changed $199,963 HABR
- 2026-05-04 Price Changed $199,874 HABR
- 2026-05-01 Price Changed $199,875 HABR
- 2026-05-01 Price Changed $199,965 HABR
- 2026-05-01 Price Changed $199,966 HABR
- 2026-04-29 Price Changed $199,876 HABR
- 2026-04-28 Price Changed $199,877 HABR
- 2026-04-27 Price Changed $199,878 HABR
- 2026-04-23 Price Changed $199,879 HABR
- 2026-04-23 Price Changed $199,880 HABR
- 2026-04-22 Price Changed $199,881 HABR
- 2026-04-21 Price Changed $199,882 HABR
- 2026-04-20 Price Changed $199,883 HABR
- 2026-04-16 Price Changed $199,884 HABR
- 2026-04-15 Price Changed $199,886 HABR
- 2026-04-15 Price Changed $199,887 HABR
- 2026-04-10 Price Changed $199,889 HABR
- 2026-04-09 Price Changed $199,890 HABR
- 2026-04-08 Price Changed $199,892 HABR
- 2026-04-07 Price Changed $199,893 HABR
- 2026-04-07 Price Changed $199,894 HABR
- 2026-04-04 Price Changed $199,895 HABR
- 2026-04-02 Price Changed $199,896 HABR
- 2026-04-01 Price Changed $199,898 HABR
- 2026-03-31 Price Changed $199,899 HABR
- 2026-03-30 Price Changed $199,997 HABR
Cash-flow waterfall
monthlySold comps — $/sqft
last 12 mo · ≤1 miLoading sold comps…