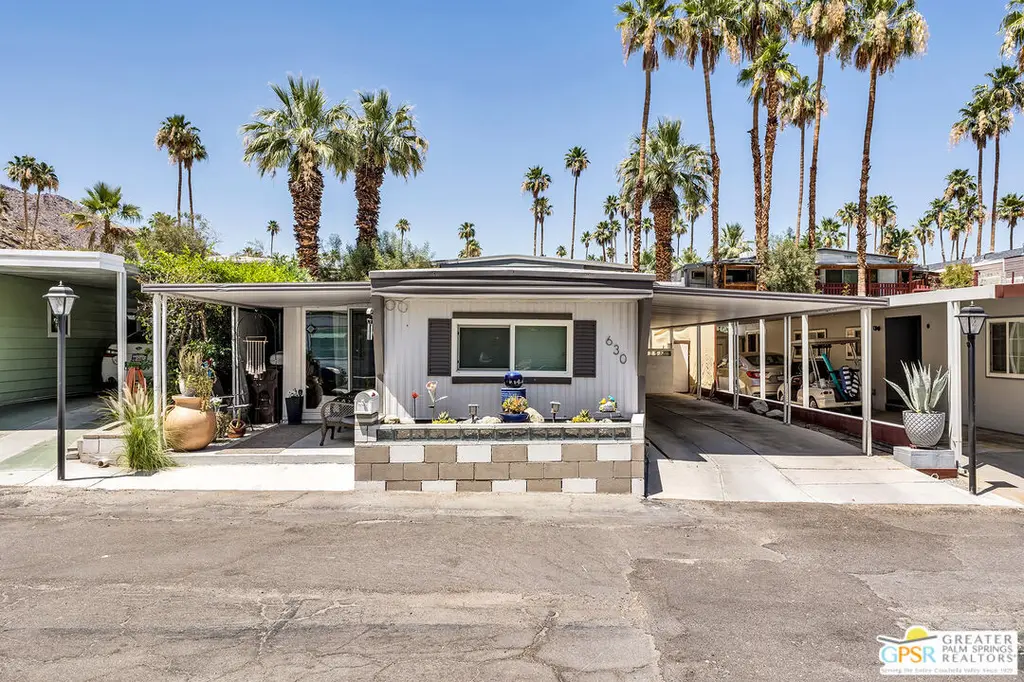
630 Cameo Dr · Palm Springs, CA
Flood risk 1/10 · Minimal
- FEMA flood zone
- X (shaded)
- Chance of flooding over 30 yrs
- 0.0%
- Est. flood insurance / yr
- $507 – $1,088
Fire risk 5/10 · Moderate
- Est. fire insurance / yr
- $659 – $1,223
Heat risk 9/10 · Severe
- Hot days now (above 110°F)
- 10 days/yr
- Hot days in 30 yrs
- 28 days/yr
Wind risk 1/10 · Minimal
- Chance of severe wind over 30 yrs
- —
Air-quality risk 6/10 · Moderate
- Unhealthy air days now
- 10 days/yr
- Unhealthy air days in 30 yrs
- 12 days/yr
Risk factors via First Street. Map © Google.
Why this score? — see what drove the B- grade
The composite is a weighted blend of 9 inputs, each scored 0–100. Each bar is that input's sub-score; the figure is the points it added to the 100-point composite (weight × sub-score).
- Cash flow +26.2/30.0
- ARV discount +15.0/15.0
- DSCR +8.8/10.0
- 1% rule +7.0/10.0
- Condition / age +4.0/5.0
- Livability +3.3/5.0
- Schools +2.7/10.0
- Rent growth +2.4/5.0
- Appreciation +0.0/10.0
$219,000
🖨 Deal sheet 📄 Offer letter ✓ Due diligence
Listing remarks
Welcome to your perfect Palm Springs retreat in the desirable Parkview Mobile Estates, a vibrant 55+ community in South Palm Springs. This charming 2-bedroom, 2-bath home offers comfortable, low-maintenance living with an open-concept floor plan, abundant natural light, and beautiful mountain views. Enjoy seamless indoor-outdoor living with a private patio--ideal for morning coffee, entertaining friends, or relaxing while taking in the stunning desert sunsets. The spacious living areas create a warm and inviting atmosphere, making this home perfect as a full-time residence or seasonal getaway. Located just minutes from world-class golf, shopping, dining, hiking trails, and vibrant downtown
Key facts
- Clubhouse
- Spa
- Private patio
Tags
Property features AI
Finance
- Other: Mobile home will remain with the sale; Park manager: Sherry Puskar (contact available)
- Financial info: Property is a leased space in a mobile home park; Monthly space rent: $832; Rent includes water, trash collection, and pool; Listing terms: Cash or conventional
- HOA & community: Senior park (Parkview Mobile Estates) with 175 units; Community pool and spa (in-ground, gas heated, fenced); Amenities listed as none for HOA; contact for pet rules; Resident manager on site; manager approval required
Exterior
- Parking: Attached carport; Two carport spaces
- Security: Community security; On-site resident manager
- Utilities: Water hook-up in street; Sewer in street; Pool included in community services
- Home design: Single-story manufactured home; Double-wide mobile home; Fleetwood manufacturer; Manufacture date: April 16, 1968; Entry located on a single level
- Construction: Foam roof; Manufactured home construction
- Exterior features: Enclosed patio; Block wall fence; Shed; Fenced yard; Street lighting; Underground utilities; Walk street; Community-managed grounds; Hills view
Interior
- Kitchen: Gas cooktop; Gas oven; Microwave; Dishwasher; Garbage disposal; Refrigerator; Remodeled kitchen
- Flooring: Tile floors
- Bathrooms: Two full bathrooms, remodeled
- Heating & cooling: Central A/C; Dual cooling; Combination heating; Zoned heat
- Interior features: Furnished or unfurnished option; Window blinds; Remodeled bathrooms and kitchen; Covered enclosed patio; Living room; Breakfast area; Dining area
- Laundry & utility: Laundry located outside; Dryer; Water heater unit
Neighborhood map
What this means for you Summary
Snapshot
- This is a 2-bed/2.0-bath manufactured listed at $219k. Condition is rated good.
Deal economics
- At list price, monthly cash flow is $556 ($7k/yr) — positive.
- The deal already cash-flows at list — no discount required.
- Meets the 1% rule at list price ($3k rent vs $219k).
- Cap rate 9.3% vs local median 2.7% in Palm Springs — top-decile yield for the area; either an underpriced asset or a hidden risk that comps aren't pricing in. Stress-test before assuming the spread holds.
Location & tenants
- Location reads 66/100 on livability (#348 in CA) — a middle-class / working-renter tenant base. Strengths: amenities A+, commute A+; Watch: schools C-, crime F, cost of living F.
- Palm Springs Unified (suburban): math 21% / reading 42% proficiency, ranked #328 of 517 in CA (top 63%) — families likely to look elsewhere, expect single-tenant / working-renter base with shorter leases; 73% free/reduced lunch — lower-income household profile, screen leases tightly.
- Market conditions: Rents soft (-0.4%/yr); 492 active listings in the ZIP; 39 comparable units currently listed for rent nearby; rentals at typical pace (median 24d on market — plan ~3-4 weeks tenant-placement turnaround); solid renter incomes; 9,195 units permitted in Riverside County in 2024 (1,512 in 5+ unit buildings).
- This rent runs 40% of the median local income ($78k/yr) — at the standard rent-burdened threshold; future hikes will face affordability resistance.
Forward outlook
- Local home prices are declining (-3.0%/yr); year-one equity from $2k of loan paydown is wiped out by about $7k of value loss. Plan a longer hold.
- Riverside County population projected at +22% by 2050 — long-run rental-demand tailwind backs the buy-and-hold thesis.
Negotiation context
- Only 7 days on market — expect competitive offers; lowballing is unlikely to land.
Risks & watch-outs
- Climate carrying-cost: moderate wildfire risk; extreme-heat days projected 10→28/yr by 2055 (HVAC capex compounding) — expect insurance premiums to compound above CPI over the hold.
Questions for the listing agent
- Built in 1969 — when were the roof, HVAC, electrical panel, plumbing, and water heater last replaced?
- Is there a deadline driving the sale (1031 exchange, divorce, estate, relocation)? That informs how much negotiation room exists.
- Crime grade is F in this area — have there been break-ins, vandalism, or insurance claims at this property in the last 3 years? What carrier currently insures it and at what premium?
- What's the average days-on-market for RENTAL listings here right now (not sales)? A rising rental-DOM trend means longer vacancies and softer asking-rent achievability than the comps imply.
- What's the recent tenant-quality profile in this submarket — average credit score on applications, eviction rate, late-payment / NSF rate, and stable-employment percentage? A property-management company in the area should have these aggregated.
- How much new for-sale + rental construction is in the pipeline within 1–3 miles? Heavy new supply typically softens prices + rents 12–24 months out; constrained supply supports both.
Investment metrics
- 1% rule
- 1.20% ✓
- Cap rate
- 9.34%
- Cash-on-cash
- 10.88%
- DSCR
- 1.48
- GRM
- 7.0
CMA / ARV
- ARV (on-the-fly)
- $288,400
- Comps found
- 12
Show comp detail 12 sales within ~0.75 mi
| Address | Dist | Beds/Ba | Sqft | Sold | Price | $/sf | Match |
|---|---|---|---|---|---|---|---|
| 633 Cameo Dr | 0.02mi | 2/2.0 | 1,440 (+3%) | 1mo | $270,000 | $188 | 94 |
| 527 Jade Ln | 0.03mi | 2/2.0 | 1,440 (+3%) | 4mo | $360,000 | $250 | 91 |
| 218 Stone Ter | 0.15mi | 2/2.0 | 1,400 (0%) | 4mo | $200,000 | $143 | 90 |
| 415 Onyx Dr | 0.07mi | 1/1.5 (-1) | 1,400 (0%) | 21mo | $288,000 | $206 | 72 |
| 723 Scenic View Rd | 0.03mi | 2/2.0 | 1,200 (-14%) | 18mo | $224,000 | $187 | 59 |
| 315 Kona Ln | 0.72mi | 2/2.0 | 1,320 (-6%) | 0mo | $215,000 | $163 | 57 |
| 3 Bali Dr | 0.70mi | 2/2.0 | 1,440 (+3%) | 13mo | $420,000 | $292 | 52 |
| 15 Tiki Dr | 0.65mi | 2/2.0 | 1,440 (+3%) | 16mo | $240,000 | $167 | 52 |
| 2 Bali Dr | 0.65mi | 2/2.0 | 1,440 (+3%) | 16mo | $470,000 | $326 | 52 |
| 317 Kona Ln | 0.72mi | 3/2.0 (+1) | 1,344 (-4%) | 12mo | $325,000 | $242 | 45 |
| 406 Kona Ln | 0.70mi | 2/2.0 | 1,344 (-4%) | 21mo | $280,000 | $208 | 43 |
| 322 Lei Dr | 0.75mi | 3/2.0 (+1) | 1,250 (-11%) | 21mo | $215,000 | $172 | 25 |
Match score weights: distance 35% · size 25% · config 20% · recency 20%. Top-matched comps best support the ARV.
Projected returns pro-forma
-3.0% appreciation · 0.0% rent growth · sell at horizon
- IRR
- -3.5%
- Equity multiple
- 0.87×
- Total profit
- $-7,721
- Equity at exit
- $32,654
- IRR
- 2.5%
- Equity multiple
- 1.15×
- Total profit
- $9,358
- Equity at exit
- $18,935
Cash invested: $61,320 (down + closing). Projections, not guarantees.
Landlord ↔ Tenant lean methodology
- Overall (STATE)
- 18 Strongly Tenant-Friendly
- State California
- 18 Strongly Tenant-Friendly · D+13
- County
- — inherits STATE
- City
- — inherits STATE
ZIP-level market 92264
- Rents YoY
- -0.4%
- Active inventory
- 492
- Price-to-rent
- 7.0×
Monthly cashflow live
- Estimated rent
- $2,619 high interval (Pro) →
- Mortgage (P&I)
- −$1,148
- Tax est. 1.5%
- −$274 /mo · $3,285/yr
- Insurance
- −$91
- HOA
- −$0
- Vacancy / Maint / Mgmt
- −$550
- Net cashflow
- $556
Break-even live
UW: 25.0% down · 7.5% · 30yr · 1.5% tax · 5.0% vac · 8.0% maint · 8.0% mgmt
Financing live
Cash to close
- Down payment
- $54,750
- Closing costs
- $6,570
- Reserves months
- —
- Total cash needed
- —
Loan-product check · same deal, 3 products live
Conventional
25% down · 7.5% · 30yr
- Down + closing
- —
- Monthly P&I
- —
- Monthly cashflow
- —
- DSCR
- —
- Eligible?
- —
Personal DTI + credit; lowest rate.
DSCR
20% down · 8.5% · 30yr
- Down + closing
- —
- Monthly P&I
- —
- Monthly cashflow
- —
- DSCR
- —
- Eligible?
- —
No personal income docs; deal must DSCR.
Hard money
10% down · 12.0% · 12mo
- Down + closing
- —
- Monthly P&I
- —
- Monthly cashflow
- —
- DSCR
- —
- Eligible?
- —
Short-term bridge; refi at stabilization.
Rent comps 39 comps
| Address | Beds | Baths | Sqft | Rent | $/sqft | DOM | Units | Dist |
|---|---|---|---|---|---|---|---|---|
| 1425 Via Soledad Unit 1 Palm Springs, CA | 2.0 | 2.0 | 1050 | $2,500 | $2.38 | 24d | 1 | 0.34mi |
| 1425 Via Soledad Unit 1 Palm Springs, CA | 2.0 | 2.0 | 1050 | $2,500 | $2.38 | 43d | 1 | 0.34mi |
| 500 Paseo Soleado Unit 485 Palm Springs, CA | 2.0 | 2.5 | 1712 | $2,800 | $1.64 | 43d | 1 | 0.57mi |
| 500 Paseo Soleado Unit 497 Palm Springs, CA | 3.0 | 2.5 | 1812 | $3,000 | $1.66 | 43d | 1 | 0.57mi |
| 671 S Riverside Dr Unit 6 Palm Springs, CA | 2.0 | 2.0 | 900 | $1,985 | $2.21 | 24d | 1 | 0.57mi |
| 722 E San Lorenzo Rd Unit 02 Palm Springs, CA | 3.0 | 2.0 | 1200 | $2,425 | $2.02 | 3d | 1 | 0.58mi |
| 722 E San Lorenzo Rd Palm Springs, CA | 3.0 | 1.0–2.0 | 750 | $2,015 | $2.69 | 7d | 3 | 0.58mi |
| 780 E Palm Canyon Dr #202 Palm Springs, CA | 2.0 | 2.0 | 1305 | $2,950 | $2.26 | 24d | 1 | 0.65mi |
| 1428 S Camino Real Palm Springs, CA | 2.0 | 2.0 | 1054 | $2,300 | $2.18 | 43d | 1 | 0.65mi |
| 1900 S Palm Canyon Dr #42 Palm Springs, CA | 2.0 | 2.0 | 1024 | $2,500 | $2.44 | 43d | 1 | 0.66mi |
| 1950 S Palm Canyon Dr Palm Springs, CA | 1.0–2.0 | 1.0–2.0 | 902 | $2,500 | $2.77 | 43d | 2 | 0.67mi |
| 1950 S Palm Canyon Dr Palm Springs, CA | 1.0–2.0 | 1.0–2.0 | 902 | $2,645 | $2.93 | 1d | 3 | 0.67mi |
| 791 E Twin Palms Dr Palm Springs, CA | 3.0 | 2.0 | 1793 | $9,700 | $5.41 | 43d | 1 | 0.74mi |
| 157 Calle Bravo Palm Springs, CA | 2.0 | 3.0 | 1694 | $3,150 | $1.86 | 4d | 1 | 0.75mi |
| 965 E Twin Palms Dr Palm Springs, CA | 3.0 | 2.0 | 1600 | $15,000 | $9.38 | 43d | 1 | 0.82mi |
| 1150 E Palm Canyon Dr #60 Palm Springs, CA | 2.0 | 2.0 | 1240 | $2,595 | $2.09 | 24d | 1 | 0.93mi |
| 251 E La Verne Way Unit F Palm Springs, CA | 2.0 | 2.0 | 1345 | $2,550 | $1.90 | 24d | 1 | 0.96mi |
| 874 Village Square N Palm Springs, CA | 2.0 | 2.0 | 1680 | $3,000 | $1.79 | 18d | 1 | 1.02mi |
| 453 Village Square E Palm Springs, CA | 2.0 | 2.0 | 1400 | $3,000 | $2.14 | 16d | 1 | 1.04mi |
| 1111 E Ramon Rd #87 Palm Springs, CA | 3.0 | 2.0 | 1313 | $4,500 | $3.43 | 17d | 1 | 1.04mi |
| 451 E Via Carisma #72 Palm Springs, CA | 2.0 | 2.0 | 1170 | $2,200 | $1.88 | 24d | 1 | 1.06mi |
| 998 Village Square N Palm Springs, CA | 2.0 | 2.0 | 1588 | $3,000 | $1.89 | 24d | 1 | 1.08mi |
| 250 E San Jose Rd Palm Springs, CA | 2.0–3.0 | 2.0 | 1187 | $2,199 | $1.85 | 43d | 2 | 1.09mi |
| 250 E San Jose Rd #63 Palm Springs, CA | 2.0 | 2.0 | 1152 | $2,400 | $2.08 | 24d | 1 | 1.09mi |
| 449 E Arenas Rd Palm Springs, CA | 2.0 | 1.0–2.0 | 715 | $2,395 | $3.35 | 7d | 1 | 1.10mi |
| 1486 E Palm Tree Dr Palm Springs, CA | 2.0 | 2.0 | 1300 | $3,000 | $2.31 | 43d | 1 | 1.11mi |
| 2220 S Calle Palo Fierro #23 Palm Springs, CA | 2.0 | 2.0 | 1200 | $2,995 | $2.50 | 10d | 1 | 1.11mi |
| 1111 E Ramon Rd Palm Springs, CA | 2.0–3.0 | 2.0 | 1191 | $2,000 | $1.68 | 24d | 2 | 1.13mi |
| 1111 E Ramon Rd Palm Springs, CA | 2.0–3.0 | 2.0 | 1191 | $2,800 | $2.35 | 16d | 2 | 1.13mi |
| 900 E Saturnino Rd Palm Springs, CA | 1.0–3.0 | 1.0–2.0 | 1020 | $2,222 | $2.18 | 1d | 6 | 1.13mi |
| 1041 S La Verne Way Palm Springs, CA | 2.0 | 2.0 | 1325 | $2,800 | $2.11 | 24d | 1 | 1.17mi |
| 1050 E Ramon Rd Palm Springs, CA | 2.0 | 2.0 | 1253 | $3,815 | $3.04 | 43d | 2 | 1.17mi |
| 111 N Palm Canyon Dr Unit 201 Palm Springs, CA | 2.0 | 2.0 | 1463 | $4,374 | $2.99 | 43d | 1 | 1.23mi |
| 877 E Arenas Rd Palm Springs, CA | 2.0 | 2.0 | 1176 | $3,500 | $2.98 | 43d | 1 | 1.23mi |
| 280 S Avenida Caballeros #209 Palm Springs, CA | 2.0 | 1.5 | 1128 | $2,450 | $2.17 | 14d | 1 | 1.28mi |
| 1710 E Sonora Rd Palm Springs, CA | 2.0 | 2.0 | 1391 | $2,800 | $2.01 | 24d | 1 | 1.28mi |
| 1745 Capri Cir Palm Springs, CA | 2.0 | 2.0 | 1200 | $2,495 | $2.08 | 24d | 1 | 1.38mi |
| 255 E Avenida Granada #525 Palm Springs, CA | 2.0 | 2.0 | 1198 | $2,195 | $1.83 | 18d | 1 | 1.47mi |
| 255 E Avenida Granada #324 Palm Springs, CA | 2.0 | 2.0 | 1198 | $2,100 | $1.75 | 7d | 1 | 1.47mi |
Listing history 12 events
-
2026-06-18days on market $219,000 Active 7 DOM
-
2026-06-17days on market $219,000 Active 6 DOM
-
2026-06-16days on market $219,000 Active 5 DOM
-
2026-06-15days on market $219,000 Active 4 DOM
-
2026-06-13days on market $219,000 Active 2 DOM
-
2026-06-13days on market $219,000 Active 1 DOM
-
2026-06-04days on market $219,000 Active 13 DOM
-
2026-06-03days on market $219,000 Active 12 DOM
-
2026-06-02days on market $219,000 Active 11 DOM
-
2026-06-01days on market $219,000 Active 10 DOM
-
2026-05-31days on market $219,000 Active 9 DOM
-
2026-05-22$219,000 Active
ⓘ Source: listings_history table (triggers on properties + properties_extension) + one-shot
backfill from property_details.listing_events for pre-trigger history.
Climate risk First Street
- Flood 1/10 Low FEMA zone X (shaded) · 0% chance over 30 yrs
- Wildfire 5/10 Major
- Heat 9/10 Extreme 10 d/yr ≥110°F today · 28 d/yr by 30 yrs out
- Wind 1/10 Low
- Air quality 6/10 Major 10 unhealthy d/yr today · 12 by 30 yrs out
Nearby sold comps map
Loading sold comps map…
Walkable amenities ~0.75 mi
Loading nearby amenities…
Taxation est. · year 1
- Rental income
- $31,433
- − Mortgage interest
- −$12,267
- − Property taxes
- −$3,285
- − Insurance
- −$1,095
- − Repairs & maintenance
- −$2,515
- − Management
- −$2,515
- − Depreciation
- −$6,371
- Taxable income
- $3,385
- Est. tax owed @ 24.0%
- −$812
- After-tax cash flow
- $5,858/yr
For passive investors: Depreciation is non-cash, so a rental often shows a tax loss while cash-flowing — sheltering income. Rental losses are passive: they offset passive income freely, and up to $25,000/yr can offset ordinary (W-2) income if you actively participate and your MAGI is under $100k (phasing out to $0 by $150k); unused losses carry forward. On sale, claimed depreciation is recaptured at up to 25%, and gains may owe capital-gains tax (a 1031 exchange can defer both). Figures are a year-1 estimate at your 24.0% rate — not tax advice; consult a CPA.
Condition & rehab AI · 30 photos
This well-maintained, modernized manufactured home in a desirable community offers a comfortable and stylish living space with potential for further improvements to enhance its resale and rental value.
Value-add opportunities
- Resale Paint exterior — Enhances curb appeal and value
- Both Replace carpet with hardwood — Improves aesthetics and is durable
- Both Install smart home devices — Enhances comfort and energy efficiency
Renovation cost estimate screening
Value-add ROI direction
- Resale Paint exterior — Enhances curb appeal and value ↑
- Both Replace carpet with hardwood — Improves aesthetics and is durable ↑
- Both Install smart home devices — Enhances comfort and energy efficiency ↑
ⓘ Cost ranges are severity-bucket heuristics (US national rule-of-thumb). Get contractor quotes + a written scope before underwriting a rehab budget.
Schools (NCES district)
- District
- Palm Springs Unified
- NCES district ID
- 0629550
- Math proficiency
- 21% ▼ -7.00%
- Reading proficiency
- 42% ▬ 0.00%
- Median HH income
- $43,638
- Composite
- 26.76/100
- National rank
- #7131
- State rank
- #328 of 517 in CA
Livability — Palm Springs
- Score
- 66/100
- State rank
- #348
- US rank
- #11850
Category grades
Schools grade is shown separately in the Schools card above.
Census & demographics
- Census place
- Palm Springs, CA
- County
- Riverside County · 2,287,001 people
- City population
- 46,786
- Metro
- Riverside-San Bernardino-Ontario, CA
- Population (ZIP)
- 19,899
- Household income
- $77,688
- Rent vs Own
- Severe rent burden
- 1215.0
Population outlook (Riverside County) Hauer SSP2
- Today (2025)
- 2,664,475 people
- By 2030
- 2,802,692 · +5.2%
- By 2040
- 3,050,904 · +14.5%
- By 2050
- 3,256,783 · +22.2%
- By 2075
- 3,655,058 · +37.2%
- By 2100
- 3,766,594 · +41.4%
Race, ethnicity, and origin ACS 2023
- Neighborhood character
- Predominantly White (68%)
- Race & ethnicity
- White 68% Hispanic / Latino 20% Two or more races 12% Asian 6% Black 2% Native American 1%
- Hispanic origin (detail)
- Mexican 16%
- Common ancestry
- Lithuanian 4% Romanian 3% Slovak 3%
- Foreign-born
- 16% · Canada, China, South Korea
- Languages at home
- 81% English-only · Spanish 13% Tagalog/Filipino 2% Other Asian/Pacific 1%
Political lean MEDSL · Riverside
- 2024 margin
- Toss-up / Even · D 48.0% · R 49.3% · Other 2.6%
- 2008→2024 swing
- -3.6pp toward R · 2008: 2.3pp · 2024: -1.3pp
- All cycles
- 2024: R+1.3 2020: D+8.0 2016: D+4.3 2012: R+0.4 2008: D+2.3
Not yet ingested
- Civics
- —
Market trends
- HPI YoY
- ▼ -489.04%
- Current HPI
- 357.0969
- Rent YoY
- ▼ -0.43%
- Metro
- Riverside-San Bernardino-Ontario, CA
- State GDP YoY
- ▲ 3.21%
- F500 in state
- 116
Industry mix (Fortune 500 HQ in CA)
| Industry | F500 HQs | Revenue |
|---|---|---|
| Technology | 27 | $1,492B |
|
||
| Financial Services | 3 | $174B |
|
||
| Retail | 3 | $44B |
|
||
| Insurance | 3 | $26B |
|
||
| Media / Entertainment | 2 | $115B |
|
||
| Pharmaceuticals / Biotech | 2 | $62B |
|
||
Price history
1 event — show timeline
- 2026-05-22 Listed $219,000 TheMLS
Cash-flow waterfall
monthlySold comps — $/sqft
last 12 mo · ≤1 miLoading sold comps…