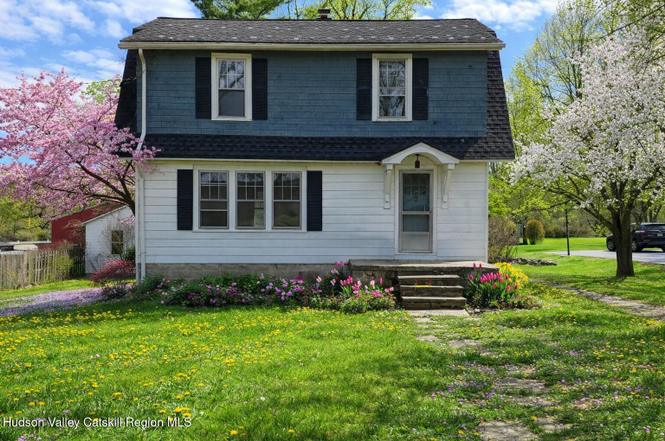
143 Old Route 209 · Hurley, NY
Flood risk 1/10 · Minimal
- FEMA flood zone
- X (shaded)
- Chance of flooding over 30 yrs
- 0.0%
- Est. flood insurance / yr
- $473 – $860
Fire risk 1/10 · Minimal
- Est. fire insurance / yr
- $691 – $1,283
Heat risk 4/10 · Minor
- Hot days now (above 98°F)
- 7 days/yr
- Hot days in 30 yrs
- 15 days/yr
Wind risk 3/10 · Minor
- Chance of severe wind over 30 yrs
- 7.0%
Air-quality risk 2/10 · Minimal
- Unhealthy air days now
- 0 days/yr
- Unhealthy air days in 30 yrs
- 1 days/yr
Risk factors via First Street. Map © Google.
Why this score? — see what drove the C- grade
The composite is a weighted blend of 9 inputs, each scored 0–100. Each bar is that input's sub-score; the figure is the points it added to the 100-point composite (weight × sub-score).
- Cash flow +18.4/30.0
- ARV discount +6.6/15.0
- DSCR +5.8/10.0
- Appreciation +5.4/10.0
- 1% rule +4.9/10.0
- Schools +4.4/10.0
- Livability +3.4/5.0
- Rent growth +2.5/5.0
- Condition / age +2.5/5.0
$399,999
🖨 Deal sheet 📄 Offer letter ✓ Due diligence
Listing remarks
Welcome to the heart of Historic Old Hurley! This charming 3-bedroom, 1-bath home offers just over 1,300 sq. ft. of comfortable living space in one of the area's most desirable and scenic hamlets. The property includes a spacious 3-bay garage (32x25), ideal for vehicle storage, workshop space, or hobbies. Inside, you'll find a warm and functional layout with nicely sized rooms and an abundance of natural light. The kitchen and dining area provide the perfect setting for everyday living and entertaining, while the cozy living room is ready for relaxing evenings at home. Located just minutes from the Stockade District of Uptown Kingston, you'll enjoy quick access to restaurants, shops, galler
Key facts
- 1.1 acre lot
- 3 garage spots
- Built 1940
Property features AI
Exterior
- Parking: 3-car garage; Driveway
- Utilities: Private water
- Home design: Single-family residence; Two levels
- Construction: Has basement
- Exterior features: Mixed roof
Interior
- Kitchen: Electric oven; Refrigerator
- Flooring: Carpet; Wood
- Bathrooms: 1 full bathroom
- Heating & cooling: Oil heating; No central cooling
- Interior features: Electric oven; Refrigerator; Unfinished basement
Neighborhood map
What this means for you Summary
Snapshot
- This is a 3-bed/1.0-bath single-family listed at $400k.
Deal economics
- At list price, monthly cash flow is $373 ($4k/yr) — positive.
- The deal already cash-flows at list — no discount required.
- To meet the 1% rule (rent ≥ 1% of price), the offer needs to be $395k (1.2% below list).
- Recommended offer: $352k (12.0% below list) — sets the bar for market timing.
- Cap rate 7.4% vs local median 3.2% in Hurley — top-decile yield for the area; either an underpriced asset or a hidden risk that comps aren't pricing in. Stress-test before assuming the spread holds.
Location & tenants
- Location reads 68/100 on livability (#543 in NY) — a middle-class / working-renter tenant base. Strengths: crime A+, employment A+, housing A+; Watch: cost of living D+, amenities F, commute F.
- Kingston City School District (urban): math 44% / reading 59% proficiency, ranked #355 of 590 in NY (top 60%) — acceptable for families but not a draw, mixed tenant base, ~2y average lease.
- Market conditions: 31 active listings in the ZIP; 1 comparable units currently listed for rent nearby; 464 units permitted in Ulster County in 2024 (170 in 5+ unit buildings).
Forward outlook
- In year one you build about $6k of equity ($3k loan paydown + $3k appreciation (0.8% local appreciation)).
- Ulster County population projected at -14% by 2050 — secular population decline; favor cash flow + early exit over multi-decade hold.
- At projected returns (0.8% appreciation + 3.0% rent growth), your $112k cash investment doubles in ~8 years — after that, you're playing with house money.
- By year 6, paydown + projected appreciation supports a ~$36k cash-out refi (75% LTV) — recoverable capital for the next deal without selling this one.
Negotiation context
- It's been on market 165 days — a 12% lower offer ($352k) is reasonable based on typical stale-listing flexibility.
- Current owner paid $135k; list at $400k implies a 196% gain — meaningful room to come down on a strong offer.
Risks & watch-outs
- Watch-outs: built in 1940 — expect roof / HVAC / electrical / plumbing capex.
Questions for the listing agent
- It's been on market 165 days. Have you received any prior offers? Is the seller open to a 12% concession, seller financing, or rate buy-down credit?
- Built in 1940 — when were the roof, HVAC, electrical panel, plumbing, and water heater last replaced?
- Why hasn't it sold? Are there any deal-killer items the seller is aware of (foundation, flood, title, zoning, code violations)?
- Is there a deadline driving the sale (1031 exchange, divorce, estate, relocation)? That informs how much negotiation room exists.
- What's the average days-on-market for RENTAL listings here right now (not sales)? A rising rental-DOM trend means longer vacancies and softer asking-rent achievability than the comps imply.
- What's the recent tenant-quality profile in this submarket — average credit score on applications, eviction rate, late-payment / NSF rate, and stable-employment percentage? A property-management company in the area should have these aggregated.
- How much new for-sale + rental construction is in the pipeline within 1–3 miles? Heavy new supply typically softens prices + rents 12–24 months out; constrained supply supports both.
Investment metrics
- 1% rule
- 0.99% ✗
- Cap rate
- 7.41%
- Cash-on-cash
- 4.00%
- DSCR
- 1.18
- GRM
- 8.4
CMA / ARV
- ARV (on-the-fly)
- $392,448
- Comps found
- 6
Show comp detail 6 sales within ~0.75 mi
| Address | Dist | Beds/Ba | Sqft | Sold | Price | $/sf | Match |
|---|---|---|---|---|---|---|---|
| 143 Old Route 209 | 0.00mi | 3/1.0 | 1,344 (0%) | 0mo | $392,000 | $292 | 100 |
| 104 Benson Ct | 0.68mi | 3/1.0 | 1,328 (-1%) | 7mo | $349,900 | $263 | 60 |
| 170 Old Route 209 | 0.08mi | 4/2.0 (+1) | 1,538 (+14%) | 5mo | $470,000 | $306 | 58 |
| 333 Overlook Dr | 0.45mi | 3/2.0 | 1,366 (+2%) | 18mo | $420,000 | $307 | 57 |
| 231 Millbrook Ave | 0.35mi | 3/2.0 | 1,404 (+4%) | 24mo | $310,000 | $221 | 52 |
| 217 Evergreen Ln | 0.60mi | 3/2.0 | 1,229 (-9%) | 9mo | $305,000 | $248 | 46 |
Match score weights: distance 35% · size 25% · config 20% · recency 20%. Top-matched comps best support the ARV.
Projected returns pro-forma
0.84% appreciation · 3.0% rent growth · sell at horizon
- IRR
- 5.0%
- Equity multiple
- 1.25×
- Total profit
- $28,234
- Equity at exit
- $133,286
- IRR
- 9.5%
- Equity multiple
- 2.13×
- Total profit
- $126,759
- Equity at exit
- $174,626
Cash invested: $112,000 (down + closing). Projections, not guarantees.
Landlord ↔ Tenant lean methodology
- Overall (STATE)
- 15 Strongly Tenant-Friendly
- State New York
- 15 Strongly Tenant-Friendly · D+10
- County
- — inherits STATE
- City
- — inherits STATE
ZIP-level market 12443
- Home prices YoY
- 0.3%
- Active inventory
- 31
- Price-to-rent
- 8.4×
Monthly cashflow live
- Estimated rent
- $3,950 medium interval (Pro) →
- Mortgage (P&I)
- −$2,098
- Tax from tax record
- −$483 /mo · $5,795/yr
- Insurance
- −$167
- HOA
- −$0
- Vacancy / Maint / Mgmt
- −$830
- Net cashflow
- $373
Break-even live
UW: 25.0% down · 7.5% · 30yr · 1.5% tax · 5.0% vac · 8.0% maint · 8.0% mgmt
Financing live
Cash to close
- Down payment
- $100,000
- Closing costs
- $12,000
- Reserves months
- —
- Total cash needed
- —
Loan-product check · same deal, 3 products live
Conventional
25% down · 7.5% · 30yr
- Down + closing
- —
- Monthly P&I
- —
- Monthly cashflow
- —
- DSCR
- —
- Eligible?
- —
Personal DTI + credit; lowest rate.
DSCR
20% down · 8.5% · 30yr
- Down + closing
- —
- Monthly P&I
- —
- Monthly cashflow
- —
- DSCR
- —
- Eligible?
- —
No personal income docs; deal must DSCR.
Hard money
10% down · 12.0% · 12mo
- Down + closing
- —
- Monthly P&I
- —
- Monthly cashflow
- —
- DSCR
- —
- Eligible?
- —
Short-term bridge; refi at stabilization.
Rent comps 1 comps
| Address | Beds | Baths | Sqft | Rent | $/sqft | DOM | Units | Dist |
|---|---|---|---|---|---|---|---|---|
| 111 Zandhoek Rd Hurley, NY | 3.0 | 1.5 | 1581 | $3,950 | $2.50 | 43d | 1 | 0.69mi |
Listing history 12 events
-
2026-06-03status $399,999 Pending 165 DOM
-
2026-06-02days on market $399,999 Active Under Contract 165 DOM
-
2026-06-01days on market $399,999 Active Under Contract 164 DOM
-
2026-05-31days on market $399,999 Active Under Contract 163 DOM
-
2026-05-30days on market $399,999 Active Under Contract 162 DOM
-
2026-04-30historical Active Under Contract
-
2026-04-06price $399,999
-
2026-01-29price $435,000
-
2025-12-19$449,999 Active
-
2025-12-12historical $449,999
-
1986-10-01soldstatus $135,000
-
1979-07-31soldstatus $17,428
ⓘ Source: listings_history table (triggers on properties + properties_extension) + one-shot
backfill from property_details.listing_events for pre-trigger history.
Tax reassessment forecast NY · Partial reset (capped growth)
- Current annual tax
- $5,795 · $483/mo
- Projected year-2 tax
- $6,277 · $523/mo
- Expected delta
- +$483/yr (+$40/mo · 8.3%)
ⓘ Screening estimate from a state-policy table — verify with the county assessor before closing.
Climate risk First Street
- Flood 1/10 Low FEMA zone X (shaded) · 0% chance over 30 yrs
- Wildfire 1/10 Low
- Heat 4/10 Moderate 7 d/yr ≥98°F today · 15 d/yr by 30 yrs out
- Wind 3/10 Moderate 7% chance of damaging wind over 30 yrs
- Air quality 2/10 Low 0 unhealthy d/yr today · 1 by 30 yrs out
Nearby sold comps map
Loading sold comps map…
Walkable amenities ~0.75 mi
Loading nearby amenities…
Taxation est. · year 1
- Rental income
- $47,400
- − Mortgage interest
- −$22,406
- − Property taxes
- −$5,795
- − Insurance
- −$2,000
- − Repairs & maintenance
- −$3,792
- − Management
- −$3,792
- − Depreciation
- −$11,636
- Taxable loss
- −$2,021
- Est. tax savings @ 24.0%
- +$485
- After-tax cash flow
- $4,965/yr
For passive investors: Depreciation is non-cash, so a rental often shows a tax loss while cash-flowing — sheltering income. Rental losses are passive: they offset passive income freely, and up to $25,000/yr can offset ordinary (W-2) income if you actively participate and your MAGI is under $100k (phasing out to $0 by $150k); unused losses carry forward. On sale, claimed depreciation is recaptured at up to 25%, and gains may owe capital-gains tax (a 1031 exchange can defer both). Figures are a year-1 estimate at your 24.0% rate — not tax advice; consult a CPA.
Schools (NCES district)
- District
- Kingston City School District
- NCES district ID
- 3616290
- Math proficiency
- 44% ▲ 1.00%
- Reading proficiency
- 59% ▲ 20.00%
- Median HH income
- $52,586
- Composite
- 44.22/100
- National rank
- #2849
- State rank
- #355 of 590 in NY
Livability — Hurley
- Score
- 68/100
- State rank
- #543
- US rank
- #9765
Category grades
Schools grade is shown separately in the Schools card above.
Census & demographics
- Census place
- Hurley, NY
- Population (ZIP)
- 3,601
Population outlook (Ulster County) Hauer SSP2
- Today (2025)
- 175,887 people
- By 2030
- 171,876 · -2.3%
- By 2040
- 161,771 · -8.0%
- By 2050
- 151,470 · -13.9%
- By 2075
- 133,023 · -24.4%
- By 2100
- 113,504 · -35.5%
Race, ethnicity, and origin ACS 2023
- Neighborhood character
- Predominantly White (82%)
- Race & ethnicity
- White 82% Two or more races 8% Hispanic / Latino 6% Asian 3% Black 1%
- Hispanic origin (detail)
- Puerto Rican 1% Dominican 2%
- Common ancestry
- Iranian 5% Romanian 4% Scotch-Irish 4%
- Foreign-born
- 6% · Canada, Jamaica, South Korea
- Languages at home
- 91% English-only · Spanish 6% Other Asian/Pacific 1% Other Indo-European 1%
Political lean MEDSL · Ulster
- 2024 margin
- D (+18.7) · D 59.3% · R 40.7%
- 2008→2024 swing
- -4.9pp toward R · 2008: 23.6pp · 2024: 18.7pp
- All cycles
- 2024: D+18.7 2020: D+20.9 2016: D+9.1 2012: D+21.9 2008: D+23.6
Not yet ingested
- Civics
- —
Market trends
- HPI YoY
- ▲ 0.84%
- Current HPI
- 329.5547
- Rent YoY
- —
- Metro
- —
- State GDP YoY
- ▲ 2.60%
- F500 in state
- 92
Industry mix (Fortune 500 HQ in NY)
| Industry | F500 HQs | Revenue |
|---|---|---|
| Financial Services | 10 | $950B |
|
||
| Consumer Goods | 9 | $162B |
|
||
| Insurance | 4 | $225B |
|
||
| Telecommunications | 2 | $144B |
|
||
| Pharmaceuticals | 2 | $112B |
|
||
| Media / Entertainment | 2 | $69B |
|
||
Price history
+2195.2% since first listed7 events — show timeline
- 2026-04-30 Contingent — HVCRMLS
- 2026-04-06 Price Changed $399,999 HVCRMLS
- 2026-01-29 Price Changed $435,000 HVCRMLS
- 2025-12-19 Listed $449,999 HVCRMLS
- 2025-12-12 Coming Soon $449,999 HVCRMLS
- 1986-10-01 Sold (Public Records) $135,000 Public Records
- 1979-07-31 Sold (Public Records) $17,428 Public Records
Property tax history
+2.5%/yrLatest (2025): $5,795 · -0.5% YoY. Source: county tax records.
Cash-flow waterfall
monthlySold comps — $/sqft
last 12 mo · ≤1 miLoading sold comps…