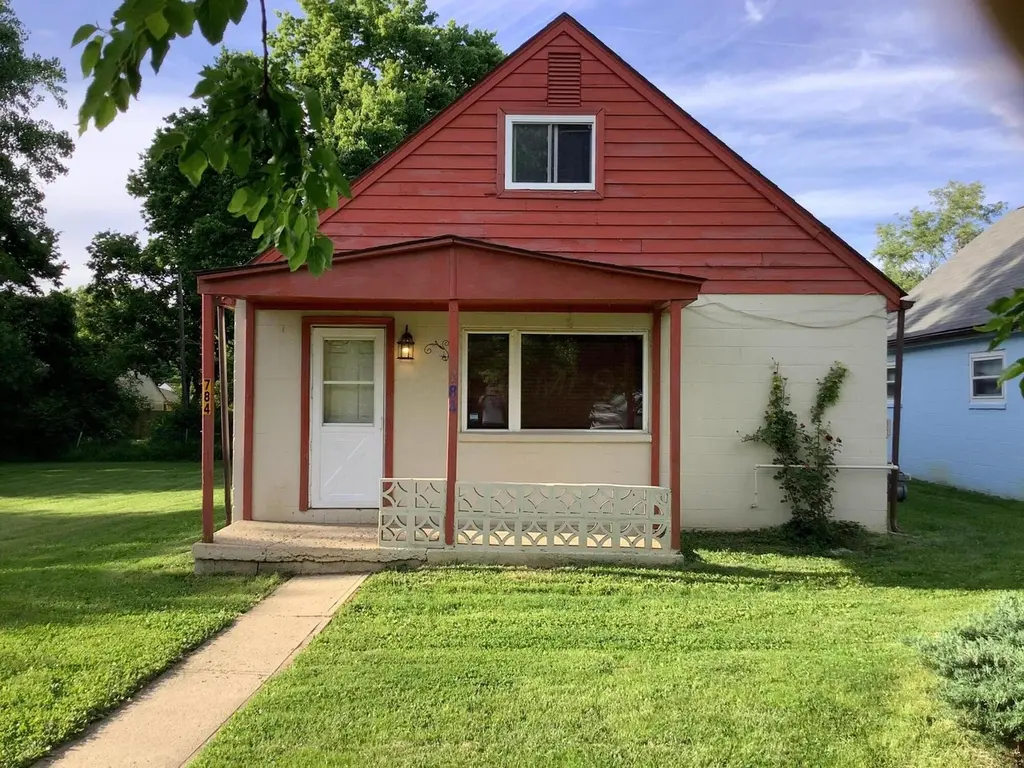
784 Elwood Ave · Columbus, OH
Flood risk 1/10 · Minimal
- FEMA flood zone
- X (unshaded)
- Chance of flooding over 30 yrs
- 0.0%
- Est. flood insurance / yr
- $507 – $1,088
Fire risk 1/10 · Minimal
- Est. fire insurance / yr
- $713 – $1,323
Heat risk 3/10 · Minor
- Hot days now (above 100°F)
- 7 days/yr
- Hot days in 30 yrs
- 17 days/yr
Wind risk 2/10 · Minimal
- Chance of severe wind over 30 yrs
- 1.0%
Air-quality risk 3/10 · Minor
- Unhealthy air days now
- 2 days/yr
- Unhealthy air days in 30 yrs
- 3 days/yr
Risk factors via First Street. Map © Google.
Why this score? — see what drove the D- grade
The composite is a weighted blend of 9 inputs, each scored 0–100. Each bar is that input's sub-score; the figure is the points it added to the 100-point composite (weight × sub-score).
- Cash flow +15.3/30.0
- ARV discount +5.2/15.0
- DSCR +4.7/10.0
- Livability +4.0/5.0
- 1% rule +3.4/10.0
- Rent growth +3.1/5.0
- Condition / age +2.5/5.0
- Schools +1.7/10.0
- Appreciation +0.0/10.0
$176,000
🖨 Deal sheet (PDF) 📄 Offer letter ✓ Due diligence
Listing remarks
Welcome Home, come to a location where Quite is the Greatest reward. This area feels like living in the country, yet 8 minutes from downtown Columbus. The area consist of two streets that are now seeing a total redevelopment with several new homes being built. One of the few areas that children play safety in the streets. The Home has several updates within the last 10 years, New roof, furnance, painting and carpet. The auditor has it as a 3 bedroom, but it's actually a 4 bedroom. 3 rooms are above average, with 4th a greate office space or small bedroom. New homes built in this area by City developement have both sold for $200,000 but the new owners don't own the land. Come get away from i
Key facts
- New furnace
- New carpet
- Great office space
Tags
Property features AI
Exterior
- Parking: On-street parking
- Utilities: Public water; Public sewer
- Home design: Single family residence; One and one-half stories; Built in 1958; No common walls
- Construction: Block foundation; Other foundation type
- Exterior features: Shed(s) on the property
Interior
- Bedrooms: 2 bedrooms on the main level
- Flooring: Laminate flooring; Carpeted areas
- Bathrooms: 1 full bathroom
- Interior features: Insulated windows; No fireplaces
Neighborhood map
What this means for you Summary
Snapshot
- This is a 3-bed/1.0-bath single-family listed at $176k.
Deal economics
- At list price, monthly cash flow is $63 ($756/yr) — positive.
- The deal already cash-flows at list — no discount required.
- To meet the 1% rule (rent ≥ 1% of price), the offer needs to be $148k (15.8% below list).
- Recommended offer: $148k (15.8% below list) — sets the bar for 1% rule.
- Cap rate 6.7% vs local median 3.8% in Columbus — top-decile yield for the area; either an underpriced asset or a hidden risk that comps aren't pricing in. Stress-test before assuming the spread holds.
Location & tenants
- Location reads 81/100 on livability (#97 in OH, #1,491 nationally) — a professional / high-income tenant draw. Strengths: commute A+, cost of living A+, housing A+; Watch: employment C-, crime F.
- Columbus City School District (urban): math 15% / reading 26% proficiency, ranked #626 of 656 in OH (top 95%) — low school quality limits family demand, transient renter base, plan for 1-2y turnover; 72% free/reduced lunch — lower-income household profile, screen leases tightly.
- Zoned schools: Indianola Informal K-8 School (math 43% / reading 58%, grade D+, #896 of 1,584 statewide, top 57%, 684 students, 0% FRL); Arts Impact Middle School (Aims) (math 17% / reading 25%, grade F, #608 of 654 statewide, top 93%, 532 students, 0% FRL); Columbus Alternative High School (math 27% / reading 74%, grade D+, #380 of 781 statewide, top 49%, 758 students, 0% FRL) — zoned schools average 0% FRL vs 72% district-wide (72 pts lower); this property's tenant base skews higher-income than the district average.
- Zoned-school proficiency averages 41% at this address vs 20% district-wide (+20 pts) — the actual schools serving this property are materially stronger than the Columbus City School District average implies; a family-tenant draw the district grade alone would hide.
- Market conditions: Rents rising (+2.3%/yr); 198 active listings in the ZIP; 40 comparable units currently listed for rent nearby; rentals at typical pace (median 26d on market — plan ~3-4 weeks tenant-placement turnaround); 8,139 units permitted in Franklin County in 2024 (5,940 in 5+ unit buildings).
Forward outlook
- Local home prices are declining (-3.0%/yr); year-one equity from $1k of loan paydown is wiped out by about $5k of value loss. Plan a longer hold.
- Franklin County population projected at +34% by 2050 — long-run rental-demand tailwind backs the buy-and-hold thesis.
Negotiation context
- It's been on market 19 days — a 2% lower offer ($173k) is reasonable based on typical stale-listing flexibility.
- 2 sale attempts since 28y ago; this cycle's ask has dropped $11k (6%) from the opening price — seller is motivated, your offer sets the floor, not the list.
Risks & watch-outs
- Watch-outs: built in 1958 — expect roof / HVAC / electrical / plumbing capex.
Questions for the listing agent
- Built in 1958 — when were the roof, HVAC, electrical panel, plumbing, and water heater last replaced?
- Is there a deadline driving the sale (1031 exchange, divorce, estate, relocation)? That informs how much negotiation room exists.
- Crime grade is F in this area — have there been break-ins, vandalism, or insurance claims at this property in the last 3 years? What carrier currently insures it and at what premium?
- The area grade is low — what's the realistic commute time and amenity access for the typical tenant pool here? Any planned neighborhood developments (good or bad) we should know about?
- What's the average days-on-market for RENTAL listings here right now (not sales)? A rising rental-DOM trend means longer vacancies and softer asking-rent achievability than the comps imply.
- What's the recent tenant-quality profile in this submarket — average credit score on applications, eviction rate, late-payment / NSF rate, and stable-employment percentage? A property-management company in the area should have these aggregated.
- How much new for-sale + rental construction is in the pipeline within 1–3 miles? Heavy new supply typically softens prices + rents 12–24 months out; constrained supply supports both.
Investment metrics
- 1% rule
- 0.84% ✗
- Cap rate
- 6.72%
- Cash-on-cash
- 1.53%
- DSCR
- 1.07
- GRM
- 9.9
CMA / ARV
- ARV (on-the-fly)
- $167,610
- Comps found
- 12
Show comp detail 12 sales within ~0.75 mi
| Address | Dist | Beds/Ba | Sqft | Sold | Price | $/sf | Match |
|---|---|---|---|---|---|---|---|
| 775 Koebel Ave | 0.25mi | 3/1.0 | 1,101 (-1%) | 10mo | $160,000 | $145 | 79 |
| 868 Koebel Ave | 0.25mi | 2/1.0 (-1) | 1,101 (-1%) | 4mo | $181,500 | $165 | 78 |
| 757 Lawndale Ave | 0.14mi | 3/1.0 | 1,066 (-4%) | 12mo | $155,000 | $145 | 77 |
| 600 Koebel Ave | 0.33mi | 2/1.0 (-1) | 1,147 (+3%) | 9mo | $125,000 | $109 | 66 |
| 2441 Wilson Ave | 0.30mi | 3/2.0 | 1,014 (-9%) | 3mo | $199,000 | $196 | 65 |
| 535 Stambaugh Ave | 0.36mi | 2/1.0 (-1) | 1,200 (+8%) | 1mo | $57,000 | $48 | 64 |
| 837 Koebel Ave | 0.26mi | 3/1.5 | 1,251 (+13%) | 2mo | $160,000 | $128 | 63 |
| 1820 Oakwood Ave | 0.73mi | 2/1.0 (-1) | 1,144 (+3%) | 10mo | $95,000 | $83 | 48 |
| 2496 Navarre Rd | 0.73mi | 3/1.0 | 980 (-12%) | 4mo | $192,000 | $196 | 43 |
| 2488 Navarre Rd | 0.73mi | 3/1.0 | 980 (-12%) | 8mo | $175,000 | $179 | 39 |
| 2501 Navarre Rd | 0.71mi | 3/1.0 | 1,268 (+14%) | 9mo | $198,000 | $156 | 36 |
| 1124 Faber Ave | 0.73mi | 3/1.5 | 962 (-13%) | 9mo | $145,000 | $151 | 34 |
Match score weights: distance 35% · size 25% · config 20% · recency 20%. Top-matched comps best support the ARV.
Projected returns pro-forma
-3.0% appreciation · 2.32% rent growth · sell at horizon
- IRR
- -14.6%
- Equity multiple
- 0.48×
- Total profit
- $-25,557
- Equity at exit
- $26,242
- IRR
- -7.0%
- Equity multiple
- 0.57×
- Total profit
- $-21,343
- Equity at exit
- $15,217
Cash invested: $49,280 (down + closing). Projections, not guarantees.
Landlord ↔ Tenant lean methodology
- Overall (STATE)
- 73 Landlord-Friendly
- State Ohio
- 73 Landlord-Friendly · R+6
- County
- — inherits STATE
- City
- — inherits STATE
ZIP-level market 43207
- Rents YoY
- 2.3%
- Active inventory
- 198
- Price-to-rent
- 9.9×
Monthly cashflow live
- Estimated rent
- $1,482 high interval (Pro) →
- Mortgage (P&I)
- −$923
- Tax from tax record
- −$111 /mo · $1,337/yr
- Insurance
- −$73
- HOA
- −$0
- Vacancy / Maint / Mgmt
- −$311
- Net cashflow
- $63
Break-even live
Sensitivity live
| Price | -10% $163 | -5% $113 | +0% $63 | +5% $13 | +10% $-37 |
|---|---|---|---|---|---|
| Rent | -10% $-54 | -5% $4 | +0% $63 | +5% $122 | +10% $180 |
| Rate | -1.0pp $152 | -0.5pp $108 | base $63 | +0.5pp $17 | +1.0pp $-29 |
UW: 25.0% down · 7.5% · 30yr · 1.5% tax · 5.0% vac · 8.0% maint · 8.0% mgmt
Financing live
Cash to close
- Down payment
- $44,000
- Closing costs
- $5,280
- Reserves months
- —
- Total cash needed
- —
Loan-product check · same deal, 3 products live
Conventional
25% down · 7.5% · 30yr
- Down + closing
- —
- Monthly P&I
- —
- Monthly cashflow
- —
- DSCR
- —
- Eligible?
- —
Personal DTI + credit; lowest rate.
DSCR
20% down · 8.5% · 30yr
- Down + closing
- —
- Monthly P&I
- —
- Monthly cashflow
- —
- DSCR
- —
- Eligible?
- —
No personal income docs; deal must DSCR.
Hard money
10% down · 12.0% · 12mo
- Down + closing
- —
- Monthly P&I
- —
- Monthly cashflow
- —
- DSCR
- —
- Eligible?
- —
Short-term bridge; refi at stabilization.
Rent comps 40 comps
| Address | Beds | Baths | Sqft | Rent | $/sqft | DOM | Units | Dist |
|---|---|---|---|---|---|---|---|---|
| 838 Lock Ave Columbus, OH | 3.0 | 1.0 | 988 | $1,578 | $1.60 | 4d | 1 | 0.15mi |
| 2491 Wilson Ave Columbus, OH | 3.0 | 1.0 | 1200 | $1,649 | $1.37 | 45d | 1 | 0.32mi |
| 1843 Parsons Ave Columbus, OH | 2.0 | 1.0 | 899 | $1,331 | $1.48 | 25d | 1 | 0.81mi |
| 257 Benfield Ave Unit NA Columbus, OH | 3.0 | 1.0 | 1094 | $1,400 | $1.28 | 9d | 1 | 0.85mi |
| 274 E Barthman Ave Columbus, OH | 2.0 | 1.0 | 960 | $1,500 | $1.56 | 19d | 1 | 0.89mi |
| 529 E Morrill Ave Columbus, OH | 3.0 | 1.0 | 1318 | $1,600 | $1.21 | 5d | 1 | 0.93mi |
| 1836 Lockbourne Rd Columbus, OH | 2.0–3.0 | 1.0–1.5 | 997 | $1,059 | $1.06 | 5d | 4 | 0.94mi |
| 1285 Evergreen Rd Columbus, OH | 3.0 | 2.0 | 888 | $1,750 | $1.97 | 21d | 1 | 0.97mi |
| 1386 Faber Ave Columbus, OH | 3.0 | 1.0 | 1250 | $1,649 | $1.32 | 9d | 1 | 1.00mi |
| 362 E Hinman Ave Columbus, OH | 2.0 | 1.0 | 879 | $1,149 | $1.31 | 45d | 1 | 1.01mi |
| 367 E Morrill Ave Columbus, OH | 2.0 | 1.0 | 977 | $1,450 | $1.48 | 45d | 1 | 1.03mi |
| 1808 S 6th St Unit 1808 Columbus, OH | 2.0 | 1.0 | 975 | $1,050 | $1.08 | 45d | 1 | 1.06mi |
| 662 Southwood Ave Columbus, OH | 3.0 | 2.0 | 1183 | $1,950 | $1.65 | 21d | 1 | 1.07mi |
| 55 Fornof Rd Columbus, OH | 1.0–4.0 | 1.0–2.0 | 924 | $1,890 | $2.04 | 3d | 1 | 1.07mi |
| 54-56 Benfield Ave Unit 56 Columbus, OH | 2.0 | 1.0 | 800 | $925 | $1.16 | 25d | 1 | 1.10mi |
| 1833 Berkeley Rd Columbus, OH | 3.0 | 1.5 | 1092 | $1,800 | $1.65 | 45d | 1 | 1.12mi |
| 206 E Woodrow Ave Columbus, OH | 2.0 | 1.0 | 999 | $1,295 | $1.30 | 45d | 1 | 1.13mi |
| 2866 Hillgate Rd Columbus, OH | 3.0 | 1.0 | 1040 | $1,693 | $1.63 | 25d | 1 | 1.14mi |
| 3047 Baker Hill Rd Columbus, OH | 3.0 | 1.0 | 896 | $1,300 | $1.45 | 45d | 1 | 1.14mi |
| 76-78 E Barthman Ave Columbus, OH | 3.0 | 1.0 | 1206 | $1,500 | $1.24 | 25d | 1 | 1.14mi |
| 476 Southwood Ave Columbus, OH | 2.0 | 1.0 | 1219 | $1,400 | $1.15 | 45d | 1 | 1.16mi |
| 546 E Jenkins Ave Unit 1 Columbus, OH | 2.0 | 1.0 | 975 | $1,295 | $1.33 | 25d | 1 | 1.17mi |
| 490-492 E Jenkins Ave Unit 490 Columbus, OH | 3.0 | 1.0 | 1050 | $1,325 | $1.26 | 45d | 1 | 1.20mi |
| 122 E Woodrow Ave Columbus, OH | 2.0 | 1.0 | 1200 | $1,450 | $1.21 | 16d | 1 | 1.22mi |
| 726 Frebis Ave Columbus, OH | 2.0 | 1.0 | 850 | $1,175 | $1.38 | 5d | 1 | 1.27mi |
| 1460 Oakwood Ave Columbus, OH | 2.0 | 1.0 | 901 | $900 | $1.00 | 45d | 1 | 1.28mi |
| 1460 Oakwood Ave Columbus, OH | 2.0 | 1.0 | 901 | $900 | $1.00 | 16d | 1 | 1.28mi |
| 1416 S Ohio Ave Columbus, OH | 3.0 | 1.5 | 1056 | $1,595 | $1.51 | 23d | 1 | 1.30mi |
| 1598-1600 S 4th St Columbus, OH | 2.0 | 1.0 | 855 | $1,250 | $1.46 | 45d | 1 | 1.32mi |
| 3204 T Ave Columbus, OH | 2.0 | 1.0 | 1168 | $1,325 | $1.13 | 25d | 1 | 1.34mi |
| 1622 Smith Rd Columbus, OH | 2.0 | 1.0 | 1045 | $1,000 | $0.96 | 5d | 1 | 1.36mi |
| 1622 Smith Rd Columbus, OH | 2.0 | 1.0 | 1045 | $1,000 | $0.96 | 21d | 1 | 1.36mi |
| 820 Hilock Rd Columbus, OH | 3.0 | 1.0 | 1200 | $1,640 | $1.37 | 45d | 1 | 1.36mi |
| 1648 Smith Rd Columbus, OH | 2.0 | 1.0 | 1250 | $1,000 | $0.80 | 45d | 1 | 1.39mi |
| 1686 Smith Rd Columbus, OH | 3.0 | 1.5 | 1200 | $1,400 | $1.17 | 45d | 1 | 1.43mi |
| 735-737 E Mithoff St Columbus, OH | 2.0 | 1.0 | 800 | $1,395 | $1.74 | 25d | 1 | 1.44mi |
| 3011 Markham Rd Unit 3011A Columbus, OH | 2.0 | 1.0 | 750 | $899 | $1.20 | 25d | 1 | 1.44mi |
| 554 E Gates St Columbus, OH | 2.0 | 1.0 | 902 | $1,295 | $1.44 | 12d | 1 | 1.44mi |
| 1776 Nason Ave Columbus, OH | 3.0 | 1.0 | 1300 | $1,500 | $1.15 | 9d | 1 | 1.47mi |
| 1776 Nason Ave Columbus, OH | 3.0 | 1.0 | 1300 | $1,500 | $1.15 | 5d | 1 | 1.47mi |
Listing history 13 events
-
2026-06-21days on market $176,000 Active 19 DOM
-
2026-06-18days on market $176,000 Active 16 DOM
-
2026-06-17days on market $176,000 Active 15 DOM
-
2026-06-16days on market $176,000 Active 14 DOM
-
2026-06-15days on market $176,000 Active 13 DOM
-
2026-06-13pricedays on market $176,000 Active 11 DOM
-
2026-06-13days on market $182,000 Active 10 DOM
-
2026-06-09days on market $182,000 Active 7 DOM
-
2026-06-08days on market $182,000 Active 6 DOM
-
2026-06-07pricedays on market $182,000 Active 5 DOM
-
2026-06-05days on market $186,900 Active 2 DOM
-
2026-06-03remarks 699-char remark
-
2026-06-03$186,900 Active 1 DOM
ⓘ Source: listings_history table (triggers on properties + properties_extension) + one-shot
backfill from property_details.listing_events for pre-trigger history.
Tax reassessment forecast OH · Partial reset (capped growth)
- Current annual tax
- $1,337 · $111/mo
- Projected year-2 tax
- $2,041 · $170/mo
- Expected delta
- +$704/yr (+$59/mo · 52.7%)
ⓘ Screening estimate from a state-policy table — verify with the county assessor before closing.
Climate risk First Street
- Flood 1/10 Low FEMA zone X (unshaded) · 0% chance over 30 yrs
- Wildfire 1/10 Low
- Heat 3/10 Moderate 7 d/yr ≥100°F today · 17 d/yr by 30 yrs out
- Wind 2/10 Low 100% chance of damaging wind over 30 yrs
- Air quality 3/10 Moderate 2 unhealthy d/yr today · 3 by 30 yrs out
Nearby sold comps map
Loading sold comps map…
Walkable amenities ~0.75 mi
Loading nearby amenities…
Taxation est. · year 1
- Rental income
- $17,783
- − Mortgage interest
- −$9,859
- − Property taxes
- −$1,337
- − Insurance
- −$880
- − Repairs & maintenance
- −$1,423
- − Management
- −$1,423
- − Depreciation
- −$5,120
- Taxable loss
- −$2,258
- Est. tax savings @ 24.0%
- +$542
- After-tax cash flow
- $1,298/yr
For passive investors: Depreciation is non-cash, so a rental often shows a tax loss while cash-flowing — sheltering income. Rental losses are passive: they offset passive income freely, and up to $25,000/yr can offset ordinary (W-2) income if you actively participate and your MAGI is under $100k (phasing out to $0 by $150k); unused losses carry forward. On sale, claimed depreciation is recaptured at up to 25%, and gains may owe capital-gains tax (a 1031 exchange can defer both). Figures are a year-1 estimate at your 24.0% rate — not tax advice; consult a CPA.
Schools (NCES district)
- District
- Columbus City School District
- NCES district ID
- 3904380
- Math proficiency
- 15% ▼ -17.00%
- Reading proficiency
- 26% ▼ -12.00%
- Median HH income
- $38,483
- Composite
- 17.19/100
- National rank
- #9105
- State rank
- #626 of 656 in OH
Livability — Columbus
- Score
- 81/100
- State rank
- #97
- US rank
- #1491
Category grades
Schools grade is shown separately in the Schools card above.
Census & demographics
- Census place
- Columbus, OH
- County
- Franklin County · 1,351,780 people
- City population
- 612,189
- Metro
- Columbus, OH
- Population (ZIP)
- 47,272
- Household income
- $63,310
- Rent vs Own
- Severe rent burden
- 1679.0
Population outlook (Franklin County) Hauer SSP2
- Today (2025)
- 1,456,139 people
- By 2030
- 1,556,890 · +6.9%
- By 2040
- 1,757,349 · +20.7%
- By 2050
- 1,950,539 · +34.0%
- By 2075
- 2,376,171 · +63.2%
- By 2100
- 2,636,796 · +81.1%
Race, ethnicity, and origin ACS 2023
- Neighborhood character
- Diverse neighborhood (Simpson 0.57)
- Race & ethnicity
- White 59% Black 28% Two or more races 7% Hispanic / Latino 5% Asian 1%
- Hispanic origin (detail)
- Mexican 3%
- Common ancestry
- Italian 2% Romanian 2% Slovak 1%
- Foreign-born
- 4% · Canada
- Languages at home
- 95% English-only · Spanish 3% Other Indo-European 1%
Political lean MEDSL · Franklin
- 2024 margin
- Strong D (+28.4) · D 63.7% · R 35.3% · Other 1.0%
- 2008→2024 swing
- +7.7pp toward D · 2008: 20.7pp · 2024: 28.4pp
- All cycles
- 2024: D+28.4 2020: D+31.4 2016: D+25.9 2012: D+21.7 2008: D+20.7
Not yet ingested
- Civics
- —
Market trends
- HPI YoY
- ▼ -244.33%
- Current HPI
- 268.3028
- Rent YoY
- ▲ 2.32%
- Metro
- Columbus, OH
- State GDP YoY
- ▲ 1.98%
- F500 in state
- 48
Industry mix (Fortune 500 HQ in OH)
| Industry | F500 HQs | Revenue |
|---|---|---|
| Insurance | 3 | $145B |
|
||
| Industrial Machinery | 3 | $49B |
|
||
| Financial Services | 3 | $24B |
|
||
| Consumer Goods | 2 | $93B |
|
||
| Aerospace / Defense | 2 | $47B |
|
||
| Utilities | 2 | $33B |
|
||
Price history
+484.1% since first listed3 events — show timeline
- 2026-06-02 Listed $186,900 CBRMLS
- 1999-02-17 Listing Removed — CBRMLS
- 1998-08-21 Listed $32,000 CBRMLS
Property tax history
+5.5%/yrLatest (2024): $1,337 · +1.3% YoY. Source: county tax records.
Cash-flow waterfall
monthlySold comps — $/sqft
last 12 mo · ≤1 miLoading sold comps…