 Triplex
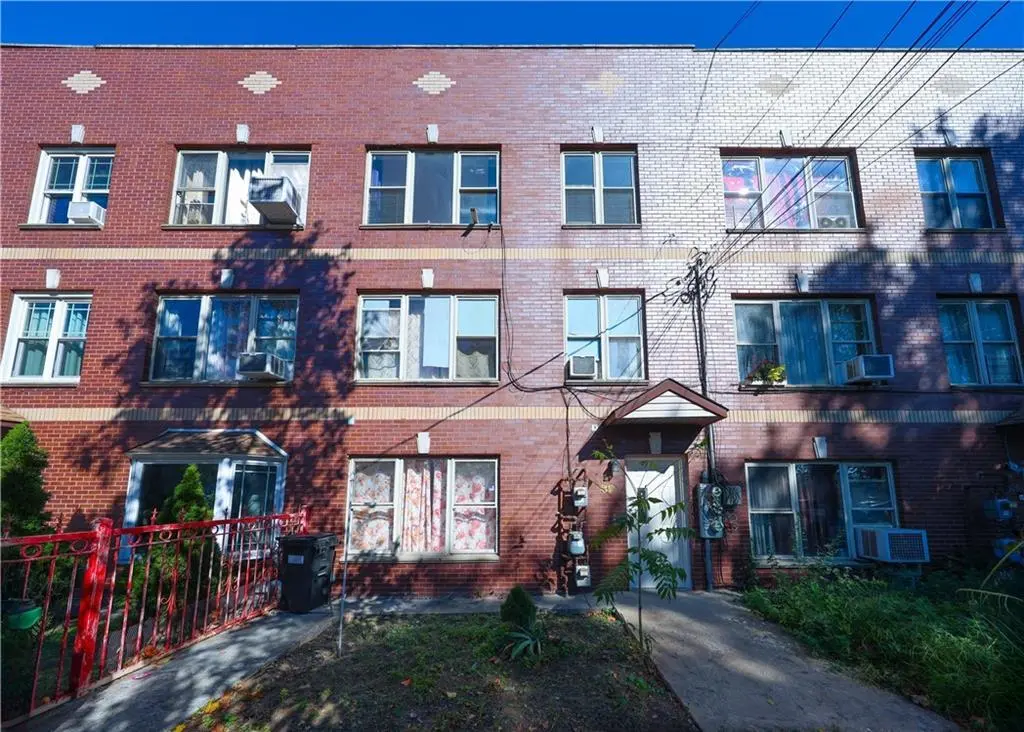
517 Milford St · New York, NY
Flood risk 5/10 · Moderate
- FEMA flood zone
- X (unshaded)
- Chance of flooding over 30 yrs
- 0.24%
- Est. flood insurance / yr
- $507 – $1,088
Fire risk 1/10 · Minimal
- Est. fire insurance / yr
- $691 – $1,283
Heat risk 7/10 · Major
- Hot days now (above 99°F)
- 7 days/yr
- Hot days in 30 yrs
- 15 days/yr
Wind risk 6/10 · Moderate
- Chance of severe wind over 30 yrs
- 65.0%
Air-quality risk 5/10 · Moderate
- Unhealthy air days now
- 6 days/yr
- Unhealthy air days in 30 yrs
- 8 days/yr
Risk factors via First Street. Map © Google.
Why this score? — see what drove the C- grade
The composite is a weighted blend of 9 inputs, each scored 0–100. Each bar is that input's sub-score; the figure is the points it added to the 100-point composite (weight × sub-score).
- Cash flow +19.0/30.0
- ARV discount +6.6/15.0
- DSCR +6.0/10.0
- Schools +5.0/10.0
- 1% rule +4.3/10.0
- Rent growth +4.0/5.0
- Livability +3.8/5.0
- Condition / age +2.5/5.0
- Appreciation +0.0/10.0
$1,180,000
🖨 Deal sheet 📄 Offer letter ✓ Due diligence
Multi-family units
County records classify this as Multi-Family (2-4 Unit). Listing-text estimate: 3 units. confirmed
Listing remarks MLS
This attached brick 3-family home in East New York offers the perfect combination of space, comfort, and flexibility for both investors and end users. The property features three stories over a finished basement, with the first-floor unit offering 2 bedrooms and 1 bathroom, while the second and third floors each feature 3 bedrooms and 1 bathroom. All units include a spacious living room, kitchen, and dining area—ideal for comfortable living or generating rental income. Built in 2006, the home remains modern and well-maintained, with separate gas and electric meters and individual boilers for each unit, allowing for convenient and efficient management. A community driveway at the rear provides multiple parking spaces, adding valuable convenience for residents and guests. Building size 21x49 over 21x100 lot. Located in a prime East New York residential area, the property is close to shopping, schools, parks, and restaurants. Enjoy excellent access to public transportation with nearby bus lines (B20, B15, B6, B84, BM5) and the New Lots Avenue station serving the 2, 3, 4, and 5 trains, offering a quick and easy commute throughout Brooklyn and beyond.
Key facts
- 2,100 sq ft lot
- Built 2006
- Listed 37 days
Property features AI
Finance
- Financial info: Tax year 2024
Exterior
- Parking: No carport; Other parking features
- Utilities: Sewer: Other; Utilities: See remarks
- Home design: Triplex; Total building area approximately 3,087 sq ft
- Construction: Brick building
- Exterior features: Brick construction; Not waterfront
Interior
- Bedrooms: Two 3-bedroom units; One 2-bedroom unit
- Bathrooms: Three full bathrooms
- Heating & cooling: Natural gas heating; Wall/window air conditioning units; Other heating
- Interior features: Finished full basement; Other interior features
Neighborhood map
What this means for you Summary
Snapshot
- This is a 3 × 3-bed/1.0-bath units multifamily listed at $1.18M.
Deal economics
- At list price, monthly cash flow is $1k ($15k/yr) — positive. Per door: $409/mo.
- The deal already cash-flows at list — no discount required.
- To meet the 1% rule (rent ≥ 1% of price), the offer needs to be $1.10M (6.7% below list).
- Recommended offer: $1.10M (6.7% below list) — sets the bar for 1% rule.
- Cap rate 7.5% vs local median 2.6% in New York — top-decile yield for the area; either an underpriced asset or a hidden risk that comps aren't pricing in. Stress-test before assuming the spread holds.
Location & tenants
- Location reads 75/100 on livability (#268 in NY, #4,188 nationally) — a middle-class / working-renter tenant base. Strengths: amenities A+, commute A+, health & safety A; Watch: crime F, cost of living F.
- Market conditions: Rents rising fast (+6.1%/yr); 192 active listings in the ZIP; 10,063 units permitted in Kings County in 2024 (9,789 in 5+ unit buildings).
- At $11,012/mo this rent would consume 213% of the median local household income ($62k/yr) (locally 7574% of renters already pay >50% of income on rent) — very limited rent-growth headroom before tenants either downsize or default.
Forward outlook
- Local home prices are declining (-3.0%/yr); year-one equity from $8k of loan paydown is wiped out by about $35k of value loss. Plan a longer hold.
- Kings County population projected at +13% by 2050 — modest demand growth; plan on rents tracking national, not racing it.
Negotiation context
- It's been on market 37 days — a 3% lower offer ($1.14M) is reasonable based on typical stale-listing flexibility.
- 3 sale attempts with the ask held roughly flat each time — persistent listings suggest the price (not the market) is what's stuck; bring a comps-based counter.
- Current owner paid $749k; list at $1.18M implies a 58% gain — meaningful room to come down on a strong offer.
Risks & watch-outs
- Climate carrying-cost: moderate flood risk; major wind risk, 65% chance of damaging wind over 30y; extreme-heat days projected 7→15/yr by 2055 (HVAC capex compounding) — expect insurance premiums to compound above CPI over the hold.
Questions for the listing agent
- It's been on market 37 days. Have you received any prior offers? Is the seller open to a 7% concession, seller financing, or rate buy-down credit?
- Can we see the unit-by-unit rent roll, current vacancy, and any below-market leases? What's the average tenancy length?
- What capital expenditures (roof, boiler, parking lot, exteriors) have been made in the last 5 years, and what's planned in the next 2?
- Is there a deadline driving the sale (1031 exchange, divorce, estate, relocation)? That informs how much negotiation room exists.
- Schools are B-rated — typically a magnet for longer-tenancy family renters. What's the average tenant stay here, and is there a school-zone premium baked into asking?
- Crime grade is F in this area — have there been break-ins, vandalism, or insurance claims at this property in the last 3 years? What carrier currently insures it and at what premium?
- What's the average days-on-market for RENTAL listings here right now (not sales)? A rising rental-DOM trend means longer vacancies and softer asking-rent achievability than the comps imply.
- What's the recent tenant-quality profile in this submarket — average credit score on applications, eviction rate, late-payment / NSF rate, and stable-employment percentage? A property-management company in the area should have these aggregated.
- How much new apartment / multifamily construction is in the pipeline within 1–3 miles? Heavy new supply (>2% of stock underway) typically softens rents 12–24 months out; light construction supports rent growth.
Investment metrics
- 1% rule
- 0.93% ✗
- Cap rate
- 7.54%
- Cash-on-cash
- 4.46%
- DSCR
- 1.20
- GRM
- 8.9
CMA / ARV
- ARV (on-the-fly)
- $1,157,625
- Comps found
- 7
Show comp detail 7 sales within ~0.75 mi
| Address | Dist | Beds/Ba | Sqft | Sold | Price | $/sf | Match |
|---|---|---|---|---|---|---|---|
| 369 Milford St | 0.26mi | 8/1.0 (-1) | 3,198 (+4%) | 5mo | $1,200,000 | $375 | 65 |
| 1017 Dumont Ave | 0.41mi | 8/4.0 (-1) | 3,116 (+1%) | 17mo | $618,500 | $198 | 57 |
| 301 Montauk Ave | 0.37mi | 8/3.0 (-1) | 2,730 (-12%) | 11mo | $985,000 | $361 | 50 |
| 448 Ashford St #3 | 0.65mi | 8/5.0 (-1) | 2,970 (-4%) | 3mo | $1,250,000 | $421 | 48 |
| 1140 Sutter Ave | 0.39mi | 8/3.0 (-1) | 3,420 (+11%) | 19mo | $694,785 | $203 | 43 |
| 390 Essex St | 0.70mi | 8/5.0 (-1) | 2,812 (-9%) | 8mo | $1,140,000 | $405 | 32 |
| 306 Sheridan Ave | 0.67mi | 8/5.0 (-1) | 2,652 (-14%) | 19mo | $1,000,000 | $377 | 16 |
Match score weights: distance 35% · size 25% · config 20% · recency 20%. Top-matched comps best support the ARV.
Projected returns pro-forma
-3.0% appreciation · 6.14% rent growth · sell at horizon
- IRR
- -6.1%
- Equity multiple
- 0.77×
- Total profit
- $-77,438
- Equity at exit
- $175,942
- IRR
- 6.7%
- Equity multiple
- 1.57×
- Total profit
- $189,230
- Equity at exit
- $102,025
Cash invested: $330,400 (down + closing). Projections, not guarantees.
Landlord ↔ Tenant lean methodology
- Overall (CITY)
- 0 Strongly Tenant-Friendly
- State New York
- 15 Strongly Tenant-Friendly · D+10
- County
- — inherits STATE
- City New York
- 0 Strongly Tenant-Friendly · D+34
ZIP-level market 11208
- Rents YoY
- 6.1%
- Active inventory
- 192
- Price-to-rent
- 26.8×
Monthly cashflow live
- Estimated rent
- $11,012 high interval (Pro) →
- Mortgage (P&I)
- −$6,188
- Tax from tax record
- −$793 /mo · $9,514/yr
- Insurance
- −$492
- HOA
- −$0
- Vacancy / Maint / Mgmt
- −$2,313
- Net cashflow
- $1,227
Break-even live
3-unit breakdown (identical units grouped — click to expand)
| Units | Beds | Baths | Est. rent |
|---|---|---|---|
| 3× units | 3 | 1 | $11,013 |
| #1 | 3 | 1 | $3,671 |
| #2 | 3 | 1 | $3,671 |
| #3 | 3 | 1 | $3,671 |
| Total (3 units) | $11,012 | ||
UW: 25.0% down · 7.5% · 30yr · 1.5% tax · 5.0% vac · 8.0% maint · 8.0% mgmt
Financing live
Cash to close
- Down payment
- $295,000
- Closing costs
- $35,400
- Reserves months
- —
- Total cash needed
- —
Loan-product check · same deal, 3 products live
Conventional
25% down · 7.5% · 30yr
- Down + closing
- —
- Monthly P&I
- —
- Monthly cashflow
- —
- DSCR
- —
- Eligible?
- —
Personal DTI + credit; lowest rate.
DSCR
20% down · 8.5% · 30yr
- Down + closing
- —
- Monthly P&I
- —
- Monthly cashflow
- —
- DSCR
- —
- Eligible?
- —
No personal income docs; deal must DSCR.
Hard money
10% down · 12.0% · 12mo
- Down + closing
- —
- Monthly P&I
- —
- Monthly cashflow
- —
- DSCR
- —
- Eligible?
- —
Short-term bridge; refi at stabilization.
Listing history 12 events
-
2026-06-08statusdays on market $1,180,000 Pending 37 DOM
-
2026-06-04days on market $1,180,000 Active 36 DOM
-
2026-06-03days on market $1,180,000 Active 35 DOM
-
2026-06-01days on market $1,180,000 Active 33 DOM
-
2026-05-31days on market $1,180,000 Active 32 DOM
-
2026-04-29$1,180,000 Active
Show marketing remark (1170 chars)
This attached brick 3-family home in East New York offers the perfect combination of space, comfort, and flexibility for both investors and end users. The property features three stories over a finished basement, with the first-floor unit offering 2 bedrooms and 1 bathroom, while the second and third floors each feature 3 bedrooms and 1 bathroom. All units include a spacious living room, kitchen, and dining area—ideal for comfortable living or generating rental income. Built in 2006, the home remains modern and well-maintained, with separate gas and electric meters and individual boilers for each unit, allowing for convenient and efficient management. A community driveway at the rear provides multiple parking spaces, adding valuable convenience for residents and guests. Building size 21x49 over 21x100 lot. Located in a prime East New York residential area, the property is close to shopping, schools, parks, and restaurants. Enjoy excellent access to public transportation with nearby bus lines (B20, B15, B6, B84, BM5) and the New Lots Avenue station serving the 2, 3, 4, and 5 trains, offering a quick and easy commute throughout Brooklyn and beyond.
-
2026-04-29$1,180,000 Active 1170-char remark
Show marketing remark (1170 chars)
This attached brick 3-family home in East New York offers the perfect combination of space, comfort, and flexibility for both investors and end users. The property features three stories over a finished basement, with the first-floor unit offering 2 bedrooms and 1 bathroom, while the second and third floors each feature 3 bedrooms and 1 bathroom. All units include a spacious living room, kitchen, and dining area—ideal for comfortable living or generating rental income. Built in 2006, the home remains modern and well-maintained, with separate gas and electric meters and individual boilers for each unit, allowing for convenient and efficient management. A community driveway at the rear provides multiple parking spaces, adding valuable convenience for residents and guests. Building size 21x49 over 21x100 lot. Located in a prime East New York residential area, the property is close to shopping, schools, parks, and restaurants. Enjoy excellent access to public transportation with nearby bus lines (B20, B15, B6, B84, BM5) and the New Lots Avenue station serving the 2, 3, 4, and 5 trains, offering a quick and easy commute throughout Brooklyn and beyond.
-
2025-12-10status Pending
-
2025-12-10historical
-
2025-10-23$1,099,000 Active
-
2006-12-04soldstatus $749,000
-
2006-12-04soldstatus $749,000
ⓘ Source: listings_history table (triggers on properties + properties_extension) + one-shot
backfill from property_details.listing_events for pre-trigger history.
Tax reassessment forecast NY · Partial reset (capped growth)
- Current annual tax
- $9,514 · $793/mo
- Projected year-2 tax
- $14,728 · $1,227/mo
- Expected delta
- +$5,214/yr (+$434/mo · 54.8%)
ⓘ Screening estimate from a state-policy table — verify with the county assessor before closing.
Climate risk First Street
- Flood 5/10 Major FEMA zone X (unshaded) · 24% chance over 30 yrs
- Wildfire 1/10 Low
- Heat 7/10 Severe 7 d/yr ≥99°F today · 15 d/yr by 30 yrs out
- Wind 6/10 Major 65% chance of damaging wind over 30 yrs
- Air quality 5/10 Major 6 unhealthy d/yr today · 8 by 30 yrs out
Nearby sold comps map
Loading sold comps map…
Walkable amenities ~0.75 mi
Loading nearby amenities…
Taxation est. · year 1
- Rental income
- $132,144
- − Mortgage interest
- −$66,098
- − Property taxes
- −$9,514
- − Insurance
- −$5,900
- − Repairs & maintenance
- −$10,572
- − Management
- −$10,572
- − Depreciation
- −$34,327
- Taxable loss
- −$4,839
- Est. tax savings @ 24.0%
- +$1,161
- After-tax cash flow
- $15,884/yr
For passive investors: Depreciation is non-cash, so a rental often shows a tax loss while cash-flowing — sheltering income. Rental losses are passive: they offset passive income freely, and up to $25,000/yr can offset ordinary (W-2) income if you actively participate and your MAGI is under $100k (phasing out to $0 by $150k); unused losses carry forward. On sale, claimed depreciation is recaptured at up to 25%, and gains may owe capital-gains tax (a 1031 exchange can defer both). Figures are a year-1 estimate at your 24.0% rate — not tax advice; consult a CPA.
Schools (NCES district)
No district data.
Livability — New York
- Score
- 75/100
- State rank
- #268
- US rank
- #4188
Category grades
Schools grade is shown separately in the Schools card above.
Census & demographics
- Census place
- New York, NY
- County
- Kings County · 2,614,986 people
- City population
- 7,731,280
- Metro
- New York-Newark-Jersey City, NY-NJ-PA
- Population (ZIP)
- 105,428
- Household income
- $62,077
- Rent vs Own
- Severe rent burden
- 7574.0
Population outlook (Kings County) Hauer SSP2
- Today (2025)
- 2,847,441 people
- By 2030
- 2,937,006 · +3.1%
- By 2040
- 3,095,491 · +8.7%
- By 2050
- 3,228,968 · +13.4%
- By 2075
- 3,321,723 · +16.7%
- By 2100
- 3,111,387 · +9.3%
Race, ethnicity, and origin ACS 2023
- Neighborhood character
- Diverse neighborhood (Simpson 0.66)
- Race & ethnicity
- Black 42% Hispanic / Latino 39% Asian 10% Two or more races 8% White 3%
- Hispanic origin (detail)
- Mexican 2% Puerto Rican 9% Dominican 16%
- Common ancestry
- Hispanic 1%
- Foreign-born
- 40% · Canada, China, Mexico
- Languages at home
- 48% English-only · Spanish 36% Other Indo-European 11% French/Haitian/Cajun 1%
Political lean MEDSL · Kings
- 2024 margin
- Solid D (+44.0) · D 72.0% · R 28.0%
- 2008→2024 swing
- -15.5pp toward R · 2008: 59.4pp · 2024: 44.0pp
- All cycles
- 2024: D+44.0 2020: D+54.8 2016: D+61.8 2012: D+63.9 2008: D+59.4
Not yet ingested
- Civics
- —
Market trends
- HPI YoY
- ▼ -546.38%
- Current HPI
- 376.1489
- Rent YoY
- ▲ 6.14%
- Metro
- New York-Newark-Jersey City, NY-NJ-PA
- State GDP YoY
- ▲ 2.60%
- F500 in state
- 92
Industry mix (Fortune 500 HQ in NY)
| Industry | F500 HQs | Revenue |
|---|---|---|
| Financial Services | 10 | $950B |
|
||
| Consumer Goods | 9 | $162B |
|
||
| Insurance | 4 | $225B |
|
||
| Telecommunications | 2 | $144B |
|
||
| Pharmaceuticals | 2 | $112B |
|
||
| Media / Entertainment | 2 | $69B |
|
||
Price history
+57.5% since first listed7 events — show timeline
- 2026-04-29 Listed $1,180,000 BNYMLS
- 2026-04-29 Listed $1,180,000 OneKey® MLS as Distributed by MLS Grid
- 2025-12-10 Pending — OneKey® MLS as Distributed by MLS Grid
- 2025-12-10 Listing Removed — OneKey® MLS as Distributed by MLS Grid
- 2025-10-23 Listed $1,099,000 OneKey® MLS as Distributed by MLS Grid
- 2006-12-04 Sold (Public Records) $749,000 Public Records
- 2006-12-04 Sold (Public Records) $749,000 Public Records
Property tax history
+2.3%/yrLatest (2025): $9,514 · +3.4% YoY. Source: county tax records.
Cash-flow waterfall
monthlySold comps — $/sqft
last 12 mo · ≤1 miLoading sold comps…