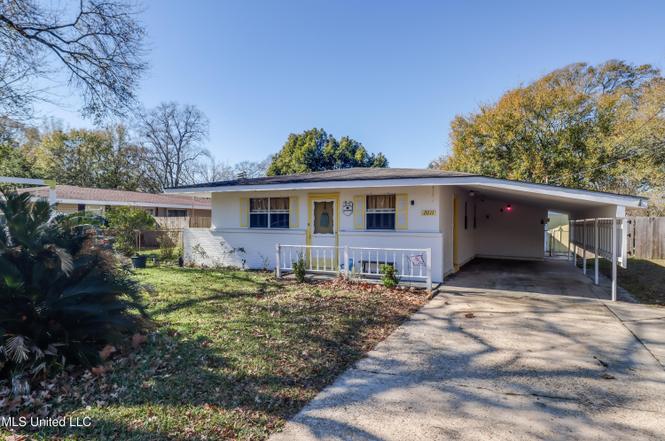
2011 Woodmont St · Pascagoula, MS
Flood risk 6/10 · Moderate
- FEMA flood zone
- AE
- Chance of flooding over 30 yrs
- 0.68%
- Est. flood insurance / yr
- $1,737 – $8,500
Fire risk 1/10 · Minimal
- Est. fire insurance / yr
- $1,241 – $2,305
Heat risk 10/10 · Severe
- Hot days now (above 105°F)
- 7 days/yr
- Hot days in 30 yrs
- 23 days/yr
Wind risk 9/10 · Severe
- Chance of severe wind over 30 yrs
- 99.0%
Air-quality risk 3/10 · Minor
- Unhealthy air days now
- 2 days/yr
- Unhealthy air days in 30 yrs
- 3 days/yr
Risk factors via First Street. Map © Google.
Why this score? — see what drove the B grade
The composite is a weighted blend of 9 inputs, each scored 0–100. Each bar is that input's sub-score; the figure is the points it added to the 100-point composite (weight × sub-score).
- Cash flow +29.0/30.0
- ARV discount +15.0/15.0
- DSCR +10.0/10.0
- 1% rule +7.3/10.0
- Livability +3.5/5.0
- Schools +3.3/10.0
- Rent growth +2.5/5.0
- Condition / age +2.5/5.0
- Appreciation +0.0/10.0
$120,000
🖨 Deal sheet (PDF) 📄 Offer letter ✓ Due diligence
Listing remarks
Seller says bring all offers! Welcome to this classic 3-bedroom, 2-bath bungalow full of character and potential, located in the heart of Pascagoula, MS. Built in 1958, this home offers a spacious layout highlighted by a large primary bedroom, providing a comfortable private retreat. The inviting living areas create a warm, welcoming atmosphere perfect for everyday living or entertaining. Outside, you'll find a convenient carport along with two on-site sheds, offering plenty of storage for tools, hobbies, or outdoor equipment. Whether you're a first-time buyer, downsizing, or looking for an investment opportunity, this property delivers versatility and value. With a little vision, this cha
Key facts
- On-site sheds
- Carport
- Spacious layout
Tags
Property features AI
Finance
- HOA & community: Community amenities: Boating, Park, Playground, Pool, Restaurant, Sports Fields, Tennis Courts
Exterior
- Parking: Carport (1 space); Driveway; Concrete surfaces; 2 total parking spaces
- Security: Other security features
- Utilities: Public water; Public sewer; Electricity connected; Natural gas connected; Sewer connected; Water connected; Cable available
- Home design: Single family residence (house); One story; Move-in ready
- Construction: Wood siding; Asphalt shingle roof; Slab foundation; Year built reported by owner; Living area reported by owner
- Exterior features: Deck; Shed(s); Front yard; Few trees; Fenced yard (vinyl and wood); City lot
Interior
- Kitchen: Range hood; Natural gas in kitchen
- Flooring: Tile
- Bathrooms: 2 full bathrooms
- Heating & cooling: Central heating (natural gas); Heat pump; Central air; Ceiling fans
- Interior features: Ceiling fans; Laminate counters; Walk-in closet(s); Dead bolt locks; Aluminum frame windows; Outside fireplace
- Laundry & utility: Washer hookup; Electric dryer hookup; Laundry closet; Gas water heater
Neighborhood map
What this means for you Summary
Snapshot
- This is a 3-bed/2.0-bath single-family listed at $120k.
Deal economics
- At list price, monthly cash flow is $-15 ($-182/yr) — negative.
- To cash-flow at today's rent, offer at most $117k (2.2% below list).
- Meets the 1% rule at list price ($1k rent vs $120k).
- Recommended offer: $106k (12.0% below list) — sets the bar for market timing.
- Cap rate 10.4% vs local median 4.3% in Pascagoula — top-decile yield for the area; either an underpriced asset or a hidden risk that comps aren't pricing in. Stress-test before assuming the spread holds.
Location & tenants
- Location reads 70/100 on livability (#41 in MS) — a middle-class / working-renter tenant base. Strengths: cost of living A+, housing A+, health & safety A+; Watch: crime F, amenities D-, commute F.
- Pascagoula-Gautier School District (urban): math 40% / reading 38% proficiency, ranked #41 of 130 in MS (top 32%) — families likely to look elsewhere, expect single-tenant / working-renter base with shorter leases; 78% free/reduced lunch — lower-income household profile, screen leases tightly.
- Zoned schools: Eastlawn Elementary School (math 37% / reading 42%, grade F, #122 of 375 statewide, top 34%, 327 students, 100% FRL); William M Colmer Middle School (math 43% / reading 34%, grade F, #69 of 179 statewide, top 40%, 554 students, 100% FRL); Pascagoula High School (math 42% / reading 39%, grade F, #51 of 197 statewide, top 26%, 1,187 students, 100% FRL) — zoned schools average 100% FRL vs 78% district-wide (22 pts higher); higher-poverty schools than district average — tighter screening recommended.
- Market conditions: 86 active listings in the ZIP; 9 comparable units currently listed for rent nearby; rentals at typical pace (median 16d on market — plan ~3-4 weeks tenant-placement turnaround); 516 units permitted in Jackson County in 2024 (6 in 5+ unit buildings).
Forward outlook
- Local home prices are declining (-3.0%/yr); year-one equity from $830 of loan paydown is wiped out by about $4k of value loss. Plan a longer hold.
Negotiation context
- It's been on market 143 days — a 12% lower offer ($106k) is reasonable based on typical stale-listing flexibility.
Risks & watch-outs
- Watch-outs: flood insurance adds $427/mo; built in 1958 — expect roof / HVAC / electrical / plumbing capex.
- Climate carrying-cost: in FEMA flood zone AE (mandatory federal flood insurance); severe wind risk, 99% chance of damaging wind over 30y; extreme-heat days projected 7→23/yr by 2055 (HVAC capex compounding) — expect insurance premiums to compound above CPI over the hold.
Questions for the listing agent
- What do current leases actually rent for vs. the listed asking? Can we see a recent rent roll and the last 12 months of T-12 income?
- It's been on market 143 days. Have you received any prior offers? Is the seller open to a 12% concession, seller financing, or rate buy-down credit?
- Built in 1958 — when were the roof, HVAC, electrical panel, plumbing, and water heater last replaced?
- What's the actual annual flood-insurance premium (NFIP or private), and is the property in a SFHA with mandatory coverage?
- Why hasn't it sold? Are there any deal-killer items the seller is aware of (foundation, flood, title, zoning, code violations)?
- Is there a deadline driving the sale (1031 exchange, divorce, estate, relocation)? That informs how much negotiation room exists.
- Crime grade is F in this area — have there been break-ins, vandalism, or insurance claims at this property in the last 3 years? What carrier currently insures it and at what premium?
- What's the average days-on-market for RENTAL listings here right now (not sales)? A rising rental-DOM trend means longer vacancies and softer asking-rent achievability than the comps imply.
- What's the recent tenant-quality profile in this submarket — average credit score on applications, eviction rate, late-payment / NSF rate, and stable-employment percentage? A property-management company in the area should have these aggregated.
- How much new for-sale + rental construction is in the pipeline within 1–3 miles? Heavy new supply typically softens prices + rents 12–24 months out; constrained supply supports both.
Investment metrics
- 1% rule
- 1.23% ✓
- Cap rate
- 10.41%
- Cash-on-cash
- 14.69%
- DSCR
- 1.65
- GRM
- 6.8
CMA / ARV
- ARV (on-the-fly)
- $145,350
- Comps found
- 12
Show comp detail 12 sales within ~0.75 mi
| Address | Dist | Beds/Ba | Sqft | Sold | Price | $/sf | Match |
|---|---|---|---|---|---|---|---|
| 2108 Glendale St | 0.16mi | 3/2.0 | 1,285 (+1%) | 2mo | $165,000 | $128 | 90 |
| 2005 23rd St | 0.31mi | 3/1.0 | 1,248 (-2%) | 0mo | $49,900 | $40 | 78 |
| 1910 Meadowbrook St | 0.06mi | 2/0.5 (-1) | 1,144 (-10%) | 11mo | $100,000 | $87 | 60 |
| 2417 Tyler Ave | 0.43mi | 3/2.0 | 1,120 (-12%) | 2mo | $145,000 | $129 | 58 |
| 2907 Larchmont St Unit Na | 0.53mi | 3/1.5 | 1,152 (-10%) | 0mo | $149,900 | $130 | 57 |
| 2004 Martin St | 0.56mi | 3/1.5 | 1,191 (-7%) | 9mo | $129,990 | $109 | 54 |
| 2206 Belair St | 0.17mi | 2/2.0 (-1) | 1,085 (-15%) | 11mo | $139,900 | $129 | 53 |
| 2208 Kingsberry Ave | 0.59mi | 4/3.0 (+1) | 1,364 (+7%) | 0mo | $130,000 | $95 | 52 |
| 2706 N Martin St | 0.70mi | 3/2.0 | 1,161 (-9%) | 3mo | $89,500 | $77 | 50 |
| 3313 Ronnie Avenue Ave | 0.42mi | 3/1.0 | 1,100 (-14%) | 10mo | $134,500 | $122 | 46 |
| 2221 Kingsberry Ave | 0.58mi | 3/1.0 | 1,100 (-14%) | 3mo | $124,900 | $114 | 43 |
| 1811 Wilson Ave | 0.74mi | 3/1.0 | 1,092 (-14%) | 7mo | $45,000 | $41 | 31 |
Match score weights: distance 35% · size 25% · config 20% · recency 20%. Top-matched comps best support the ARV.
Projected returns pro-forma
-3.0% appreciation · 3.0% rent growth · sell at horizon
- IRR
- -16.9%
- Equity multiple
- 0.40×
- Total profit
- $-20,170
- Equity at exit
- $17,892
- IRR
- -8.4%
- Equity multiple
- 0.47×
- Total profit
- $-17,831
- Equity at exit
- $10,375
Cash invested: $33,600 (down + closing). Projections, not guarantees.
Landlord ↔ Tenant lean methodology
- Overall (STATE)
- 90 Strongly Landlord-Friendly
- State Mississippi
- 90 Strongly Landlord-Friendly · R+11
- County
- — inherits STATE
- City
- — inherits STATE
ZIP-level market 39567
- Home prices YoY
- -26.0%
- Active inventory
- 86
- Price-to-rent
- 6.8×
Monthly cashflow live
- Estimated rent
- $1,479 high interval (Pro) →
- Mortgage (P&I)
- −$629
- Tax from tax record
- −$78 /mo · $936/yr
- Insurance
- −$50
- Flood insurance flood zone
- −$427 /mo · $5,118/yr
- HOA
- −$0
- Vacancy / Maint / Mgmt
- −$311
- Net cashflow
- $-15
Break-even live
Sensitivity live
| Price | -10% $53 | -5% $19 | +0% $-15 | +5% $-49 | +10% $-83 |
|---|---|---|---|---|---|
| Rent | -10% $-132 | -5% $-74 | +0% $-15 | +5% $43 | +10% $102 |
| Rate | -1.0pp $45 | -0.5pp $15 | base $-15 | +0.5pp $-46 | +1.0pp $-78 |
UW: 25.0% down · 7.5% · 30yr · 1.5% tax · 5.0% vac · 8.0% maint · 8.0% mgmt
Financing live
Cash to close
- Down payment
- $30,000
- Closing costs
- $3,600
- Reserves months
- —
- Total cash needed
- —
Loan-product check · same deal, 3 products live
Conventional
25% down · 7.5% · 30yr
- Down + closing
- —
- Monthly P&I
- —
- Monthly cashflow
- —
- DSCR
- —
- Eligible?
- —
Personal DTI + credit; lowest rate.
DSCR
20% down · 8.5% · 30yr
- Down + closing
- —
- Monthly P&I
- —
- Monthly cashflow
- —
- DSCR
- —
- Eligible?
- —
No personal income docs; deal must DSCR.
Hard money
10% down · 12.0% · 12mo
- Down + closing
- —
- Monthly P&I
- —
- Monthly cashflow
- —
- DSCR
- —
- Eligible?
- —
Short-term bridge; refi at stabilization.
Rent comps 9 comps
| Address | Beds | Baths | Sqft | Rent | $/sqft | DOM | Units | Dist |
|---|---|---|---|---|---|---|---|---|
| 1810 12th St Pascagoula, MS | 2.0 | 1.0 | 925 | $1,100 | $1.19 | 15d | 1 | 0.51mi |
| 3015 Eden St Pascagoula, MS | 1.0–3.0 | 1.0–1.5 | 875 | $1,430 | $1.63 | 15d | 43 | 0.66mi |
| 2706 Martin St Pascagoula, MS | 3.0 | 2.0 | 1200 | $1,600 | $1.33 | 23d | 1 | 0.72mi |
| 3000 Brazil St Pascagoula, MS | 1.0–3.0 | 1.0 | 695 | $1,430 | $2.06 | 15d | 12 | 0.89mi |
| 4610 Legare Ave Pascagoula, MS | 3.0 | 1.0 | 975 | $1,250 | $1.28 | 23d | 1 | 1.10mi |
| 3801 Melton Dr Pascagoula, MS | 1.0–3.0 | 1.0–2.0 | 825 | $1,430 | $1.73 | 15d | 43 | 1.15mi |
| 4315 Orchard Ave Pascagoula, MS | 2.0 | 1.5 | 921 | $1,267 | $1.37 | 15d | 21 | 1.27mi |
| 1102 Tucker Ave Pascagoula, MS | 3.0 | 2.0 | 1418 | $1,500 | $1.06 | 23d | 1 | 1.28mi |
| 2002 Ducayet St Pascagoula, MS | 3.0 | 2.0 | 1075 | $1,400 | $1.30 | 23d | 1 | 1.36mi |
Listing history 20 events
-
2026-06-22days on market $120,000 Active 143 DOM
-
2026-06-18days on market $120,000 Active 140 DOM
-
2026-06-17days on market $120,000 Active 139 DOM
-
2026-06-16days on market $120,000 Active 138 DOM
-
2026-06-15days on market $120,000 Active 137 DOM
-
2026-06-14days on market $120,000 Active 135 DOM
-
2026-06-13days on market $120,000 Active 134 DOM
-
2026-06-10days on market $120,000 Active 132 DOM
-
2026-06-09days on market $120,000 Active 131 DOM
-
2026-06-08days on market $120,000 Active 130 DOM
-
2026-06-07pricedays on market $120,000 Active 129 DOM
-
2026-06-02days on market $124,900 Active 124 DOM
-
2026-06-01days on market $124,900 Active 123 DOM
-
2026-05-31days on market $124,900 Active 122 DOM
-
2026-05-30days on market $124,900 Active 121 DOM
-
2026-05-07price $124,900
-
2026-04-17price $128,000
-
2026-03-24price $134,000
-
2026-03-07price $139,900
-
2026-01-29$149,900 Active
ⓘ Source: listings_history table (triggers on properties + properties_extension) + one-shot
backfill from property_details.listing_events for pre-trigger history.
Tax reassessment forecast MS · Resets to sale price
- Current annual tax
- $936 · $78/mo
- Projected year-2 tax
- $948 · $79/mo
- Expected delta
- +$12/yr (+$1/mo · 1.3%)
ⓘ Screening estimate from a state-policy table — verify with the county assessor before closing.
Climate risk First Street
- Flood 6/10 Major FEMA zone AE · 68% chance over 30 yrs
- Wildfire 1/10 Low
- Heat 10/10 Extreme 7 d/yr ≥105°F today · 23 d/yr by 30 yrs out
- Wind 9/10 Extreme 99% chance of damaging wind over 30 yrs
- Air quality 3/10 Moderate 2 unhealthy d/yr today · 3 by 30 yrs out
Nearby sold comps map
Loading sold comps map…
Walkable amenities ~0.75 mi
Loading nearby amenities…
Taxation est. · year 1
- Rental income
- $17,752
- − Mortgage interest
- −$6,722
- − Property taxes
- −$936
- − Insurance
- −$5,718
- − Repairs & maintenance
- −$1,420
- − Management
- −$1,420
- − Depreciation
- −$3,491
- Taxable loss
- −$1,956
- Est. tax savings @ 24.0%
- +$469
- After-tax cash flow
- $287/yr
For passive investors: Depreciation is non-cash, so a rental often shows a tax loss while cash-flowing — sheltering income. Rental losses are passive: they offset passive income freely, and up to $25,000/yr can offset ordinary (W-2) income if you actively participate and your MAGI is under $100k (phasing out to $0 by $150k); unused losses carry forward. On sale, claimed depreciation is recaptured at up to 25%, and gains may owe capital-gains tax (a 1031 exchange can defer both). Figures are a year-1 estimate at your 24.0% rate — not tax advice; consult a CPA.
Schools (NCES district)
- District
- Pascagoula-Gautier School District
- NCES district ID
- 2803480
- Math proficiency
- 40% ▼ -3.00%
- Reading proficiency
- 38% ▼ -4.00%
- Median HH income
- $41,392
- Composite
- 32.86/100
- National rank
- #5613
- State rank
- #41 of 130 in MS
Livability — Pascagoula
- Score
- 70/100
- State rank
- #41
- US rank
- #7866
Category grades
Schools grade is shown separately in the Schools card above.
Census & demographics
- Census place
- Pascagoula, MS
- County
- Jackson County · 82,196 people
- City population
- 21,731
- Metro
- Gulfport-Biloxi, MS
- Population (ZIP)
- 10,341
- Household income
- $62,254
- Rent vs Own
- Severe rent burden
- 308.0
Population outlook (Jackson County) Hauer SSP2
- Today (2025)
- 146,926 people
- By 2030
- 148,442 · +1.0%
- By 2040
- 149,631 · +1.8%
- By 2050
- 148,723 · +1.2%
- By 2075
- 147,845 · +0.6%
- By 2100
- 144,510 · -1.6%
Race, ethnicity, and origin ACS 2023
- Neighborhood character
- Diverse neighborhood (Simpson 0.60)
- Race & ethnicity
- White 52% Black 34% Hispanic / Latino 9% Two or more races 6%
- Hispanic origin (detail)
- Mexican 1% Puerto Rican 3% Dominican 3%
- Common ancestry
- Lithuanian 4% Italian 2% Slovak 1%
- Foreign-born
- 2% · Canada, Guatemala
- Languages at home
- 91% English-only · Spanish 9%
Political lean MEDSL · Jackson
- 2024 margin
- Solid R (+39.9) · D 29.5% · R 69.4% · Other 1.1%
- 2008→2024 swing
- -6.4pp toward R · 2008: -33.5pp · 2024: -39.9pp
- All cycles
- 2024: R+39.9 2020: R+34.6 2016: R+39.9 2012: R+36.1 2008: R+33.5
Not yet ingested
- Civics
- —
Market trends
- HPI YoY
- ▼ -57.05%
- Current HPI
- 162.4666
- Rent YoY
- —
- Metro
- Gulfport-Biloxi, MS
- State GDP YoY
- —
- F500 in state
- 0
Price history
-16.7% since first listed5 events — show timeline
- 2026-05-07 Price Changed $124,900 MLSU
- 2026-04-17 Price Changed $128,000 MLSU
- 2026-03-24 Price Changed $134,000 MLSU
- 2026-03-07 Price Changed $139,900 MLSU
- 2026-01-29 Listed $149,900 MLSU
Property tax history
+2.5%/yrLatest (2025): $936 · +10.3% YoY. Source: county tax records.
Cash-flow waterfall
monthlySold comps — $/sqft
last 12 mo · ≤1 miLoading sold comps…