4 Shadow Lake Dr · Fairview, NJ
Flood risk 1/10 · Minimal
- FEMA flood zone
- X (unshaded)
- Chance of flooding over 30 yrs
- 0.0%
- Est. flood insurance / yr
- $473 – $860
Fire risk 1/10 · Minimal
- Est. fire insurance / yr
- $526 – $976
Heat risk 7/10 · Major
- Hot days now (above 95°F)
- 7 days/yr
- Hot days in 30 yrs
- 16 days/yr
Wind risk 8/10 · Major
- Chance of severe wind over 30 yrs
- 80.0%
Air-quality risk 4/10 · Minor
- Unhealthy air days now
- 3 days/yr
- Unhealthy air days in 30 yrs
- 5 days/yr
Risk factors via First Street. Map © Google.
Why this score? — see what drove the C- grade
The composite is a weighted blend of 9 inputs, each scored 0–100. Each bar is that input's sub-score; the figure is the points it added to the 100-point composite (weight × sub-score).
- ARV discount +15.0/15.0
- Cash flow +12.9/30.0
- Schools +4.5/10.0
- Rent growth +4.1/5.0
- 1% rule +4.0/10.0
- DSCR +3.9/10.0
- Livability +3.7/5.0
- Condition / age +2.5/5.0
- Appreciation +0.0/10.0
$525,000
🖨 Deal sheet (PDF) 📄 Offer letter ✓ Due diligence
Listing remarks
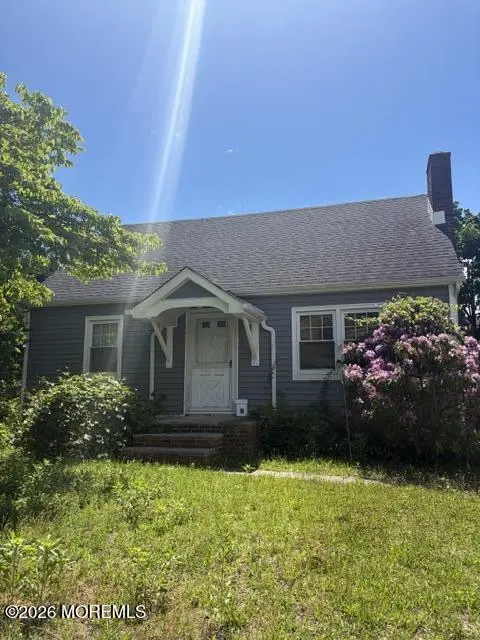
Opportunity awaits at 4 Shadow Lake Drive in the highly sought-after River Plaza section of Middletown, just minutes from vibrant downtown Red Bank. Nestled in a beautiful neighborhood near Shadow Lake, the Navesink River & Swimming River Park and boat ramp, this fixer-upper offers endless potential for investors, builders, or buyers ready to create their dream home.
Key facts
- River plaza section
- Navesink river
- Swimming river park
Tags
Property features AI
Exterior
- Parking: No garage
- Utilities: Public sewer
- Home design: Located in River Plaza / Middletown area
- Exterior features: Sloping roof
Interior
- Bedrooms: 4 bedrooms
- Bathrooms: 2 full bathrooms and 1 half bathroom (3 total)
- Heating & cooling: Hot water and baseboard heating (other / see remarks); Central air conditioning
- Interior features: No fireplaces; Full unfinished basement
Neighborhood map
What this means for you Summary
Snapshot
- This is a 4-bed/1.5-bath single-family listed at $525k.
Deal economics
- At list price, monthly cash flow is $-40 ($-476/yr) — negative.
- To cash-flow at today's rent, offer at most $518k (1.3% below list).
- To meet the 1% rule (rent ≥ 1% of price), the offer needs to be $472k (10.2% below list).
- Recommended offer: $472k (10.2% below list) — sets the bar for 1% rule.
- Cap rate 6.2% vs local median 2.6% in Fairview — top-decile yield for the area; either an underpriced asset or a hidden risk that comps aren't pricing in. Stress-test before assuming the spread holds.
Location & tenants
- Location reads 74/100 on livability (#174 in NJ, #4,548 nationally) — a middle-class / working-renter tenant base. Strengths: crime A+, employment A+, housing A+; Watch: commute C-, schools D-, cost of living F.
- Middletown Township Public School District (suburban): math 39% / reading 55% proficiency, ranked #135 of 472 in NJ (top 29%) — families likely to look elsewhere, expect single-tenant / working-renter base with shorter leases; only 9% free/reduced lunch — higher-income household profile.
- Market conditions: Rents rising fast (+6.5%/yr); 141 active listings in the ZIP; 3 comparable units currently listed for rent nearby; rentals leasing fast (median 5d on market — plan ~1-2 weeks tenant-placement turnaround); high-income renter base; 2,840 units permitted in Monmouth County in 2024 (484 in 5+ unit buildings).
- At $4,717/mo this rent would consume 50% of the median local household income ($112k/yr) (locally 854% of renters already pay >50% of income on rent) — very limited rent-growth headroom before tenants either downsize or default.
Forward outlook
- Local home prices are declining (-3.0%/yr); year-one equity from $4k of loan paydown is wiped out by about $16k of value loss. Plan a longer hold.
- Monmouth County population projected at -11% by 2050 — secular population decline; favor cash flow + early exit over multi-decade hold.
Negotiation context
- Only 4 days on market — expect competitive offers; lowballing is unlikely to land.
Risks & watch-outs
- Watch-outs: built in 1948 — expect roof / HVAC / electrical / plumbing capex.
- Climate carrying-cost: severe wind risk, 80% chance of damaging wind over 30y; extreme-heat days projected 7→16/yr by 2055 (HVAC capex compounding) — expect insurance premiums to compound above CPI over the hold.
Questions for the listing agent
- What do current leases actually rent for vs. the listed asking? Can we see a recent rent roll and the last 12 months of T-12 income?
- Built in 1948 — when were the roof, HVAC, electrical panel, plumbing, and water heater last replaced?
- Is there a deadline driving the sale (1031 exchange, divorce, estate, relocation)? That informs how much negotiation room exists.
- Schools are D-rated, which usually means shorter tenancies and higher turnover. Who's the typical renter profile here, and what's been the actual vacancy rate?
- What's the average days-on-market for RENTAL listings here right now (not sales)? A rising rental-DOM trend means longer vacancies and softer asking-rent achievability than the comps imply.
- What's the recent tenant-quality profile in this submarket — average credit score on applications, eviction rate, late-payment / NSF rate, and stable-employment percentage? A property-management company in the area should have these aggregated.
- How much new for-sale + rental construction is in the pipeline within 1–3 miles? Heavy new supply typically softens prices + rents 12–24 months out; constrained supply supports both.
Investment metrics
- 1% rule
- 0.90% ✗
- Cap rate
- 6.20%
- Cash-on-cash
- -0.32%
- DSCR
- 0.99
- GRM
- 9.3
CMA / ARV
- ARV (on-the-fly)
- $748,584
- Comps found
- 12
Show comp detail 12 sales within ~0.75 mi
| Address | Dist | Beds/Ba | Sqft | Sold | Price | $/sf | Match |
|---|---|---|---|---|---|---|---|
| 921 Park Pl | 0.03mi | 4/1.0 | 1,350 (+1%) | 2mo | $730,000 | $541 | 93 |
| 40 Foster St | 0.13mi | 3/1.5 (-1) | 1,200 (-10%) | 2mo | $860,000 | $717 | 71 |
| 15 Hillside St | 0.46mi | 4/3.0 | 1,395 (+5%) | 6mo | $808,000 | $579 | 60 |
| 47 Mclean St | 0.48mi | 4/2.0 | 1,464 (+10%) | 1mo | $870,000 | $594 | 58 |
| 159 Davis Ln | 0.44mi | 4/1.5 | 1,440 (+8%) | 9mo | $700,000 | $486 | 58 |
| 916 Park Pl | 0.05mi | 3/1.0 (-1) | 1,144 (-14%) | 13mo | $705,000 | $616 | 56 |
| 79 Lake Shore Dr | 0.45mi | 3/2.0 (-1) | 1,441 (+8%) | 5mo | $810,000 | $562 | 54 |
| 67 Victoria Pl | 0.75mi | 3/2.0 (-1) | 1,292 (-3%) | 3mo | $660,000 | $511 | 51 |
| 99 Roosevelt Cir E | 0.68mi | 3/1.0 (-1) | 1,372 (+3%) | 9mo | $580,000 | $423 | 49 |
| 96 Cooper Blvd | 0.54mi | 3/1.5 (-1) | 1,514 (+14%) | 1mo | $685,000 | $452 | 46 |
| 145 River St | 0.72mi | 3/2.5 (-1) | 1,380 (+4%) | 10mo | $700,000 | $507 | 43 |
| 90 Campbell St | 0.62mi | 3/2.0 (-1) | 1,192 (-10%) | 13mo | $787,700 | $661 | 36 |
Match score weights: distance 35% · size 25% · config 20% · recency 20%. Top-matched comps best support the ARV.
Projected returns pro-forma
-3.0% appreciation · 6.45% rent growth · sell at horizon
- IRR
- -12.9%
- Equity multiple
- 0.52×
- Total profit
- $-70,504
- Equity at exit
- $78,279
- IRR
- 0.9%
- Equity multiple
- 1.07×
- Total profit
- $10,613
- Equity at exit
- $45,392
Cash invested: $147,000 (down + closing). Projections, not guarantees.
Landlord ↔ Tenant lean methodology
- Overall (STATE)
- 21 Tenant-Leaning
- State New Jersey
- 21 Tenant-Leaning · D+6
- County
- — inherits STATE
- City
- — inherits STATE
ZIP-level market 07701
- Rents YoY
- 6.5%
- Active inventory
- 141
- Price-to-rent
- 9.3×
Monthly cashflow live
- Estimated rent
- $4,717 medium interval (Pro) →
- Mortgage (P&I)
- −$2,753
- Tax from tax record
- −$794 /mo · $9,529/yr
- Insurance
- −$219
- HOA
- −$0
- Vacancy / Maint / Mgmt
- −$991
- Net cashflow
- $-40
Break-even live
Sensitivity live
| Price | -10% $258 | -5% $109 | +0% $-40 | +5% $-188 | +10% $-337 |
|---|---|---|---|---|---|
| Rent | -10% $-412 | -5% $-226 | +0% $-40 | +5% $147 | +10% $333 |
| Rate | -1.0pp $225 | -0.5pp $94 | base $-40 | +0.5pp $-176 | +1.0pp $-314 |
UW: 25.0% down · 7.5% · 30yr · 1.5% tax · 5.0% vac · 8.0% maint · 8.0% mgmt
Financing live
Cash to close
- Down payment
- $131,250
- Closing costs
- $15,750
- Reserves months
- —
- Total cash needed
- —
Loan-product check · same deal, 3 products live
Conventional
25% down · 7.5% · 30yr
- Down + closing
- —
- Monthly P&I
- —
- Monthly cashflow
- —
- DSCR
- —
- Eligible?
- —
Personal DTI + credit; lowest rate.
DSCR
20% down · 8.5% · 30yr
- Down + closing
- —
- Monthly P&I
- —
- Monthly cashflow
- —
- DSCR
- —
- Eligible?
- —
No personal income docs; deal must DSCR.
Hard money
10% down · 12.0% · 12mo
- Down + closing
- —
- Monthly P&I
- —
- Monthly cashflow
- —
- DSCR
- —
- Eligible?
- —
Short-term bridge; refi at stabilization.
Rent comps 3 comps
| Address | Beds | Baths | Sqft | Rent | $/sqft | DOM | Units | Dist |
|---|---|---|---|---|---|---|---|---|
| 96 Lake Shore Dr Red Bank, NJ | 3.0 | 2.0 | 1382 | $5,500 | $3.98 | 4d | 1 | 0.42mi |
| 35 E Westside Ave Red Bank, NJ | 3.0 | 1.5 | 1400 | $3,650 | $2.61 | 17d | 1 | 1.02mi |
| 12 Market St Red Bank, NJ | 3.0 | 1.0 | 1180 | $3,950 | $3.35 | 0d | 1 | 1.07mi |
Listing history 5 events
-
2026-06-04statusdays on market $525,000 Pending 4 DOM
-
2026-06-03days on market $525,000 Active 3 DOM
-
2026-06-02days on market $525,000 Active 2 DOM
-
2026-06-01remarks 371-char remark
-
2026-06-01$525,000 Active 1 DOM
ⓘ Source: listings_history table (triggers on properties + properties_extension) + one-shot
backfill from property_details.listing_events for pre-trigger history.
Tax reassessment forecast NJ · Partial reset (capped growth)
- Current annual tax
- $9,529 · $794/mo
- Projected year-2 tax
- $11,301 · $942/mo
- Expected delta
- +$1,772/yr (+$148/mo · 18.6%)
ⓘ Screening estimate from a state-policy table — verify with the county assessor before closing.
Climate risk First Street
- Flood 1/10 Low FEMA zone X (unshaded) · 0% chance over 30 yrs
- Wildfire 1/10 Low
- Heat 7/10 Severe 7 d/yr ≥95°F today · 16 d/yr by 30 yrs out
- Wind 8/10 Severe 80% chance of damaging wind over 30 yrs
- Air quality 4/10 Moderate 3 unhealthy d/yr today · 5 by 30 yrs out
Nearby sold comps map
Loading sold comps map…
Walkable amenities ~0.75 mi
Loading nearby amenities…
Taxation est. · year 1
- Rental income
- $56,602
- − Mortgage interest
- −$29,408
- − Property taxes
- −$9,529
- − Insurance
- −$2,625
- − Repairs & maintenance
- −$4,528
- − Management
- −$4,528
- − Depreciation
- −$15,273
- Taxable loss
- −$9,289
- Est. tax savings @ 24.0%
- +$2,229
- After-tax cash flow
- $1,753/yr
For passive investors: Depreciation is non-cash, so a rental often shows a tax loss while cash-flowing — sheltering income. Rental losses are passive: they offset passive income freely, and up to $25,000/yr can offset ordinary (W-2) income if you actively participate and your MAGI is under $100k (phasing out to $0 by $150k); unused losses carry forward. On sale, claimed depreciation is recaptured at up to 25%, and gains may owe capital-gains tax (a 1031 exchange can defer both). Figures are a year-1 estimate at your 24.0% rate — not tax advice; consult a CPA.
Schools (NCES district)
- District
- Middletown Township Public School District
- NCES district ID
- 3410110
- Math proficiency
- 39% ▼ -13.00%
- Reading proficiency
- 55% ▼ -10.00%
- Median HH income
- $100,708
- Composite
- 45.08/100
- National rank
- #2694
- State rank
- #135 of 472 in NJ
Livability — Fairview
- Score
- 74/100
- State rank
- #174
- US rank
- #4548
Category grades
Schools grade is shown separately in the Schools card above.
Census & demographics
- County
- Monmouth County · 505,557 people
- City population
- 15,099
- Metro
- New York-Newark-Jersey City, NY-NJ-PA
- Population (ZIP)
- 24,376
- Household income
- $112,143
- Rent vs Own
- Severe rent burden
- 854.0
Population outlook (Monmouth County) Hauer SSP2
- Today (2025)
- 620,308 people
- By 2030
- 612,309 · -1.3%
- By 2040
- 587,297 · -5.3%
- By 2050
- 551,342 · -11.1%
- By 2075
- 472,934 · -23.8%
- By 2100
- 381,534 · -38.5%
Race, ethnicity, and origin ACS 2023
- Neighborhood character
- Predominantly White (73%)
- Race & ethnicity
- White 73% Hispanic / Latino 18% Two or more races 8% Black 4% Native American 2% Asian 2%
- Hispanic origin (detail)
- Mexican 13% Puerto Rican 2%
- Common ancestry
- Romanian 5% Scotch-Irish 2% Lithuanian 2%
- Foreign-born
- 14% · Canada, Dominican Republic, China
- Languages at home
- 81% English-only · Spanish 14% Other Indo-European 3%
Political lean MEDSL · Monmouth
- 2024 margin
- R (+11.4) · D 43.4% · R 54.8% · Other 1.8%
- 2008→2024 swing
- -7.7pp toward R · 2008: -3.7pp · 2024: -11.4pp
- All cycles
- 2024: R+11.4 2020: R+2.8 2016: R+9.5 2012: R+5.5 2008: R+3.7
Not yet ingested
- Civics
- —
Market trends
- HPI YoY
- ▼ -428.28%
- Current HPI
- 350.124
- Rent YoY
- ▲ 6.45%
- Metro
- New York-Newark-Jersey City, NY-NJ-PA
- State GDP YoY
- ▲ 2.05%
- F500 in state
- 34
Industry mix (Fortune 500 HQ in NJ)
| Industry | F500 HQs | Revenue |
|---|---|---|
| Consumer Goods | 3 | $31B |
|
||
| Pharmaceuticals | 2 | $153B |
|
||
| Technology | 2 | $21B |
|
||
| Insurance | 2 | $20B |
|
||
| Healthcare | 2 | $19B |
|
||
| Financial Services | 1 | $70B |
|
||
Price history
1 event — show timeline
- 2026-05-29 Listed $525,000 MOMLS
Property tax history
+4.3%/yrLatest (2025): $9,529 · +6.7% YoY. Source: county tax records.
Cash-flow waterfall
monthlySold comps — $/sqft
last 12 mo · ≤1 miLoading sold comps…