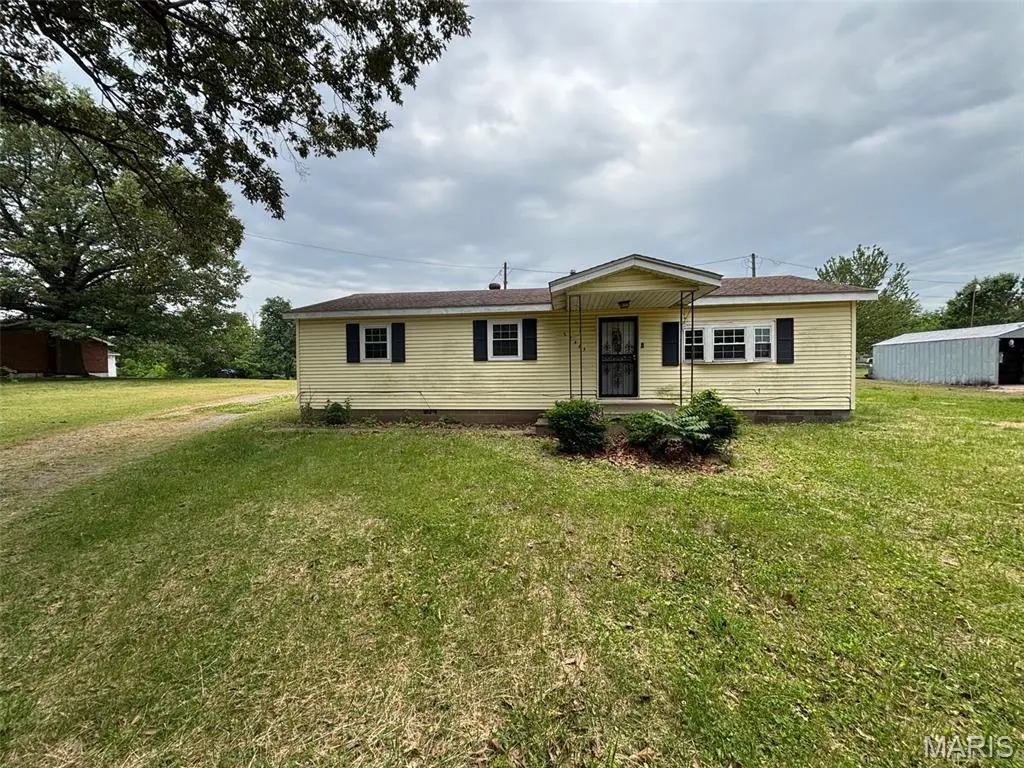
22465 Us Highway 61 · Morley, MO
Flood risk 1/10 · Minimal
- FEMA flood zone
- X
- Chance of flooding over 30 yrs
- 0.0%
- Est. flood insurance / yr
- $507 – $1,088
Fire risk 2/10 · Minimal
- Est. fire insurance / yr
- $1,054 – $1,958
Heat risk 6/10 · Moderate
- Hot days now (above 109°F)
- 7 days/yr
- Hot days in 30 yrs
- 21 days/yr
Wind risk 3/10 · Minor
- Chance of severe wind over 30 yrs
- 4.0%
Air-quality risk 4/10 · Minor
- Unhealthy air days now
- 5 days/yr
- Unhealthy air days in 30 yrs
- 5 days/yr
Risk factors via First Street. Map © Google.
Why this score? — see what drove the B grade
The composite is a weighted blend of 9 inputs, each scored 0–100. Each bar is that input's sub-score; the figure is the points it added to the 100-point composite (weight × sub-score).
- Cash flow +30.0/30.0
- DSCR +10.0/10.0
- 1% rule +8.8/10.0
- ARV discount +7.5/15.0
- Appreciation +6.5/10.0
- Livability +2.7/5.0
- Rent growth +2.5/5.0
- Condition / age +2.5/5.0
- Schools +2.4/10.0
$85,000
🖨 Deal sheet (PDF) 📄 Offer letter ✓ Due diligence
Listing remarks
Looking for a fixer upper? No problem. This 1700 sq ft home is perfect for an investment, or your dream home. If you've read this for you have enough interest to give it a view & see for yourself!
Key facts
- 0.52 acre lot
- Built 1950
- Listed 22 days
Property features AI
Finance
- Financial info: Lease not considered
Exterior
- Parking: Gravel parking
- Security: Security service
- Utilities: Public water; Public sewer; 220 volt electric; Cable available; Electricity available; Natural gas available; Phone available; Sewer connected; Water available
- Home design: Single-family residence; One level; Private ownership; Fixer condition
- Construction: Lap and vinyl siding; Shingle roof; Block foundation; Built area reported from public records
- Exterior features: Covered patio/porch; Deck; Rear porch; Partial fencing; Pole barn(s)
Interior
- Kitchen: Dishwasher; Microwave
- Bedrooms: 4 bedrooms on the main level; One bedroom needs a closet
- Flooring: Vinyl flooring; Wood flooring
- Bathrooms: 2 full bathrooms on the main level
- Heating & cooling: Forced air heating (natural gas); Ceiling fans and electric cooling
- Interior features: Ceiling fans; Bay window; Security system; Storage
- Laundry & utility: Laundry on the main level
Neighborhood map
What this means for you Summary
Snapshot
- This is a 4-bed/2.0-bath other listed at $85k.
Deal economics
- At list price, monthly cash flow is $405 ($5k/yr) — positive.
- The deal already cash-flows at list — no discount required.
- Meets the 1% rule at list price ($1k rent vs $85k).
- Recommended offer: $84k (1.5% below list) — sets the bar for market timing.
Location & tenants
- Location reads 54/100 on livability (#790 in MO) — a working-class tenant base; expect higher turnover. Strengths: cost of living A+, housing A+; Watch: crime F, amenities F, commute F.
- Scott County Central (rural): math 20% / reading 30% proficiency, ranked #489 of 535 in MO (top 91%) — low school quality limits family demand, transient renter base, plan for 1-2y turnover; 63% free/reduced lunch — lower-income household profile, screen leases tightly.
- Zoned schools: Scott Co. Central Elem. (math 32% / reading 27%, grade F, #813 of 1,115 statewide, top 75%, 138 students, 98% FRL); Scott Co. Central High (math 27% / reading 42%, grade F, #321 of 521 statewide, top 67%, 136 students, 98% FRL) — zoned schools average 98% FRL vs 63% district-wide (35 pts higher); higher-poverty schools than district average — tighter screening recommended.
- Market conditions: 10 active listings in the ZIP; 123 units permitted in Scott County in 2024 (32 in 5+ unit buildings).
Forward outlook
- In year one you build about $3k of equity ($588 loan paydown + $3k appreciation (3.0% local appreciation)).
- Scott County population projected at -16% by 2050 — secular population decline; favor cash flow + early exit over multi-decade hold.
- At projected returns (3.0% appreciation + 3.0% rent growth), your $24k cash investment doubles in ~3 years — after that, you're playing with house money.
- By year 10, paydown + projected appreciation supports a ~$30k cash-out refi (75% LTV) — recoverable capital for the next deal without selling this one.
Negotiation context
- It's been on market 22 days — a 2% lower offer ($84k) is reasonable based on typical stale-listing flexibility.
- 4 sale attempts with the ask held roughly flat each time — persistent listings suggest the price (not the market) is what's stuck; bring a comps-based counter.
Risks & watch-outs
- Watch-outs: built in 1950 — expect roof / HVAC / electrical / plumbing capex.
- Climate carrying-cost: extreme-heat days projected 7→21/yr by 2055 (HVAC capex compounding) — expect insurance premiums to compound above CPI over the hold.
Questions for the listing agent
- Built in 1950 — when were the roof, HVAC, electrical panel, plumbing, and water heater last replaced?
- Is there a deadline driving the sale (1031 exchange, divorce, estate, relocation)? That informs how much negotiation room exists.
- Schools are F-rated, which usually means shorter tenancies and higher turnover. Who's the typical renter profile here, and what's been the actual vacancy rate?
- Crime grade is F in this area — have there been break-ins, vandalism, or insurance claims at this property in the last 3 years? What carrier currently insures it and at what premium?
- What's the average days-on-market for RENTAL listings here right now (not sales)? A rising rental-DOM trend means longer vacancies and softer asking-rent achievability than the comps imply.
- What's the recent tenant-quality profile in this submarket — average credit score on applications, eviction rate, late-payment / NSF rate, and stable-employment percentage? A property-management company in the area should have these aggregated.
- How much new for-sale + rental construction is in the pipeline within 1–3 miles? Heavy new supply typically softens prices + rents 12–24 months out; constrained supply supports both.
Investment metrics
- 1% rule
- 1.38% ✓
- Cap rate
- 12.01%
- Cash-on-cash
- 20.42%
- DSCR
- 1.91
- GRM
- 6.0
CMA / ARV
No comps found within radius.
Projected returns pro-forma
3.0% appreciation · 3.0% rent growth · sell at horizon
- IRR
- 26.7%
- Equity multiple
- 2.51×
- Total profit
- $36,009
- Equity at exit
- $38,214
- IRR
- 27.3%
- Equity multiple
- 4.87×
- Total profit
- $92,020
- Equity at exit
- $58,889
Cash invested: $23,800 (down + closing). Projections, not guarantees.
Landlord ↔ Tenant lean methodology
- Overall (STATE)
- 81 Strongly Landlord-Friendly
- State Missouri
- 81 Strongly Landlord-Friendly · R+10
- County
- — inherits STATE
- City
- — inherits STATE
ZIP-level market 63771
- Home prices YoY
- 2.2%
- Active inventory
- 10
- Price-to-rent
- 6.0×
Monthly cashflow live
- Estimated rent
- $1,172 medium interval (Pro) →
- Mortgage (P&I)
- −$446
- Tax from tax record
- −$40 /mo · $474/yr
- Insurance
- −$35
- HOA
- −$0
- Vacancy / Maint / Mgmt
- −$246
- Net cashflow
- $405
Break-even live
Sensitivity live
| Price | -10% $453 | -5% $429 | +0% $405 | +5% $381 | +10% $357 |
|---|---|---|---|---|---|
| Rent | -10% $312 | -5% $359 | +0% $405 | +5% $451 | +10% $498 |
| Rate | -1.0pp $448 | -0.5pp $427 | base $405 | +0.5pp $383 | +1.0pp $361 |
UW: 25.0% down · 7.5% · 30yr · 1.5% tax · 5.0% vac · 8.0% maint · 8.0% mgmt
Financing live
Cash to close
- Down payment
- $21,250
- Closing costs
- $2,550
- Reserves months
- —
- Total cash needed
- —
Loan-product check · same deal, 3 products live
Conventional
25% down · 7.5% · 30yr
- Down + closing
- —
- Monthly P&I
- —
- Monthly cashflow
- —
- DSCR
- —
- Eligible?
- —
Personal DTI + credit; lowest rate.
DSCR
20% down · 8.5% · 30yr
- Down + closing
- —
- Monthly P&I
- —
- Monthly cashflow
- —
- DSCR
- —
- Eligible?
- —
No personal income docs; deal must DSCR.
Hard money
10% down · 12.0% · 12mo
- Down + closing
- —
- Monthly P&I
- —
- Monthly cashflow
- —
- DSCR
- —
- Eligible?
- —
Short-term bridge; refi at stabilization.
Listing history 22 events
-
2026-06-21days on market $85,000 Active 22 DOM
-
2026-06-18days on market $85,000 Active 20 DOM
-
2026-06-17days on market $85,000 Active 19 DOM
-
2026-06-16days on market $85,000 Active 18 DOM
-
2026-06-15days on market $85,000 Active 17 DOM
-
2026-06-13days on market $85,000 Active 15 DOM
-
2026-06-12days on market $85,000 Active 14 DOM
-
2026-06-09days on market $85,000 Active 11 DOM
-
2026-06-08days on market $85,000 Active 10 DOM
-
2026-06-07days on market $85,000 Active 9 DOM
-
2026-06-07days on market $85,000 Active 8 DOM
-
2026-06-04days on market $85,000 Active 5 DOM
-
2026-06-02days on market $85,000 Active 4 DOM
-
2026-06-01days on market $85,000 Active 3 DOM
-
2026-05-31days on market $85,000 Active 2 DOM
-
2026-05-29$85,000 Active
-
2025-05-21status Active
-
2025-05-15status Pending
-
2025-05-12status Active
-
2025-04-24status Pending
-
2025-04-24historical Active Under Contract
-
2025-01-10$115,000 Active
ⓘ Source: listings_history table (triggers on properties + properties_extension) + one-shot
backfill from property_details.listing_events for pre-trigger history.
Tax reassessment forecast MO · Resets to sale price
- Current annual tax
- $474 · $40/mo
- Projected year-2 tax
- $824 · $69/mo
- Expected delta
- +$350/yr (+$29/mo · 73.8%)
ⓘ Screening estimate from a state-policy table — verify with the county assessor before closing.
Climate risk First Street
- Flood 1/10 Low FEMA zone X · 0% chance over 30 yrs
- Wildfire 2/10 Low
- Heat 6/10 Major 7 d/yr ≥109°F today · 21 d/yr by 30 yrs out
- Wind 3/10 Moderate 4% chance of damaging wind over 30 yrs
- Air quality 4/10 Moderate 5 unhealthy d/yr today · 5 by 30 yrs out
Nearby sold comps map
Loading sold comps map…
Walkable amenities ~0.75 mi
Loading nearby amenities…
Taxation est. · year 1
- Rental income
- $14,062
- − Mortgage interest
- −$4,761
- − Property taxes
- −$474
- − Insurance
- −$425
- − Repairs & maintenance
- −$1,125
- − Management
- −$1,125
- − Depreciation
- −$2,473
- Taxable income
- $3,679
- Est. tax owed @ 24.0%
- −$883
- After-tax cash flow
- $3,978/yr
For passive investors: Depreciation is non-cash, so a rental often shows a tax loss while cash-flowing — sheltering income. Rental losses are passive: they offset passive income freely, and up to $25,000/yr can offset ordinary (W-2) income if you actively participate and your MAGI is under $100k (phasing out to $0 by $150k); unused losses carry forward. On sale, claimed depreciation is recaptured at up to 25%, and gains may owe capital-gains tax (a 1031 exchange can defer both). Figures are a year-1 estimate at your 24.0% rate — not tax advice; consult a CPA.
Schools (NCES district)
- District
- Scott County Central
- NCES district ID
- 2921420
- Math proficiency
- 20% ▼ -15.00%
- Reading proficiency
- 30% ▬ 0.00%
- Median HH income
- $38,765
- Composite
- 24.01/100
- National rank
- #13177
- State rank
- #489 of 535 in MO
Livability — Morley
- Score
- 54/100
- State rank
- #790
- US rank
- #24033
Category grades
Schools grade is shown separately in the Schools card above.
Census & demographics
- City population
- 551
- Population (ZIP)
- 2,461
Population outlook (Scott County) Hauer SSP2
- Today (2025)
- 37,964 people
- By 2030
- 36,963 · -2.6%
- By 2040
- 34,632 · -8.8%
- By 2050
- 32,024 · -15.6%
- By 2075
- 25,250 · -33.5%
- By 2100
- 18,078 · -52.4%
Race, ethnicity, and origin ACS 2023
- Neighborhood character
- Predominantly White (86%)
- Race & ethnicity
- White 86% Two or more races 6% Black 5% Hispanic / Latino 3%
- Common ancestry
- Iranian 3% Lithuanian 2% Portuguese 2%
- Foreign-born
- 1% · Vietnam
- Languages at home
- 98% English-only · Spanish 1% Vietnamese 1%
Political lean MEDSL · Scott
- 2024 margin
- Solid R (+58.9) · D 20.2% · R 79.2%
- 2008→2024 swing
- -29.5pp toward R · 2008: -29.4pp · 2024: -58.9pp
- All cycles
- 2024: R+58.9 2020: R+56.5 2016: R+55.6 2012: R+38.2 2008: R+29.4
Not yet ingested
- Civics
- —
Market trends
- HPI YoY
- ▲ 3.00%
- Current HPI
- 140.2702
- Rent YoY
- —
- Metro
- —
- State GDP YoY
- ▲ 1.84%
- F500 in state
- 20
Industry mix (Fortune 500 HQ in MO)
| Industry | F500 HQs | Revenue |
|---|---|---|
| Healthcare | 1 | $163B |
|
||
| Insurance | 1 | $21B |
|
||
| Industrial Technology | 1 | $17B |
|
||
| Retail | 1 | $16B |
|
||
| Industrial Distribution | 1 | $10B |
|
||
| Utilities | 1 | $9B |
|
||
Price history
-26.1% since first listed7 events — show timeline
- 2026-05-29 Listed $85,000 MARIS as Distributed by MLS Grid
- 2025-05-21 Relisted — MARIS as Distributed by MLS Grid
- 2025-05-15 Pending — MARIS as Distributed by MLS Grid
- 2025-05-12 Relisted — MARIS as Distributed by MLS Grid
- 2025-04-24 Pending — MARIS as Distributed by MLS Grid
- 2025-04-24 Contingent — MARIS as Distributed by MLS Grid
- 2025-01-10 Listed $115,000 MARIS as Distributed by MLS Grid
Property tax history
+3.5%/yrLatest (2025): $474 · +10.5% YoY. Source: county tax records.
Cash-flow waterfall
monthlySold comps — $/sqft
last 12 mo · ≤1 miLoading sold comps…