794 Sailor Grove Ln · Jacksonville, FL
Flood risk No data
- FEMA flood zone
- —
- Chance of flooding over 30 yrs
- —
- Est. flood insurance / yr
- —
Fire risk No data
- Est. fire insurance / yr
- —
Heat risk No data
- Hot days now (above threshold)
- —
- Hot days in 30 yrs
- —
Wind risk No data
- Chance of severe wind over 30 yrs
- —
Air-quality risk No data
- Unhealthy air days now
- —
- Unhealthy air days in 30 yrs
- —
Risk factors via First Street. Map © Google.
Why this score? — see what drove the D+ grade
The composite is a weighted blend of 9 inputs, each scored 0–100. Each bar is that input's sub-score; the figure is the points it added to the 100-point composite (weight × sub-score).
- Cash flow +15.2/30.0
- ARV discount +8.2/15.0
- DSCR +4.7/10.0
- Livability +4.2/5.0
- Schools +3.9/10.0
- 1% rule +3.7/10.0
- Rent growth +3.0/5.0
- Condition / age +2.5/5.0
- Appreciation +0.0/10.0
$221,705
🖨 Deal sheet 📄 Offer letter ✓ Due diligence
Listing remarks MLS
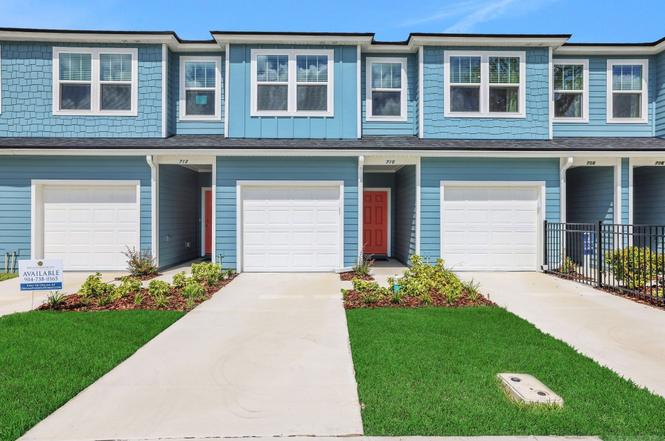
Charming 3-bedroom, 2.5-bath townhome featuring a cozy kitchen that overlooks a spacious great room, perfect for entertaining. The primary bedroom is conveniently located upstairs for added privacy. This home also includes a 1-car garage, providing both parking and storage space. Ideal for comfortable living in a well-designed layout. * Photos are representative of the Arlington floor plan
Key facts
- Cozy kitchen
- Spacious great room
- 1-car garage
Tags
Property features AI
Finance
- HOA & community: Monthly association fee ($135); Association maintains grounds and structures
Exterior
- Parking: Attached garage with garage door opener (1-car)
- Security: Carbon monoxide detector(s); Smoke detector(s)
- Utilities: Public sewer; Electricity connected; Water connected; Sewer connected
- Home design: Townhouse; Two levels; East-facing
- Construction: Fiber cement and frame construction; Shingle roof
- Exterior features: Awning-covered patio/porch; Sprinklers in front and rear; Asphalt road access; Carbon monoxide and smoke detectors
Interior
- Kitchen: Dishwasher; Garbage disposal; Electric oven; Microwave
- Bedrooms: 3 bedrooms (one en suite on the second level)
- Flooring: Carpet; Vinyl
- Bathrooms: 2 full bathrooms; 1 half bathroom; Second-level bath with shower and single vanity
- Heating & cooling: Central heating; Heat pump; Electric cooling
- Interior features: Open floorplan; Kitchen island; Pantry; Split bedrooms; Walk-in closet(s)
- Laundry & utility: Washer hookup; Electric dryer hookup on lower level
Neighborhood map
What this means for you Summary
Snapshot
- This is a 3-bed/3.0-bath townhouse listed at $222k.
Deal economics
- At list price, monthly cash flow is $78 ($938/yr) — positive.
- The deal already cash-flows at list — no discount required.
- To meet the 1% rule (rent ≥ 1% of price), the offer needs to be $194k (12.5% below list).
- Recommended offer: $194k (12.5% below list) — sets the bar for 1% rule.
- Cap rate 6.7% vs local median 4.0% in Jacksonville — top-decile yield for the area; either an underpriced asset or a hidden risk that comps aren't pricing in. Stress-test before assuming the spread holds.
Location & tenants
- Location reads 83/100 on livability (#50 in FL, #911 nationally) — a professional / high-income tenant draw. Strengths: amenities A+, commute A+, housing A+.
- Duval (urban): math 46% / reading 45% proficiency, ranked #48 of 73 in FL (top 66%) — families likely to look elsewhere, expect single-tenant / working-renter base with shorter leases.
- Zoned schools: Crystal Springs Elementary School (math 51% / reading 41%, grade D-, #1,234 of 2,144 statewide, top 58%, 907 students, 66% FRL); Charger Academy (math 33% / reading 26%, grade F, #469 of 571 statewide, top 84%, 961 students, 71% FRL); Edward H. White High School (math 31% / reading 25%, grade F, #464 of 667 statewide, top 70%, 1,538 students, 64% FRL) — zoned schools average 67% FRL vs 49% district-wide (18 pts higher); higher-poverty schools than district average — tighter screening recommended.
- Market conditions: Rents rising (+2.1%/yr); 217 active listings in the ZIP; 22 comparable units currently listed for rent nearby; rentals at typical pace (median 15d on market — plan ~3-4 weeks tenant-placement turnaround); solid renter incomes; 6,503 units permitted in Duval County in 2024 (1,131 in 5+ unit buildings).
Forward outlook
- Local home prices are declining (-3.0%/yr); year-one equity from $2k of loan paydown is wiped out by about $7k of value loss. Plan a longer hold.
- Duval County population projected at +19% by 2050 — long-run rental-demand tailwind backs the buy-and-hold thesis.
Negotiation context
- Only 2 days on market — expect competitive offers; lowballing is unlikely to land.
- 2 sale attempts with the ask held roughly flat each time — persistent listings suggest the price (not the market) is what's stuck; bring a comps-based counter.
Questions for the listing agent
- What does the HOA fee cover, when was the last increase, and are there any pending special assessments or reserve-fund shortfalls?
- Is there a deadline driving the sale (1031 exchange, divorce, estate, relocation)? That informs how much negotiation room exists.
- Schools are B-rated — typically a magnet for longer-tenancy family renters. What's the average tenant stay here, and is there a school-zone premium baked into asking?
- The area grade is low — what's the realistic commute time and amenity access for the typical tenant pool here? Any planned neighborhood developments (good or bad) we should know about?
- What's the average days-on-market for RENTAL listings here right now (not sales)? A rising rental-DOM trend means longer vacancies and softer asking-rent achievability than the comps imply.
- What's the recent tenant-quality profile in this submarket — average credit score on applications, eviction rate, late-payment / NSF rate, and stable-employment percentage? A property-management company in the area should have these aggregated.
- How much new for-sale + rental construction is in the pipeline within 1–3 miles? Heavy new supply typically softens prices + rents 12–24 months out; constrained supply supports both.
Investment metrics
- 1% rule
- 0.87% ✗
- Cap rate
- 6.72%
- Cash-on-cash
- 1.51%
- DSCR
- 1.07
- GRM
- 9.5
CMA / ARV
- ARV (on-the-fly)
- $225,256
- Comps found
- 12
Show comp detail 12 sales within ~0.75 mi
| Address | Dist | Beds/Ba | Sqft | Sold | Price | $/sf | Match |
|---|---|---|---|---|---|---|---|
| 739 Sailor Grove Ln | 0.07mi | 3/2.5 | 1,482 (-3%) | 3mo | $219,990 | $148 | 88 |
| 743 Sailor Grove Ln | 0.07mi | 3/2.5 | 1,482 (-3%) | 4mo | $219,990 | $148 | 87 |
| 737 Sailor Grove Ln | 0.07mi | 3/2.5 | 1,482 (-3%) | 4mo | $219,990 | $148 | 87 |
| 728 Sailor Grove Ln | 0.10mi | 3/2.5 | 1,481 (-3%) | 3mo | $219,990 | $149 | 86 |
| 741 Sailor Grove Ln | 0.07mi | 3/2.5 | 1,482 (-3%) | 5mo | $219,990 | $148 | 86 |
| 730 Sailor Grove Ln | 0.10mi | 3/2.5 | 1,482 (-3%) | 5mo | $219,990 | $148 | 84 |
| 732 Sailor Grove Ln | 0.10mi | 3/2.5 | 1,482 (-3%) | 6mo | $219,990 | $148 | 84 |
| 718 Sailor Grove Ln | 0.11mi | 3/2.5 | 1,481 (-3%) | 6mo | $219,990 | $149 | 83 |
| 726 Sailor Grove Ln | 0.11mi | 4/2.5 (+1) | 1,557 (+2%) | 2mo | $229,990 | $148 | 83 |
| 714 Sailor Grove Ln | 0.12mi | 3/2.5 | 1,481 (-3%) | 7mo | $219,990 | $149 | 82 |
| 710 Sailor Grove Ln | 0.12mi | 3/2.5 | 1,481 (-3%) | 7mo | $219,990 | $149 | 82 |
| 720 Sailor Grove Ln | 0.11mi | 4/2.5 (+1) | 1,557 (+2%) | 3mo | $229,990 | $148 | 82 |
Match score weights: distance 35% · size 25% · config 20% · recency 20%. Top-matched comps best support the ARV.
Projected returns pro-forma
-3.0% appreciation · 2.12% rent growth · sell at horizon
- IRR
- -14.8%
- Equity multiple
- 0.47×
- Total profit
- $-32,667
- Equity at exit
- $33,057
- IRR
- -7.7%
- Equity multiple
- 0.53×
- Total profit
- $-28,972
- Equity at exit
- $19,169
Cash invested: $62,077 (down + closing). Projections, not guarantees.
Landlord ↔ Tenant lean methodology
- Overall (STATE)
- 87 Strongly Landlord-Friendly
- State Florida
- 87 Strongly Landlord-Friendly · R+3
- County
- — inherits STATE
- City
- — inherits STATE
ZIP-level market 32221
- Home prices YoY
- -19.2%
- Rents YoY
- 2.1%
- Active inventory
- 217
- Price-to-rent
- 9.5×
Monthly cashflow live
- Estimated rent
- $1,940 high interval (Pro) →
- Mortgage (P&I)
- −$1,163
- Tax from tax record
- −$64 /mo · $771/yr
- Insurance
- −$92
- HOA
- −$135
- Vacancy / Maint / Mgmt
- −$407
- Net cashflow
- $78
Break-even live
UW: 25.0% down · 7.5% · 30yr · 1.5% tax · 5.0% vac · 8.0% maint · 8.0% mgmt
Financing live
Cash to close
- Down payment
- $55,426
- Closing costs
- $6,651
- Reserves months
- —
- Total cash needed
- —
Loan-product check · same deal, 3 products live
Conventional
25% down · 7.5% · 30yr
- Down + closing
- —
- Monthly P&I
- —
- Monthly cashflow
- —
- DSCR
- —
- Eligible?
- —
Personal DTI + credit; lowest rate.
DSCR
20% down · 8.5% · 30yr
- Down + closing
- —
- Monthly P&I
- —
- Monthly cashflow
- —
- DSCR
- —
- Eligible?
- —
No personal income docs; deal must DSCR.
Hard money
10% down · 12.0% · 12mo
- Down + closing
- —
- Monthly P&I
- —
- Monthly cashflow
- —
- DSCR
- —
- Eligible?
- —
Short-term bridge; refi at stabilization.
Rent comps 22 comps
| Address | Beds | Baths | Sqft | Rent | $/sqft | DOM | Units | Dist |
|---|---|---|---|---|---|---|---|---|
| 726 Sailor Grove Ln Jacksonville, FL | 4.0 | 2.5 | 1554 | $1,850 | $1.19 | 2d | 1 | 0.10mi |
| 8054 Paschal St Jacksonville, FL | 4.0 | 1.0 | 1192 | $1,850 | $1.55 | 23d | 1 | 0.30mi |
| 8054 Graff Ln Jacksonville, FL | 3.0 | 2.0 | 1117 | $1,699 | $1.52 | 1d | 1 | 0.44mi |
| 7847 Mariner St Jacksonville, FL | 3.0 | 2.0 | 1209 | $1,599 | $1.32 | 23d | 1 | 0.58mi |
| 7841 Mariner St Jacksonville, FL | 3.0 | 2.0 | 1209 | $1,625 | $1.34 | 17d | 1 | 0.59mi |
| 8311 Santman Ct Jacksonville, FL | 3.0 | 2.0 | 1268 | $1,400 | $1.10 | 23d | 1 | 0.73mi |
| 863 Westgate Dr Jacksonville, FL | 3.0 | 2.0 | 1287 | $1,800 | $1.40 | 17d | 1 | 0.74mi |
| 1116 Palisades Dr Jacksonville, FL | 3.0 | 2.0 | 1161 | $1,550 | $1.34 | 3d | 1 | 0.76mi |
| 909 Westgate Dr Jacksonville, FL | 3.0 | 1.5 | 1051 | $1,595 | $1.52 | 4d | 1 | 0.78mi |
| 7777 Normandy Blvd Jacksonville, FL | 1.0–3.0 | 1.0–2.0 | 1040 | $1,999 | $1.92 | 3d | 19 | 1.11mi |
| 1485 Fouraker Rd Jacksonville, FL | 1.0–3.0 | 1.0–2.0 | 947 | $1,965 | $2.07 | 2d | 55 | 1.12mi |
| 8697 Elmo Ln Jacksonville, FL | 4.0 | 2.5 | 1500 | $1,975 | $1.32 | 23d | 1 | 1.19mi |
| 1484 Bloomingdale Rd Jacksonville, FL | 3.0 | 2.0 | 1266 | $1,899 | $1.50 | 4d | 1 | 1.20mi |
| 1512 Rebecca Dr Jacksonville, FL | 3.0 | 2.0 | 1694 | $1,895 | $1.12 | 14d | 1 | 1.24mi |
| 8642 Hammond Forest Dr Jacksonville, FL | 3.0 | 2.0 | 1773 | $1,900 | $1.07 | 7d | 1 | 1.25mi |
| 8642 Hammond Forest Dr Jacksonville, FL | 3.0 | 2.0 | 1773 | $1,900 | $1.07 | 17d | 1 | 1.25mi |
| 7010 Arques Rd Jacksonville, FL | 3.0 | 1.0 | 1428 | $1,595 | $1.12 | 11d | 1 | 1.28mi |
| 7010 Arques Rd Jacksonville, FL | 3.0 | 1.0 | 1428 | $1,595 | $1.12 | 14d | 1 | 1.28mi |
| 8331 Old Plank Rd Jacksonville, FL | 3.0 | 2.0 | 1080 | $1,595 | $1.48 | 17d | 1 | 1.28mi |
| 909 La Marche Dr Jacksonville, FL | 3.0 | 1.0 | 1326 | $1,600 | $1.21 | 20d | 1 | 1.42mi |
| 711 Cahoon Rd N Jacksonville, FL | 4.0 | 2.0 | 1670 | $1,850 | $1.11 | 14d | 1 | 1.44mi |
| 6781 Grace Ln Jacksonville, FL | 4.0 | 3.0 | 1296 | $2,300 | $1.77 | 23d | 1 | 1.47mi |
HOA detail
- Monthly dues
- $135 · $1,620/yr
Listing history 3 events
-
2026-06-18days on market $221,705 Active 2 DOM
-
2026-06-16remarks 545-char remark
Show marketing remark (392 chars)
Charming 3-bedroom, 2.5-bath townhome featuring a cozy kitchen that overlooks a spacious great room, perfect for entertaining. The primary bedroom is conveniently located upstairs for added privacy. This home also includes a 1-car garage, providing both parking and storage space. Ideal for comfortable living in a well-designed layout. * Photos are representative of the Arlington floor plan
-
2026-06-16$221,705 Active 1 DOM
Show marketing remark (392 chars)
Charming 3-bedroom, 2.5-bath townhome featuring a cozy kitchen that overlooks a spacious great room, perfect for entertaining. The primary bedroom is conveniently located upstairs for added privacy. This home also includes a 1-car garage, providing both parking and storage space. Ideal for comfortable living in a well-designed layout. * Photos are representative of the Arlington floor plan
ⓘ Source: listings_history table (triggers on properties + properties_extension) + one-shot
backfill from property_details.listing_events for pre-trigger history.
Tax reassessment forecast FL · Resets to sale price
- Current annual tax
- $771 · $64/mo
- Projected year-2 tax
- $1,840 · $153/mo
- Expected delta
- +$1,069/yr (+$89/mo · 138.7%)
ⓘ Screening estimate from a state-policy table — verify with the county assessor before closing.
Nearby sold comps map
Loading sold comps map…
Walkable amenities ~0.75 mi
Loading nearby amenities…
Taxation est. · year 1
- Rental income
- $23,278
- − Mortgage interest
- −$12,419
- − Property taxes
- −$771
- − Insurance
- −$1,109
- − Repairs & maintenance
- −$1,862
- − Management
- −$1,862
- − HOA
- −$1,620
- − Depreciation
- −$6,450
- Taxable loss
- −$2,815
- Est. tax savings @ 24.0%
- +$675
- After-tax cash flow
- $1,614/yr
For passive investors: Depreciation is non-cash, so a rental often shows a tax loss while cash-flowing — sheltering income. Rental losses are passive: they offset passive income freely, and up to $25,000/yr can offset ordinary (W-2) income if you actively participate and your MAGI is under $100k (phasing out to $0 by $150k); unused losses carry forward. On sale, claimed depreciation is recaptured at up to 25%, and gains may owe capital-gains tax (a 1031 exchange can defer both). Figures are a year-1 estimate at your 24.0% rate — not tax advice; consult a CPA.
Schools (NCES district)
- District
- Duval
- NCES district ID
- 1200480
- Math proficiency
- 46% ▼ -11.00%
- Reading proficiency
- 45% ▼ -4.00%
- Median HH income
- $48,987
- Composite
- 38.97/100
- National rank
- #4076
- State rank
- #48 of 73 in FL
Livability — Jacksonville
- Score
- 83/100
- State rank
- #50
- US rank
- #911
Category grades
Schools grade is shown separately in the Schools card above.
Census & demographics
- Census place
- Jacksonville, FL
- County
- Duval County · 1,015,274 people
- City population
- 979,034
- Metro
- Jacksonville, FL
- Population (ZIP)
- 32,833
- Household income
- $82,969
- Rent vs Own
- Severe rent burden
- 516.0
Population outlook (Duval County) Hauer SSP2
- Today (2025)
- 1,013,010 people
- By 2030
- 1,059,228 · +4.6%
- By 2040
- 1,141,439 · +12.7%
- By 2050
- 1,205,258 · +19.0%
- By 2075
- 1,324,282 · +30.7%
- By 2100
- 1,319,620 · +30.3%
Race, ethnicity, and origin ACS 2023
- Neighborhood character
- Diverse neighborhood (Simpson 0.65)
- Race & ethnicity
- White 48% Black 33% Hispanic / Latino 9% Two or more races 6% Asian 4%
- Hispanic origin (detail)
- Mexican 2% Puerto Rican 5%
- Common ancestry
- Italian 3% Slovak 2% Hispanic 1%
- Foreign-born
- 9% · Canada, Vietnam
- Languages at home
- 88% English-only · Spanish 6% French/Haitian/Cajun 2% Vietnamese 2%
Political lean MEDSL · Duval
- 2024 margin
- Toss-up / Even · D 48.7% · R 50.1% · Other 1.2%
- 2008→2024 swing
- +0.4pp no change · 2008: -1.9pp · 2024: -1.5pp
- All cycles
- 2024: R+1.5 2020: D+3.8 2016: R+1.5 2012: R+3.6 2008: R+1.9
Not yet ingested
- Civics
- —
Market trends
- HPI YoY
- ▼ -62.74%
- Current HPI
- 263.7591
- Rent YoY
- ▲ 2.12%
- Metro
- Jacksonville, FL
- State GDP YoY
- ▲ 3.28%
- F500 in state
- 36
Industry mix (Fortune 500 HQ in FL)
| Industry | F500 HQs | Revenue |
|---|---|---|
| Industrial Technology | 2 | $29B |
|
||
| Insurance | 2 | $17B |
|
||
| Retail | 1 | $60B |
|
||
| Technology Distribution | 1 | $58B |
|
||
| Homebuilding | 1 | $35B |
|
||
| Technology Manufacturing | 1 | $35B |
|
||
Price history
+0.0% since first listed2 events — show timeline
- 2026-06-16 Listed $221,705 Zillow
- 2026-06-16 Listed $221,705 realMLS
Cash-flow waterfall
monthlySold comps — $/sqft
last 12 mo · ≤1 miLoading sold comps…