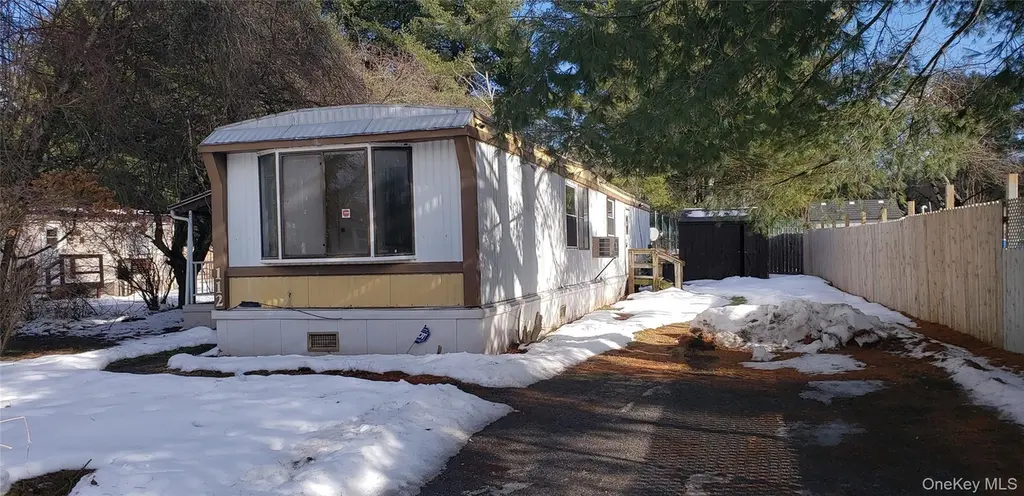
112 Cambridge Cirlcle · Loch Sheldrake, NY
Flood risk 1/10 · Minimal
- FEMA flood zone
- X (unshaded)
- Chance of flooding over 30 yrs
- 0.0%
- Est. flood insurance / yr
- $507 – $1,088
Fire risk 1/10 · Minimal
- Est. fire insurance / yr
- $691 – $1,283
Heat risk 2/10 · Minimal
- Hot days now (above 91°F)
- 7 days/yr
- Hot days in 30 yrs
- 16 days/yr
Wind risk 3/10 · Minor
- Chance of severe wind over 30 yrs
- 4.0%
Air-quality risk 2/10 · Minimal
- Unhealthy air days now
- 0 days/yr
- Unhealthy air days in 30 yrs
- 1 days/yr
Risk factors via First Street. Map © Google.
Why this score? — see what drove the C+ grade
The composite is a weighted blend of 9 inputs, each scored 0–100. Each bar is that input's sub-score; the figure is the points it added to the 100-point composite (weight × sub-score).
- Cash flow +15.7/30.0
- 1% rule +10.0/10.0
- Appreciation +10.0/10.0
- ARV discount +7.5/15.0
- DSCR +4.9/10.0
- Condition / age +4.0/5.0
- Schools +3.6/10.0
- Livability +3.2/5.0
- Rent growth +2.5/5.0
$50,000
🖨 Deal sheet 📄 Offer letter ✓ Due diligence
Listing remarks MLS
This manufactured home is situated on a nice lot in the River Valley Estates mobile home park, located within the Tri-Valley School District. The home features 2 bedrooms and 2 bathrooms, an eat-in kitchen, a living room, washer and dryer hookups, and a sun porch perfect for enjoying warm summer nights. The community offers amenities such as a clubhouse, basketball court, tennis courts, and a playground. The owner is open to considering possible owner financing.
Key facts
- Clubhouse
- Sun porch
- Basketball court
Tags
Neighborhood map
What this means for you Summary
Snapshot
- This is a 2-bed/2.0-bath manufactured listed at $50k. Condition is rated good.
Deal economics
- At list price, monthly cash flow is $22 ($268/yr) — positive.
- The deal already cash-flows at list — no discount required.
- Meets the 1% rule at list price ($1k rent vs $50k).
- Recommended offer: $44k (12.0% below list) — sets the bar for market timing.
Location & tenants
- Location reads 63/100 on livability (#793 in NY) — a middle-class / working-renter tenant base. Strengths: cost of living A+, crime A-, housing A-; Watch: schools F, amenities F, commute F.
- Tri-Valley Central School District (rural): math 38% / reading 46% proficiency, ranked #488 of 590 in NY (top 83%) — families likely to look elsewhere, expect single-tenant / working-renter base with shorter leases.
- Market conditions: 22 active listings in the ZIP; 739 units permitted in Sullivan County in 2024 (5 in 5+ unit buildings).
Forward outlook
- In year one you build about $5k of equity ($346 loan paydown + $5k appreciation (10.0% local appreciation)).
- Sullivan County population projected at -24% by 2050 — secular population decline; favor cash flow + early exit over multi-decade hold.
- At projected returns (10.0% appreciation + 3.0% rent growth), your $14k cash investment doubles in ~3 years — after that, you're playing with house money.
- By year 6, paydown + projected appreciation supports a ~$31k cash-out refi (75% LTV) — recoverable capital for the next deal without selling this one.
Negotiation context
- It's been on market 144 days — a 12% lower offer ($44k) is reasonable based on typical stale-listing flexibility.
Risks & watch-outs
- Watch-outs: HOA is 53% of rent.
Questions for the listing agent
- It's been on market 144 days. Have you received any prior offers? Is the seller open to a 12% concession, seller financing, or rate buy-down credit?
- Built in 1975 — when were the roof, HVAC, electrical panel, plumbing, and water heater last replaced?
- What does the HOA fee cover, when was the last increase, and are there any pending special assessments or reserve-fund shortfalls?
- Why hasn't it sold? Are there any deal-killer items the seller is aware of (foundation, flood, title, zoning, code violations)?
- Is there a deadline driving the sale (1031 exchange, divorce, estate, relocation)? That informs how much negotiation room exists.
- Schools are F-rated, which usually means shorter tenancies and higher turnover. Who's the typical renter profile here, and what's been the actual vacancy rate?
- What's the average days-on-market for RENTAL listings here right now (not sales)? A rising rental-DOM trend means longer vacancies and softer asking-rent achievability than the comps imply.
- What's the recent tenant-quality profile in this submarket — average credit score on applications, eviction rate, late-payment / NSF rate, and stable-employment percentage? A property-management company in the area should have these aggregated.
- How much new for-sale + rental construction is in the pipeline within 1–3 miles? Heavy new supply typically softens prices + rents 12–24 months out; constrained supply supports both.
Investment metrics
- 1% rule
- 2.84% ✓
- Cap rate
- 6.83%
- Cash-on-cash
- 1.92%
- DSCR
- 1.09
- GRM
- 2.9
CMA / ARV
No comps found within radius.
Projected returns pro-forma
10.0% appreciation · 3.0% rent growth · sell at horizon
- IRR
- 26.0%
- Equity multiple
- 3.08×
- Total profit
- $29,141
- Equity at exit
- $45,044
- IRR
- 23.1%
- Equity multiple
- 7.12×
- Total profit
- $85,659
- Equity at exit
- $97,139
Cash invested: $14,000 (down + closing). Projections, not guarantees.
Landlord ↔ Tenant lean methodology
- Overall (STATE)
- 15 Strongly Tenant-Friendly
- State New York
- 15 Strongly Tenant-Friendly · D+10
- County
- — inherits STATE
- City
- — inherits STATE
ZIP-level market 12759
- Home prices YoY
- 5.1%
- Active inventory
- 22
- Price-to-rent
- 2.9×
Monthly cashflow live
- Estimated rent
- $1,420 medium interval (Pro) →
- Mortgage (P&I)
- −$262
- Tax est. 1.5%
- −$62 /mo · $750/yr
- Insurance
- −$21
- HOA
- −$754
- Vacancy / Maint / Mgmt
- −$298
- Net cashflow
- $22
Break-even live
UW: 25.0% down · 7.5% · 30yr · 1.5% tax · 5.0% vac · 8.0% maint · 8.0% mgmt
Financing live
Cash to close
- Down payment
- $12,500
- Closing costs
- $1,500
- Reserves months
- —
- Total cash needed
- —
Loan-product check · same deal, 3 products live
Conventional
25% down · 7.5% · 30yr
- Down + closing
- —
- Monthly P&I
- —
- Monthly cashflow
- —
- DSCR
- —
- Eligible?
- —
Personal DTI + credit; lowest rate.
DSCR
20% down · 8.5% · 30yr
- Down + closing
- —
- Monthly P&I
- —
- Monthly cashflow
- —
- DSCR
- —
- Eligible?
- —
No personal income docs; deal must DSCR.
Hard money
10% down · 12.0% · 12mo
- Down + closing
- —
- Monthly P&I
- —
- Monthly cashflow
- —
- DSCR
- —
- Eligible?
- —
Short-term bridge; refi at stabilization.
HOA detail
- Monthly dues
- $754 · $9,048/yr
Listing history 9 events
-
2026-06-08days on market $50,000 Active 144 DOM
-
2026-06-07days on market $50,000 Active 143 DOM
-
2026-06-07days on market $50,000 Active 142 DOM
-
2026-06-04days on market $50,000 Active 139 DOM
-
2026-06-02days on market $50,000 Active 138 DOM
-
2026-06-01days on market $50,000 Active 137 DOM
-
2026-05-31days on market $50,000 Active 136 DOM
-
2026-04-24price $50,000 466-char remark
Show marketing remark (466 chars)
This manufactured home is situated on a nice lot in the River Valley Estates mobile home park, located within the Tri-Valley School District. The home features 2 bedrooms and 2 bathrooms, an eat-in kitchen, a living room, washer and dryer hookups, and a sun porch perfect for enjoying warm summer nights. The community offers amenities such as a clubhouse, basketball court, tennis courts, and a playground. The owner is open to considering possible owner financing.
-
2026-01-15$59,500 Active 466-char remark
Show marketing remark (466 chars)
This manufactured home is situated on a nice lot in the River Valley Estates mobile home park, located within the Tri-Valley School District. The home features 2 bedrooms and 2 bathrooms, an eat-in kitchen, a living room, washer and dryer hookups, and a sun porch perfect for enjoying warm summer nights. The community offers amenities such as a clubhouse, basketball court, tennis courts, and a playground. The owner is open to considering possible owner financing.
ⓘ Source: listings_history table (triggers on properties + properties_extension) + one-shot
backfill from property_details.listing_events for pre-trigger history.
Climate risk First Street
- Flood 1/10 Low FEMA zone X (unshaded) · 0% chance over 30 yrs
- Wildfire 1/10 Low
- Heat 2/10 Low 7 d/yr ≥91°F today · 16 d/yr by 30 yrs out
- Wind 3/10 Moderate 4% chance of damaging wind over 30 yrs
- Air quality 2/10 Low 0 unhealthy d/yr today · 1 by 30 yrs out
Nearby sold comps map
Loading sold comps map…
Walkable amenities ~0.75 mi
Loading nearby amenities…
Taxation est. · year 1
- Rental income
- $17,042
- − Mortgage interest
- −$2,801
- − Property taxes
- −$750
- − Insurance
- −$250
- − Repairs & maintenance
- −$1,363
- − Management
- −$1,363
- − HOA
- −$9,048
- − Depreciation
- −$1,455
- Taxable income
- $12
- Est. tax owed @ 24.0%
- −$3
- After-tax cash flow
- $266/yr
For passive investors: Depreciation is non-cash, so a rental often shows a tax loss while cash-flowing — sheltering income. Rental losses are passive: they offset passive income freely, and up to $25,000/yr can offset ordinary (W-2) income if you actively participate and your MAGI is under $100k (phasing out to $0 by $150k); unused losses carry forward. On sale, claimed depreciation is recaptured at up to 25%, and gains may owe capital-gains tax (a 1031 exchange can defer both). Figures are a year-1 estimate at your 24.0% rate — not tax advice; consult a CPA.
Condition & rehab AI · 12 photos
This manufactured home is in good condition with minimal repairs needed. It is move-in ready and has the potential for further value increases through cosmetic updates and landscaping.
Value-add opportunities
- Both Paint touch-ups — Fresh paint enhances curb appeal and interior aesthetics
- Both Landscaping — Landscaping can significantly improve curb appeal and property value
- Both Add a small front porch — A small front porch can enhance curb appeal and provide a welcoming entrance
Renovation cost estimate screening
Value-add ROI direction
- Both Paint touch-ups — Fresh paint enhances curb appeal and interior aesthetics ↑
- Both Landscaping — Landscaping can significantly improve curb appeal and property value ↑
- Both Add a small front porch — A small front porch can enhance curb appeal and provide a welcoming entrance ↑
ⓘ Cost ranges are severity-bucket heuristics (US national rule-of-thumb). Get contractor quotes + a written scope before underwriting a rehab budget.
Schools (NCES district)
- District
- Tri-Valley Central School District
- NCES district ID
- 3628890
- Math proficiency
- 38% ▼ -10.00%
- Reading proficiency
- 46% ▲ 2.00%
- Median HH income
- $53,543
- Composite
- 36.47/100
- National rank
- #4662
- State rank
- #488 of 590 in NY
Livability — Loch Sheldrake
- Score
- 63/100
- State rank
- #793
- US rank
- #15202
Category grades
Schools grade is shown separately in the Schools card above.
Census & demographics
- City population
- 2,036
- Population (ZIP)
- 1,835
Population outlook (Sullivan County) Hauer SSP2
- Today (2025)
- 68,974 people
- By 2030
- 65,609 · -4.9%
- By 2040
- 58,878 · -14.6%
- By 2050
- 52,500 · -23.9%
- By 2075
- 39,941 · -42.1%
- By 2100
- 28,880 · -58.1%
Race, ethnicity, and origin ACS 2023
- Neighborhood character
- Highly diverse neighborhood (Simpson 0.71)
- Race & ethnicity
- White 39% Black 33% Hispanic / Latino 17% Two or more races 8% Native American 2% Asian 1%
- Hispanic origin (detail)
- Puerto Rican 2% Dominican 5%
- Common ancestry
- Scotch-Irish 3% Romanian 3% Lithuanian 2%
- Foreign-born
- 13% · Canada
- Languages at home
- 78% English-only · Russian/Polish/Slavic 12% Spanish 8% Tagalog/Filipino 2%
Political lean MEDSL · Sullivan
- 2024 margin
- R (+16.7) · D 41.6% · R 58.4%
- 2008→2024 swing
- -26.2pp toward R · 2008: 9.5pp · 2024: -16.7pp
- All cycles
- 2024: R+16.7 2020: R+9.2 2016: R+13.7 2012: D+10.4 2008: D+9.5
Not yet ingested
- Civics
- —
Market trends
- HPI YoY
- ▲ 23.94%
- Current HPI
- 495.297
- Rent YoY
- —
- Metro
- —
- State GDP YoY
- ▲ 2.60%
- F500 in state
- 92
Industry mix (Fortune 500 HQ in NY)
| Industry | F500 HQs | Revenue |
|---|---|---|
| Financial Services | 10 | $950B |
|
||
| Consumer Goods | 9 | $162B |
|
||
| Insurance | 4 | $225B |
|
||
| Telecommunications | 2 | $144B |
|
||
| Pharmaceuticals | 2 | $112B |
|
||
| Media / Entertainment | 2 | $69B |
|
||
Price history
-16.0% since first listed2 events — show timeline
- 2026-04-24 Price Changed $50,000 OneKey® MLS as Distributed by MLS Grid
- 2026-01-15 Listed $59,500 OneKey® MLS as Distributed by MLS Grid
Cash-flow waterfall
monthlySold comps — $/sqft
last 12 mo · ≤1 miLoading sold comps…