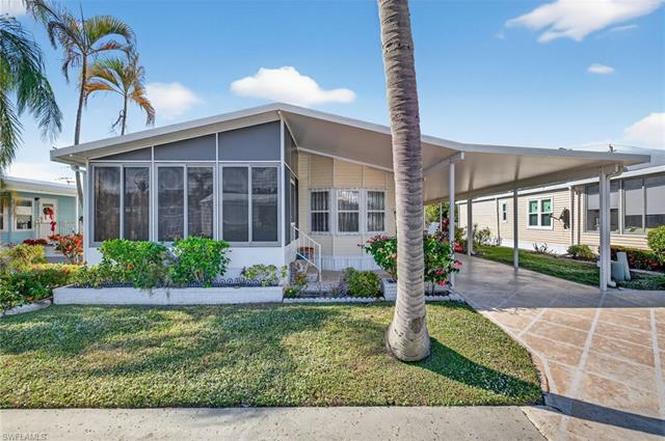
212 Oceans Blvd #212 · Berkshire Lakes, FL
Flood risk 5/10 · Moderate
- FEMA flood zone
- X (shaded)
- Chance of flooding over 30 yrs
- 0.48%
- Est. flood insurance / yr
- $507 – $1,088
Fire risk 1/10 · Minimal
- Est. fire insurance / yr
- $947 – $1,759
Heat risk 10/10 · Severe
- Hot days now (above 107°F)
- 7 days/yr
- Hot days in 30 yrs
- 27 days/yr
Wind risk 10/10 · Severe
- Chance of severe wind over 30 yrs
- 99.0%
Air-quality risk 2/10 · Minimal
- Unhealthy air days now
- 2 days/yr
- Unhealthy air days in 30 yrs
- 2 days/yr
Risk factors via First Street. Map © Google.
Why this score? — see what drove the B grade
The composite is a weighted blend of 9 inputs, each scored 0–100. Each bar is that input's sub-score; the figure is the points it added to the 100-point composite (weight × sub-score).
- Cash flow +30.0/30.0
- DSCR +10.0/10.0
- 1% rule +9.6/10.0
- ARV discount +7.5/15.0
- Schools +5.0/10.0
- Condition / age +3.8/5.0
- Livability +2.5/5.0
- Rent growth +2.2/5.0
- Appreciation +0.0/10.0
$209,000
🖨 Deal sheet 📄 Offer letter ✓ Due diligence
Listing remarks
Welcome to easy Florida living in this furnished, move-in-ready two-bedroom, two-bath home located within a desirable 55+ community. Recent improvements include windows, shutters, along with updated flooring throughout the living, dining, and kitchen areas, enhancing both comfort and style. Bright and open, the interior is filled with natural light, creating a warm and welcoming atmosphere throughout the day. Enjoy outdoor living with multiple spaces designed for relaxation and entertaining. The backyard patio is ideal for afternoon enjoyment, while the extended side carport/lanai area offers a great setting for evening cookouts and gatherings with friends. An additional parking pad provide
Key facts
- Backyard patio
- Move-in-ready
- Updated flooring
Tags
Property features AI
Finance
- Other: Property is subject to lease (possession per lease); Unit number 212 in a complex of 212 units; Total area listed as 1965; Lot described as regular; lot unit 212; architectural restrictions
- HOA & community: Monthly fee of $162; Annual recurring fees total $1,944; One-time fees $100; Professional management; Maintenance includes lawn/land, legal/accounting, manager, recreation facilities, reserves, street lights, and street maintenance; Community amenities: clubhouse, community pool, spa/hot tub, bocce court, tennis court, pickleball, shuffleboard, fishing pier, sidewalks, extra storage, streetlights; Community type: mobile/manufactured, non-gated
Exterior
- Parking: Attached 2-space carport
- Security: Completely fenced; Gated community; Manual storm shutters
- Utilities: Central water; Central sewer; Electric power
- Home design: Residential manufactured home; 1 story / ranch; Rear exposure to the west; Manufactured building design
- Construction: Manufactured construction; Vinyl siding exterior; Roof over; Built in 1989; 1 story
- Exterior features: Decorative shutters; Fence; Patio; Automatic sprinkler system; Landscaped area view; Central irrigation
Interior
- Kitchen: Pantry; Dishwasher; Disposal; Microwave; Self-cleaning oven; Refrigerator/Icemaker
- Bedrooms: 2 bedrooms; Master bedroom on ground level
- Flooring: Carpet; Vinyl
- Bathrooms: 2 full bathrooms; Master bath with shower only
- Heating & cooling: Central electric heat; Central electric cooling; Ceiling fans
- Interior features: Built-in cabinets; Pantry; Vaulted ceiling; Walk-in closet; Window coverings; Formal dining; Great room floor plan; Furnished; 4 ceiling fans; Laundry in residence
- Laundry & utility: Washer; Dryer
Neighborhood map
What this means for you Summary
Snapshot
- This is a 2-bed/2.0-bath manufactured listed at $209k. Condition is rated good.
Deal economics
- At list price, monthly cash flow is $804 ($10k/yr) — positive.
- The deal already cash-flows at list — no discount required.
- Meets the 1% rule at list price ($3k rent vs $209k).
- Recommended offer: $184k (12.0% below list) — sets the bar for market timing.
Location & tenants
- Location reads: area grade B — affects rentability + tenant quality, not the cash-flow math above.
- Collier (suburban): math 60% / reading 56% proficiency, ranked #16 of 73 in FL (top 22%) — acceptable for families but not a draw, mixed tenant base, ~2y average lease.
- Zoned schools: Shadowlawn Elementary School (math 44% / reading 40%, grade F, #1,403 of 2,144 statewide, top 67%, 457 students, 72% FRL); Naples High School (math 47% / reading 52%, grade D, #179 of 667 statewide, top 29%, 1,719 students, 39% FRL) — zoned schools at 55% FRL track the district average.
- Zoned-school proficiency averages 46% at this address vs 58% district-wide (-12 pts) — the specific schools serving this property underperform the Collier average; the district grade overstates school quality for this exact location.
- Market conditions: Rents soft (-1.1%/yr); 436 active listings in the ZIP; 40 comparable units currently listed for rent nearby; rentals at typical pace (median 24d on market — plan ~3-4 weeks tenant-placement turnaround); 3,520 units permitted in Collier County in 2024 (959 in 5+ unit buildings).
- At $3,051/mo this rent would consume 51% of the median local household income ($72k/yr) (locally 1423% of renters already pay >50% of income on rent) — very limited rent-growth headroom before tenants either downsize or default.
Forward outlook
- Local home prices are declining (-3.0%/yr); year-one equity from $1k of loan paydown is wiped out by about $6k of value loss. Plan a longer hold.
- Collier County population projected at +30% by 2050 — long-run rental-demand tailwind backs the buy-and-hold thesis.
Negotiation context
- It's been on market 157 days — a 12% lower offer ($184k) is reasonable based on typical stale-listing flexibility.
Risks & watch-outs
- Climate carrying-cost: moderate flood risk; severe wind risk, 99% chance of damaging wind over 30y; extreme-heat days projected 7→27/yr by 2055 (HVAC capex compounding) — expect insurance premiums to compound above CPI over the hold.
Questions for the listing agent
- It's been on market 157 days. Have you received any prior offers? Is the seller open to a 12% concession, seller financing, or rate buy-down credit?
- What does the HOA fee cover, when was the last increase, and are there any pending special assessments or reserve-fund shortfalls?
- Why hasn't it sold? Are there any deal-killer items the seller is aware of (foundation, flood, title, zoning, code violations)?
- Is there a deadline driving the sale (1031 exchange, divorce, estate, relocation)? That informs how much negotiation room exists.
- What's the average days-on-market for RENTAL listings here right now (not sales)? A rising rental-DOM trend means longer vacancies and softer asking-rent achievability than the comps imply.
- What's the recent tenant-quality profile in this submarket — average credit score on applications, eviction rate, late-payment / NSF rate, and stable-employment percentage? A property-management company in the area should have these aggregated.
- How much new for-sale + rental construction is in the pipeline within 1–3 miles? Heavy new supply typically softens prices + rents 12–24 months out; constrained supply supports both.
Investment metrics
- 1% rule
- 1.46% ✓
- Cap rate
- 10.91%
- Cash-on-cash
- 16.49%
- DSCR
- 1.73
- GRM
- 5.7
CMA / ARV
No comps found within radius.
Projected returns pro-forma
-3.0% appreciation · 0.0% rent growth · sell at horizon
- IRR
- 3.9%
- Equity multiple
- 1.15×
- Total profit
- $8,556
- Equity at exit
- $31,163
- IRR
- 10.2%
- Equity multiple
- 1.67×
- Total profit
- $39,437
- Equity at exit
- $18,071
Cash invested: $58,520 (down + closing). Projections, not guarantees.
Landlord ↔ Tenant lean methodology
- Overall (STATE)
- 87 Strongly Landlord-Friendly
- State Florida
- 87 Strongly Landlord-Friendly · R+3
- County
- — inherits STATE
- City
- — inherits STATE
ZIP-level market 34104
- Rents YoY
- -1.1%
- Active inventory
- 436
- Price-to-rent
- 5.7×
Monthly cashflow live
- Estimated rent
- $3,051 high interval (Pro) →
- Mortgage (P&I)
- −$1,096
- Tax est. 1.5%
- −$261 /mo · $3,135/yr
- Insurance
- −$87
- HOA
- −$162
- Vacancy / Maint / Mgmt
- −$641
- Net cashflow
- $804
Break-even live
UW: 25.0% down · 7.5% · 30yr · 1.5% tax · 5.0% vac · 8.0% maint · 8.0% mgmt
Financing live
Cash to close
- Down payment
- $52,250
- Closing costs
- $6,270
- Reserves months
- —
- Total cash needed
- —
Loan-product check · same deal, 3 products live
Conventional
25% down · 7.5% · 30yr
- Down + closing
- —
- Monthly P&I
- —
- Monthly cashflow
- —
- DSCR
- —
- Eligible?
- —
Personal DTI + credit; lowest rate.
DSCR
20% down · 8.5% · 30yr
- Down + closing
- —
- Monthly P&I
- —
- Monthly cashflow
- —
- DSCR
- —
- Eligible?
- —
No personal income docs; deal must DSCR.
Hard money
10% down · 12.0% · 12mo
- Down + closing
- —
- Monthly P&I
- —
- Monthly cashflow
- —
- DSCR
- —
- Eligible?
- —
Short-term bridge; refi at stabilization.
Rent comps 40 comps
| Address | Beds | Baths | Sqft | Rent | $/sqft | DOM | Units | Dist |
|---|---|---|---|---|---|---|---|---|
| 6643 Craven Hill Way Naples, FL | 3.0 | 2.0 | 1384 | $2,900 | $2.10 | 13d | 1 | 0.48mi |
| 6825 Sterling Greens Dr #102 Naples, FL | 3.0 | 2.0 | 1499 | $4,500 | $3.00 | 23d | 1 | 0.62mi |
| 6816 Sterling Greens Dr Unit 1105 Naples, FL | 2.0 | 2.0 | 1243 | $1,895 | $1.52 | 13d | 1 | 0.65mi |
| 6816 Sterling Greens Pl #105 Naples, FL | 2.0 | 2.0 | 1243 | $1,895 | $1.52 | 21d | 1 | 0.65mi |
| 193 Fox Glen Dr Naples, FL | 3.0 | 2.0 | 1345 | $6,500 | $4.83 | 23d | 1 | 0.66mi |
| 6828 Sterling Greens Dr Unit 4105 Naples, FL | 2.0 | 2.0 | 1242 | $3,750 | $3.02 | 13d | 1 | 0.67mi |
| 5301 Whitten Dr #81 Naples, FL | 3.0 | 2.0 | 1386 | $2,700 | $1.95 | 23d | 1 | 0.77mi |
| 7065 Dennis Cir #302 Naples, FL | 2.0 | 2.0 | 1097 | $4,000 | $3.65 | 21d | 1 | 0.80mi |
| 6700 Dennis Cir Unit A103 Naples, FL | 2.0 | 2.0 | 1308 | $2,000 | $1.53 | 13d | 1 | 0.84mi |
| 1051 Eastham Way Unit B104 Naples, FL | 2.0 | 2.0 | 1091 | $4,300 | $3.94 | 13d | 1 | 0.84mi |
| 613 Windsor Sq #101 Naples, FL | 2.0 | 2.0 | 1316 | $3,800 | $2.89 | 23d | 1 | 0.85mi |
| 5257 Whitten Dr Naples, FL | 2.0 | 2.0 | 1500 | $2,500 | $1.67 | 13d | 1 | 0.85mi |
| 1100 Eastham Way Unit A-105 Naples, FL | 2.0 | 2.0 | 1184 | $4,500 | $3.80 | 13d | 1 | 0.88mi |
| 565 Windsor Sq #201 Naples, FL | 3.0 | 2.0 | 1421 | $3,800 | $2.67 | 21d | 1 | 0.89mi |
| 800 New Waterford Dr #201 Naples, FL | 2.0 | 2.0 | 1362 | $2,440 | $1.79 | 21d | 1 | 0.90mi |
| 636 Windsor Sq #102 Naples, FL | 2.0 | 2.0 | 1191 | $3,750 | $3.15 | 23d | 1 | 0.90mi |
| 541 Windsor Sq Unit 9 Naples, FL | 2.0 | 2.0 | 1421 | $2,500 | $1.76 | 13d | 1 | 0.91mi |
| 1075 Foxfire Ln Naples, FL | 2.0 | 2.0 | 1092 | $3,300 | $3.02 | 23d | 3 | 0.96mi |
| 505 Windsor Sq #201 Naples, FL | 3.0 | 2.0 | 1191 | $2,365 | $1.99 | 13d | 1 | 0.97mi |
| 882 Bluebird St Naples, FL | 3.0 | 2.0 | 1308 | $6,000 | $4.59 | 23d | 1 | 0.97mi |
| 529 Mardel Dr #311 Naples, FL | 2.0 | 2.0 | 1093 | $3,500 | $3.20 | 23d | 1 | 0.98mi |
| 717 Landover Cir #103 Naples, FL | 2.0 | 2.0 | 1300 | $3,800 | $2.92 | 23d | 1 | 1.02mi |
| 915 New Waterford Dr Unit H201 Naples, FL | 2.0 | 2.0 | 1362 | $4,150 | $3.05 | 13d | 1 | 1.02mi |
| 1748 Royal Cir Naples, FL | 3.0 | 2.0 | 1451 | $3,200 | $2.21 | 23d | 1 | 1.04mi |
| 716 Landover Cir #102 Naples, FL | 2.0 | 2.0 | 1300 | $3,200 | $2.46 | 23d | 1 | 1.04mi |
| 1095 Partridge Cir #201 Naples, FL | 2.0 | 2.0 | 1402 | $1,800 | $1.28 | 21d | 1 | 1.05mi |
| 191 Bennington Dr Unit 12-6 Naples, FL | 2.0 | 2.0 | 1240 | $1,450 | $1.17 | 23d | 1 | 1.06mi |
| 661 Squire Cir #101 Naples, FL | 3.0 | 2.0 | 1450 | $2,095 | $1.44 | 13d | 1 | 1.06mi |
| 1787 Reuven Cir Unit 1001 Naples, FL | 2.0 | 2.0 | 1112 | $1,300 | $1.17 | 13d | 1 | 1.10mi |
| 1130 Partridge Cir Ofc Season Naples, FL | 2.0 | 2.0 | 1191 | $1,800 | $1.51 | 23d | 1 | 1.11mi |
| 1130 Partridge Cir Unit Annual Naples, FL | 2.0 | 2.0 | 1191 | $1,950 | $1.64 | 23d | 1 | 1.11mi |
| 1130 Partridge Cir #102 Naples, FL | 2.0 | 2.0 | 1191 | $3,800 | $3.19 | 23d | 1 | 1.11mi |
| 7320 Glenmoor Ln Unit 2206 Naples, FL | 2.0 | 2.0 | 1053 | $6,000 | $5.70 | 13d | 1 | 1.11mi |
| 4502 Parrot Ave Naples, FL | 3.0 | 2.0 | 1200 | $2,950 | $2.46 | 23d | 1 | 1.18mi |
| 1810 Florida Club Cir Naples, FL | 2.0 | 2.0 | 1200 | $2,075 | $1.73 | 13d | 2 | 1.18mi |
| 1820 Florida Club Cir Naples, FL | 3.0 | 2.0 | 1282 | $2,850 | $2.22 | 23d | 2 | 1.21mi |
| 2972 Kings Lake Blvd #2972 Naples, FL | 2.0 | 2.0 | 1100 | $3,000 | $2.73 | 23d | 1 | 1.22mi |
| 1220 Commonwealth Cir Unit M106 Naples, FL | 2.0 | 2.0 | 1245 | $2,100 | $1.69 | 23d | 1 | 1.23mi |
| 1840 Florida Club Cir #5309 Naples, FL | 2.0 | 1.0 | 1328 | $2,300 | $1.73 | 23d | 1 | 1.23mi |
| 7380 Saint Ives Way Naples, FL | 2.0 | 2.0 | 1026 | $4,400 | $4.29 | 23d | 2 | 1.23mi |
HOA detail
- Monthly dues
- $162 · $1,944/yr
Listing history 12 events
-
2026-06-18days on market $209,000 Active 157 DOM
-
2026-06-17days on market $209,000 Active 156 DOM
-
2026-06-16days on market $209,000 Active 155 DOM
-
2026-06-15days on market $209,000 Active 154 DOM
-
2026-06-14days on market $209,000 Active 152 DOM
-
2026-06-10days on market $209,000 Active 149 DOM
-
2026-06-09days on market $209,000 Active 148 DOM
-
2026-06-08days on market $209,000 Active 147 DOM
-
2026-06-07days on market $209,000 Active 146 DOM
-
2026-06-03days on market $209,000 Active 142 DOM
-
2026-06-03remarks 699-char remark
-
2026-06-03$209,000 Active 141 DOM
ⓘ Source: listings_history table (triggers on properties + properties_extension) + one-shot
backfill from property_details.listing_events for pre-trigger history.
Climate risk First Street
- Flood 5/10 Major FEMA zone X (shaded) · 48% chance over 30 yrs
- Wildfire 1/10 Low
- Heat 10/10 Extreme 7 d/yr ≥107°F today · 27 d/yr by 30 yrs out
- Wind 10/10 Extreme 99% chance of damaging wind over 30 yrs
- Air quality 2/10 Low 2 unhealthy d/yr today · 2 by 30 yrs out
Nearby sold comps map
Loading sold comps map…
Walkable amenities ~0.75 mi
Loading nearby amenities…
Taxation est. · year 1
- Rental income
- $36,616
- − Mortgage interest
- −$11,707
- − Property taxes
- −$3,135
- − Insurance
- −$1,045
- − Repairs & maintenance
- −$2,929
- − Management
- −$2,929
- − HOA
- −$1,944
- − Depreciation
- −$6,080
- Taxable income
- $6,846
- Est. tax owed @ 24.0%
- −$1,643
- After-tax cash flow
- $8,007/yr
For passive investors: Depreciation is non-cash, so a rental often shows a tax loss while cash-flowing — sheltering income. Rental losses are passive: they offset passive income freely, and up to $25,000/yr can offset ordinary (W-2) income if you actively participate and your MAGI is under $100k (phasing out to $0 by $150k); unused losses carry forward. On sale, claimed depreciation is recaptured at up to 25%, and gains may owe capital-gains tax (a 1031 exchange can defer both). Figures are a year-1 estimate at your 24.0% rate — not tax advice; consult a CPA.
Condition & rehab AI · 13 photos
This move-in-ready manufactured home is in good condition with recent updates, making it an attractive option for both buyers and renters. Potential buyers and renters can consider painting the exterior and updating the flooring and kitchen appliances to further enhance its value.
Value-add opportunities
- Both Painting the exterior siding — Enhances curb appeal and can increase both resale and rental value
- Both Updating the flooring in the living and dining areas — Improves the aesthetic and functionality of the living spaces
- Both Upgrading the kitchen appliances — Modernizes the kitchen and can attract more buyers or renters
- Both Installing new blinds or shades in the bedrooms — Enhances privacy and can increase the comfort of the bedrooms
Renovation cost estimate screening
Value-add ROI direction
- Both Painting the exterior siding — Enhances curb appeal and can increase both resale and rental value ↑
- Both Updating the flooring in the living and dining areas — Improves the aesthetic and functionality of the living spaces ↑
- Both Upgrading the kitchen appliances — Modernizes the kitchen and can attract more buyers or renters ↑
- Both Installing new blinds or shades in the bedrooms — Enhances privacy and can increase the comfort of the bedrooms ↑
ⓘ Cost ranges are severity-bucket heuristics (US national rule-of-thumb). Get contractor quotes + a written scope before underwriting a rehab budget.
Schools (NCES district)
- District
- Collier
- NCES district ID
- 1200330
- Math proficiency
- 60% ▼ -4.00%
- Reading proficiency
- 56% ▼ -2.00%
- Median HH income
- $58,275
- Composite
- 50.23/100
- National rank
- #1892
- State rank
- #16 of 73 in FL
Livability — Berkshire Lakes
No livability data for this city. (Only ~50 U.S. cities are tracked.)
Census & demographics
- County
- Collier County · 396,295 people
- Metro
- Naples-Marco Island, FL
- Population (ZIP)
- 26,408
- Household income
- $71,686
- Rent vs Own
- Severe rent burden
- 1423.0
Population outlook (Collier County) Hauer SSP2
- Today (2025)
- 420,858 people
- By 2030
- 450,054 · +6.9%
- By 2040
- 502,232 · +19.3%
- By 2050
- 544,932 · +29.5%
- By 2075
- 627,203 · +49.0%
- By 2100
- 659,015 · +56.6%
Race, ethnicity, and origin ACS 2023
- Neighborhood character
- Majority White (62%)
- Race & ethnicity
- White 62% Hispanic / Latino 30% Two or more races 19% Black 4% Asian 2%
- Hispanic origin (detail)
- Mexican 7% Puerto Rican 3% Cuban 6% Dominican 1%
- Common ancestry
- Lithuanian 6% Romanian 3% Hispanic 2%
- Foreign-born
- 30% · Canada, Jamaica, Dominican Republic
- Languages at home
- 66% English-only · Spanish 24% French/Haitian/Cajun 5% Russian/Polish/Slavic 1%
Political lean MEDSL · Collier
- 2024 margin
- Solid R (+33.1) · D 33.1% · R 66.2%
- 2008→2024 swing
- -10.6pp toward R · 2008: -22.5pp · 2024: -33.1pp
- All cycles
- 2024: R+33.1 2020: R+24.7 2016: R+26.0 2012: R+30.1 2008: R+22.5
Not yet ingested
- Civics
- —
Market trends
- HPI YoY
- ▼ -252.48%
- Current HPI
- 259.3498
- Rent YoY
- ▼ -1.10%
- Metro
- Naples-Marco Island, FL
- State GDP YoY
- ▲ 3.28%
- F500 in state
- 36
Industry mix (Fortune 500 HQ in FL)
| Industry | F500 HQs | Revenue |
|---|---|---|
| Industrial Technology | 2 | $29B |
|
||
| Insurance | 2 | $17B |
|
||
| Retail | 1 | $60B |
|
||
| Technology Distribution | 1 | $58B |
|
||
| Homebuilding | 1 | $35B |
|
||
| Technology Manufacturing | 1 | $35B |
|
||
Price history
-7.1% since first listed2 events — show timeline
- 2026-04-11 Price Changed $209,000 NAPLESMLS
- 2026-01-12 Listed $225,000 NAPLESMLS
Cash-flow waterfall
monthlySold comps — $/sqft
last 12 mo · ≤1 miLoading sold comps…