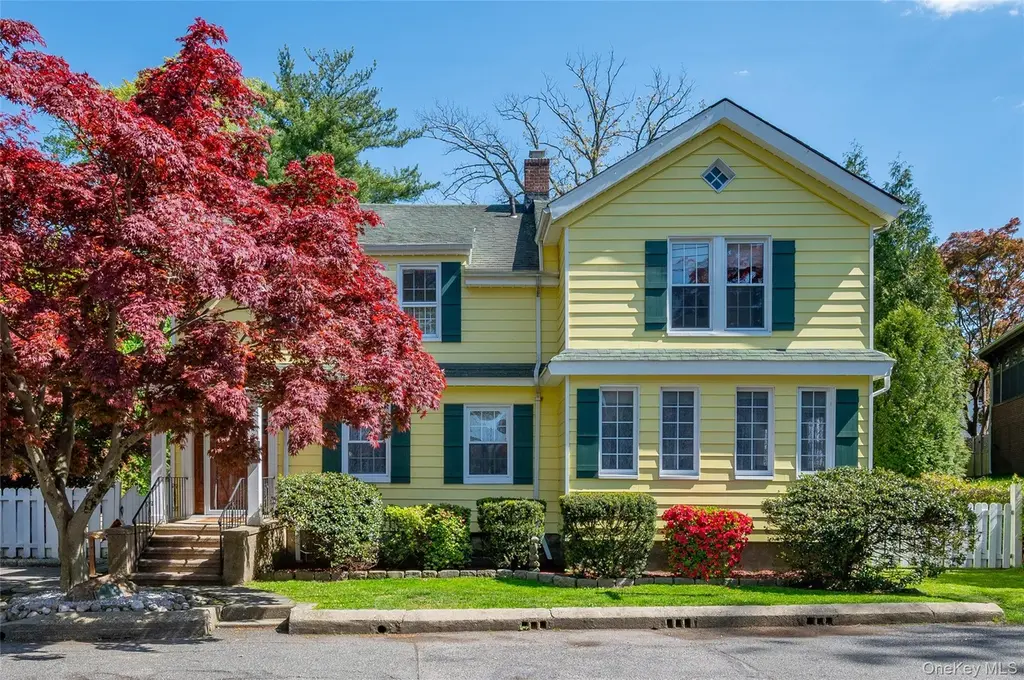
1 Pembroke St · New Rochelle, NY
Flood risk 1/10 · Minimal
- FEMA flood zone
- X (unshaded)
- Chance of flooding over 30 yrs
- 0.0%
- Est. flood insurance / yr
- $473 – $860
Fire risk 1/10 · Minimal
- Est. fire insurance / yr
- $691 – $1,283
Heat risk 6/10 · Moderate
- Hot days now (above 98°F)
- 7 days/yr
- Hot days in 30 yrs
- 16 days/yr
Wind risk 6/10 · Moderate
- Chance of severe wind over 30 yrs
- 27.0%
Air-quality risk 5/10 · Moderate
- Unhealthy air days now
- 6 days/yr
- Unhealthy air days in 30 yrs
- 8 days/yr
Risk factors via First Street. Map © Google.
Why this score? — see what drove the C- grade
The composite is a weighted blend of 9 inputs, each scored 0–100. Each bar is that input's sub-score; the figure is the points it added to the 100-point composite (weight × sub-score).
- ARV discount +15.0/15.0
- Cash flow +14.8/30.0
- Schools +5.7/10.0
- DSCR +4.5/10.0
- 1% rule +3.9/10.0
- Livability +3.5/5.0
- Rent growth +2.9/5.0
- Condition / age +2.5/5.0
- Appreciation +0.0/10.0
$799,000
🖨 Deal sheet 📄 Offer letter ✓ Due diligence
Listing remarks MLS
Tucked at the end of a quiet dead-end in sought-after Stephenson Park, this charming side-hall Colonial delivers space, updates, and a yard that begs for a barbecue invite list. The main level offers a formal living room with crown molding and a stone fireplace, a comfortable family room, an oversized eat-in kitchen. Fresh paint brightens most rooms, while brand-new hardwood floors on the first level and new carpeting upstairs make moving in easy. The kitchen has been refreshed with updated cabinetry, stainless steel appliances, and new stone countertops. Sliding glass doors open to a generous Trex deck overlooking an expansive backyard with loads of room to run, garden, or simply relax. Upstairs you’ll find four well-proportioned bedrooms and a hall bath featuring a Jacuzzi tub. All this, plus a location near Metro-North and major highways, makes daily commuting refreshingly simple. A smart layout, tasteful improvements, and a peaceful setting — this one checks so many boxes
Key facts
- 8,276 sq ft lot
- Built 1906
- Listed 14 days
Neighborhood map
What this means for you Summary
Snapshot
- This is a 3-bed/1.0-bath single-family listed at $799k.
Deal economics
- At list price, monthly cash flow is $226 ($3k/yr) — positive.
- The deal already cash-flows at list — no discount required.
- To meet the 1% rule (rent ≥ 1% of price), the offer needs to be $709k (11.3% below list).
- Recommended offer: $709k (11.3% below list) — sets the bar for 1% rule.
- Cap rate 6.6% vs local median 4.5% in New Rochelle — top-decile yield for the area; either an underpriced asset or a hidden risk that comps aren't pricing in. Stress-test before assuming the spread holds.
Location & tenants
- Location reads 69/100 on livability (#487 in NY) — a middle-class / working-renter tenant base. Strengths: employment A+, crime A, amenities B+; Watch: housing D+, commute F, cost of living F.
- New Rochelle City School District (suburban): math 63% / reading 66% proficiency, ranked #171 of 590 in NY (top 29%) — acceptable for families but not a draw, mixed tenant base, ~2y average lease.
- Market conditions: Rents rising (+1.4%/yr); 138 active listings in the ZIP; 5 comparable units currently listed for rent nearby; rentals leasing fast (median 2d on market — plan ~1-2 weeks tenant-placement turnaround); 40% of comp listings sitting > 30 days — soft ceiling on asking rent; solid renter incomes; 954 units permitted in Westchester County in 2024 (649 in 5+ unit buildings).
- At $7,085/mo this rent would consume 99% of the median local household income ($86k/yr) (locally 2797% of renters already pay >50% of income on rent) — very limited rent-growth headroom before tenants either downsize or default.
Forward outlook
- Local home prices are declining (-3.0%/yr); year-one equity from $6k of loan paydown is wiped out by about $24k of value loss. Plan a longer hold.
- Westchester County population projected at +10% by 2050 — modest demand growth; plan on rents tracking national, not racing it.
Negotiation context
- Only 14 days on market — expect competitive offers; lowballing is unlikely to land.
- Current owner paid $180k; list at $799k implies a 344% gain — meaningful room to come down on a strong offer.
Risks & watch-outs
- Watch-outs: built in 1906 — expect roof / HVAC / electrical / plumbing capex.
- Climate carrying-cost: major wind risk, 27% chance of damaging wind over 30y; extreme-heat days projected 7→16/yr by 2055 (HVAC capex compounding) — expect insurance premiums to compound above CPI over the hold.
Questions for the listing agent
- Built in 1906 — when were the roof, HVAC, electrical panel, plumbing, and water heater last replaced?
- Is there a deadline driving the sale (1031 exchange, divorce, estate, relocation)? That informs how much negotiation room exists.
- What's the average days-on-market for RENTAL listings here right now (not sales)? A rising rental-DOM trend means longer vacancies and softer asking-rent achievability than the comps imply.
- What's the recent tenant-quality profile in this submarket — average credit score on applications, eviction rate, late-payment / NSF rate, and stable-employment percentage? A property-management company in the area should have these aggregated.
- How much new for-sale + rental construction is in the pipeline within 1–3 miles? Heavy new supply typically softens prices + rents 12–24 months out; constrained supply supports both.
Investment metrics
- 1% rule
- 0.89% ✗
- Cap rate
- 6.63%
- Cash-on-cash
- 1.21%
- DSCR
- 1.05
- GRM
- 9.4
CMA / ARV
- ARV (median comp)
- $962,532
- List price
- $799,000
- Delta
- -16.99%
- Verdict
- UNDERPRICED
- Comps
- 20 within 1.0 mi
Show comp detail 12 sales within ~0.75 mi
| Address | Dist | Beds/Ba | Sqft | Sold | Price | $/sf | Match |
|---|---|---|---|---|---|---|---|
| 10 Belmont | 0.13mi | 4/2.5 (+1) | 2,252 (-3%) | 10mo | $960,000 | $426 | 69 |
| 35 Wilson Dr | 0.21mi | 4/2.5 (+1) | 2,209 (-5%) | 11mo | $945,000 | $428 | 61 |
| 93 Petersville Rd | 0.02mi | 4/2.5 (+1) | 2,608 (+12%) | 9mo | $840,000 | $322 | 60 |
| 105 Lispenard Ave | 0.10mi | 4/2.0 (+1) | 2,100 (-10%) | 11mo | $865,000 | $412 | 60 |
| 53 Belmont Ave | 0.23mi | 3/2.5 | 2,058 (-12%) | 11mo | $750,000 | $364 | 54 |
| 51 Lincoln St | 0.41mi | 4/3.0 (+1) | 2,200 (-6%) | 10mo | $850,000 | $386 | 51 |
| 53 Cherry Ave | 0.37mi | 4/2.5 (+1) | 2,099 (-10%) | 11mo | $880,000 | $419 | 46 |
| 38 Weeks Pl | 0.73mi | 4/2.5 (+1) | 2,317 (-1%) | 13mo | $995,000 | $429 | 43 |
| 45 Shadow Ln | 0.50mi | 4/3.0 (+1) | 2,490 (+7%) | 12mo | $1,675,000 | $673 | 43 |
| 25 Shadow Ln | 0.63mi | 4/3.0 (+1) | 2,052 (-12%) | 10mo | $1,600,000 | $780 | 30 |
| 6 Rockwood Dr | 0.74mi | 4/4.0 (+1) | 2,679 (+15%) | 0mo | $2,410,000 | $900 | 24 |
| 42 Schley Ave | 0.72mi | 4/2.5 (+1) | 1,982 (-15%) | 11mo | $868,000 | $438 | 21 |
Match score weights: distance 35% · size 25% · config 20% · recency 20%. Top-matched comps best support the ARV.
Projected returns pro-forma
-3.0% appreciation · 1.42% rent growth · sell at horizon
- IRR
- -16.1%
- Equity multiple
- 0.44×
- Total profit
- $-126,162
- Equity at exit
- $119,133
- IRR
- -10.7%
- Equity multiple
- 0.39×
- Total profit
- $-135,359
- Equity at exit
- $69,083
Cash invested: $223,720 (down + closing). Projections, not guarantees.
Landlord ↔ Tenant lean methodology
- Overall (STATE)
- 15 Strongly Tenant-Friendly
- State New York
- 15 Strongly Tenant-Friendly · D+10
- County
- — inherits STATE
- City
- — inherits STATE
ZIP-level market 10801
- Rents YoY
- 1.4%
- Active inventory
- 138
- Price-to-rent
- 9.4×
Monthly cashflow live
- Estimated rent
- $7,085 high interval (Pro) →
- Mortgage (P&I)
- −$4,190
- Tax from tax record
- −$848 /mo · $10,181/yr
- Insurance
- −$333
- HOA
- −$0
- Vacancy / Maint / Mgmt
- −$1,488
- Net cashflow
- $226
Break-even live
UW: 25.0% down · 7.5% · 30yr · 1.5% tax · 5.0% vac · 8.0% maint · 8.0% mgmt
Financing live
Cash to close
- Down payment
- $199,750
- Closing costs
- $23,970
- Reserves months
- —
- Total cash needed
- —
Loan-product check · same deal, 3 products live
Conventional
25% down · 7.5% · 30yr
- Down + closing
- —
- Monthly P&I
- —
- Monthly cashflow
- —
- DSCR
- —
- Eligible?
- —
Personal DTI + credit; lowest rate.
DSCR
20% down · 8.5% · 30yr
- Down + closing
- —
- Monthly P&I
- —
- Monthly cashflow
- —
- DSCR
- —
- Eligible?
- —
No personal income docs; deal must DSCR.
Hard money
10% down · 12.0% · 12mo
- Down + closing
- —
- Monthly P&I
- —
- Monthly cashflow
- —
- DSCR
- —
- Eligible?
- —
Short-term bridge; refi at stabilization.
Rent comps 5 comps
| Address | Beds | Baths | Sqft | Rent | $/sqft | DOM | Units | Dist |
|---|---|---|---|---|---|---|---|---|
| 38 Shadow Ln Larchmont, NY | 4.0 | 3.5 | 2485 | $8,900 | $3.58 | 43d | 1 | 0.53mi |
| 52 Wendt Ave Larchmont, NY | 3.0 | 1.5 | 1656 | $8,950 | $5.40 | 1d | 1 | 1.07mi |
| 49 N Chatsworth Ave Larchmont, NY | 4.0 | 3.5 | 2402 | $9,950 | $4.14 | 2d | 1 | 1.11mi |
| 73 Maple Ave New Rochelle, NY | 4.0 | 3.0 | 2414 | $6,500 | $2.69 | 43d | 1 | 1.25mi |
| 79 Edgewood Ave Larchmont, NY | 4.0 | 3.0 | 1786 | $7,800 | $4.37 | 1d | 1 | 1.28mi |
Listing history 4 events
-
2026-05-06status Active 1003-char remark
Show marketing remark (1003 chars)
Tucked at the end of a quiet dead-end in sought-after Stephenson Park, this charming side-hall Colonial delivers space, updates, and a yard that begs for a barbecue invite list. The main level offers a formal living room with crown molding and a stone fireplace, a comfortable family room, an oversized eat-in kitchen. Fresh paint brightens most rooms, while brand-new hardwood floors on the first level and new carpeting upstairs make moving in easy. The kitchen has been refreshed with updated cabinetry, stainless steel appliances, and new stone countertops. Sliding glass doors open to a generous Trex deck overlooking an expansive backyard with loads of room to run, garden, or simply relax. Upstairs you’ll find four well-proportioned bedrooms and a hall bath featuring a Jacuzzi tub. All this, plus a location near Metro-North and major highways, makes daily commuting refreshingly simple. A smart layout, tasteful improvements, and a peaceful setting — this one checks so many boxes
-
2026-04-17historical $799,000 1003-char remark
Show marketing remark (1003 chars)
Tucked at the end of a quiet dead-end in sought-after Stephenson Park, this charming side-hall Colonial delivers space, updates, and a yard that begs for a barbecue invite list. The main level offers a formal living room with crown molding and a stone fireplace, a comfortable family room, an oversized eat-in kitchen. Fresh paint brightens most rooms, while brand-new hardwood floors on the first level and new carpeting upstairs make moving in easy. The kitchen has been refreshed with updated cabinetry, stainless steel appliances, and new stone countertops. Sliding glass doors open to a generous Trex deck overlooking an expansive backyard with loads of room to run, garden, or simply relax. Upstairs you’ll find four well-proportioned bedrooms and a hall bath featuring a Jacuzzi tub. All this, plus a location near Metro-North and major highways, makes daily commuting refreshingly simple. A smart layout, tasteful improvements, and a peaceful setting — this one checks so many boxes
-
1996-08-15soldstatus $180,000
-
1983-05-31soldstatus $6,500
ⓘ Source: listings_history table (triggers on properties + properties_extension) + one-shot
backfill from property_details.listing_events for pre-trigger history.
Tax reassessment forecast NY · Partial reset (capped growth)
- Current annual tax
- $10,181 · $848/mo
- Projected year-2 tax
- $11,842 · $987/mo
- Expected delta
- +$1,661/yr (+$138/mo · 16.3%)
ⓘ Screening estimate from a state-policy table — verify with the county assessor before closing.
Climate risk First Street
- Flood 1/10 Low FEMA zone X (unshaded) · 0% chance over 30 yrs
- Wildfire 1/10 Low
- Heat 6/10 Major 7 d/yr ≥98°F today · 16 d/yr by 30 yrs out
- Wind 6/10 Major 27% chance of damaging wind over 30 yrs
- Air quality 5/10 Major 6 unhealthy d/yr today · 8 by 30 yrs out
Nearby sold comps map
Loading sold comps map…
Walkable amenities ~0.75 mi
Loading nearby amenities…
Taxation est. · year 1
- Rental income
- $85,022
- − Mortgage interest
- −$44,756
- − Property taxes
- −$10,181
- − Insurance
- −$3,995
- − Repairs & maintenance
- −$6,802
- − Management
- −$6,802
- − Depreciation
- −$23,244
- Taxable loss
- −$10,758
- Est. tax savings @ 24.0%
- +$2,582
- After-tax cash flow
- $5,292/yr
For passive investors: Depreciation is non-cash, so a rental often shows a tax loss while cash-flowing — sheltering income. Rental losses are passive: they offset passive income freely, and up to $25,000/yr can offset ordinary (W-2) income if you actively participate and your MAGI is under $100k (phasing out to $0 by $150k); unused losses carry forward. On sale, claimed depreciation is recaptured at up to 25%, and gains may owe capital-gains tax (a 1031 exchange can defer both). Figures are a year-1 estimate at your 24.0% rate — not tax advice; consult a CPA.
Schools (NCES district)
- District
- New Rochelle City School District
- NCES district ID
- 3620490
- Math proficiency
- 63% ▲ 3.00%
- Reading proficiency
- 66% ▲ 9.00%
- Median HH income
- $69,165
- Composite
- 56.63/100
- National rank
- #1139
- State rank
- #171 of 590 in NY
Livability — New Rochelle
- Score
- 69/100
- State rank
- #487
- US rank
- #8572
Category grades
Schools grade is shown separately in the Schools card above.
Census & demographics
- Census place
- New Rochelle, NY
- County
- Westchester County · 709,332 people
- City population
- 63,657
- Metro
- New York-Newark-Jersey City, NY-NJ-PA
- Population (ZIP)
- 42,754
- Household income
- $85,573
- Rent vs Own
- Severe rent burden
- 2797.0
Population outlook (Westchester County) Hauer SSP2
- Today (2025)
- 1,028,035 people
- By 2030
- 1,051,636 · +2.3%
- By 2040
- 1,098,520 · +6.9%
- By 2050
- 1,136,044 · +10.5%
- By 2075
- 1,196,925 · +16.4%
- By 2100
- 1,175,147 · +14.3%
Race, ethnicity, and origin ACS 2023
- Neighborhood character
- Highly diverse neighborhood (Simpson 0.72)
- Race & ethnicity
- Hispanic / Latino 36% White 30% Black 24% Two or more races 16% Asian 7%
- Hispanic origin (detail)
- Mexican 17% Puerto Rican 5% Dominican 3%
- Common ancestry
- Hispanic 3% Scotch-Irish 1% Romanian 1%
- Foreign-born
- 34% · Canada, Jamaica, China
- Languages at home
- 54% English-only · Spanish 32% Other Indo-European 5% French/Haitian/Cajun 4%
Political lean MEDSL · Westchester
- 2024 margin
- Strong D (+26.3) · D 63.1% · R 36.9%
- 2008→2024 swing
- -1.3pp toward R · 2008: 27.6pp · 2024: 26.3pp
- All cycles
- 2024: D+26.3 2020: D+36.3 2016: D+32.8 2012: D+22.2 2008: D+27.6
Not yet ingested
- Civics
- —
Market trends
- HPI YoY
- ▼ -910.37%
- Current HPI
- 270.8019
- Rent YoY
- ▲ 1.42%
- Metro
- New York-Newark-Jersey City, NY-NJ-PA
- State GDP YoY
- ▲ 2.60%
- F500 in state
- 92
Industry mix (Fortune 500 HQ in NY)
| Industry | F500 HQs | Revenue |
|---|---|---|
| Financial Services | 10 | $950B |
|
||
| Consumer Goods | 9 | $162B |
|
||
| Insurance | 4 | $225B |
|
||
| Telecommunications | 2 | $144B |
|
||
| Pharmaceuticals | 2 | $112B |
|
||
| Media / Entertainment | 2 | $69B |
|
||
Price history
+12192.3% since first listed4 events — show timeline
- 2026-05-06 Relisted — OneKey® MLS as Distributed by MLS Grid
- 2026-04-17 Coming Soon $799,000 OneKey® MLS as Distributed by MLS Grid
- 1996-08-15 Sold (Public Records) $180,000 Public Records
- 1983-05-31 Sold (Public Records) $6,500 Public Records
Property tax history
+0.4%/yrLatest (2025): $10,181 · -19.8% YoY. Source: county tax records.
Cash-flow waterfall
monthlySold comps — $/sqft
last 12 mo · ≤1 miLoading sold comps…