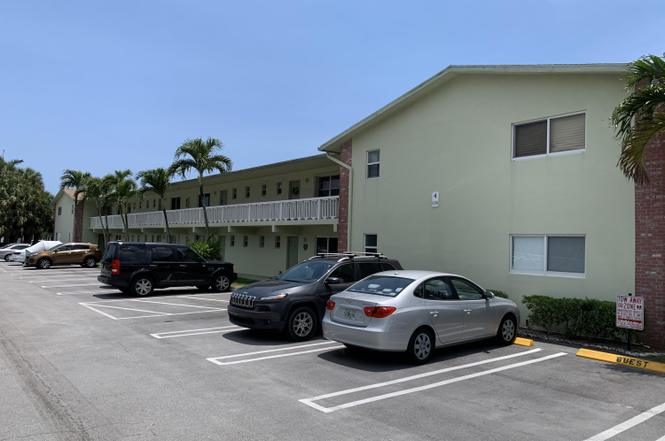
658 NE 6th Ct Unit L · Boynton Beach, FL
Flood risk 6/10 · Moderate
- FEMA flood zone
- X (shaded)
- Chance of flooding over 30 yrs
- 0.69%
- Est. flood insurance / yr
- $507 – $1,088
Fire risk 2/10 · Minimal
- Est. fire insurance / yr
- $947 – $1,759
Heat risk 10/10 · Severe
- Hot days now (above 104°F)
- 7 days/yr
- Hot days in 30 yrs
- 28 days/yr
Wind risk 10/10 · Severe
- Chance of severe wind over 30 yrs
- 99.0%
Air-quality risk 2/10 · Minimal
- Unhealthy air days now
- 1 days/yr
- Unhealthy air days in 30 yrs
- 2 days/yr
Risk factors via First Street. Map © Google.
Why this score? — see what drove the C- grade
The composite is a weighted blend of 9 inputs, each scored 0–100. Each bar is that input's sub-score; the figure is the points it added to the 100-point composite (weight × sub-score).
- Cash flow +15.5/30.0
- 1% rule +8.6/10.0
- ARV discount +7.5/15.0
- DSCR +4.8/10.0
- Schools +4.3/10.0
- Livability +3.6/5.0
- Rent growth +3.4/5.0
- Condition / age +2.5/5.0
- Appreciation +0.0/10.0
$225,000
🖨 Deal sheet 📄 Offer letter ✓ Due diligence
Listing remarks
Perfect location and opportunity to, Live the coastal life in this bright and airy 2-bedroom, 2-bathroom corner condo on the second floor, east of Federal. This spacious unit features central A/C, an open layout, plenty of natural light, and access to a sparkling community pool. Just minutes from the beach, local restaurants, and shops, it's perfect for soaking up the sun and enjoying vibrant coastal living. Small pets are allowed. Able to be lease right away great investment opportunity!
Key facts
- Community pool
- Natural light
- Central a/c
Tags
Property features AI
Finance
- Other: Pets allowed with restrictions (breed, number, and size limits; possible additional pet restrictions; cats only mentioned among restrictions)
- Financial info: Not a multifamily investment listing (no income/expense details provided)
- HOA & community: Condo association with a community pool; Monthly association fee of $685
Exterior
- Parking: Parking details not provided
- Security: No security features listed
- Utilities: Cable available
- Home design: Condominium; Resale property; Two-story building; North-facing
- Construction: Built with concrete / CBS construction
- Exterior features: Not on the waterfront; No waterfront features
Interior
- Kitchen: Refrigerator
- Bedrooms: One bedroom on the main level
- Flooring: Carpet flooring
- Bathrooms: Two full bathrooms (one on the main level)
- Heating & cooling: Central heating; Central air conditioning; Ceiling fan(s)
- Interior features: No notable interior features listed
- Laundry & utility: No laundry or utility appliances listed
Neighborhood map
What this means for you Summary
Snapshot
- This is a 2-bed/2.0-bath condo listed at $225k.
Deal economics
- At list price, monthly cash flow is $91 ($1k/yr) — positive.
- The deal already cash-flows at list — no discount required.
- Meets the 1% rule at list price ($3k rent vs $225k).
- Recommended offer: $198k (12.0% below list) — sets the bar for market timing.
- Cap rate 6.8% vs local median 4.3% in Boynton Beach — top-decile yield for the area; either an underpriced asset or a hidden risk that comps aren't pricing in. Stress-test before assuming the spread holds.
Location & tenants
- Location reads 72/100 on livability (#351 in FL) — a middle-class / working-renter tenant base. Strengths: housing A+, health & safety B+, cost of living B; Watch: amenities D+, crime D-, commute F.
- Palm Beach (suburban): math 46% / reading 53% proficiency, ranked #34 of 73 in FL (top 47%) — families likely to look elsewhere, expect single-tenant / working-renter base with shorter leases.
- Market conditions: Rents rising (+3.6%/yr); 536 active listings in the ZIP; 40 comparable units currently listed for rent nearby; rentals at typical pace (median 25d on market — plan ~3-4 weeks tenant-placement turnaround); 3,974 units permitted in Palm Beach County in 2024 (1,012 in 5+ unit buildings).
- At $3,054/mo this rent would consume 54% of the median local household income ($68k/yr) (locally 1623% of renters already pay >50% of income on rent) — very limited rent-growth headroom before tenants either downsize or default.
Forward outlook
- Local home prices are declining (-3.0%/yr); year-one equity from $2k of loan paydown is wiped out by about $7k of value loss. Plan a longer hold.
- Palm Beach County population projected at +30% by 2050 — long-run rental-demand tailwind backs the buy-and-hold thesis.
Negotiation context
- It's been on market 224 days — a 12% lower offer ($198k) is reasonable based on typical stale-listing flexibility.
- 5 sale attempts; this cycle's ask is 12062% above the opening price — seller raised mid-cycle; expect resistance to lowballs.
- Current owner paid $115k; list at $225k implies a 96% gain — meaningful room to come down on a strong offer.
Risks & watch-outs
- Watch-outs: HOA is 22% of rent.
- Climate carrying-cost: major flood risk; severe wind risk, 99% chance of damaging wind over 30y; extreme-heat days projected 7→28/yr by 2055 (HVAC capex compounding) — expect insurance premiums to compound above CPI over the hold.
Questions for the listing agent
- It's been on market 224 days. Have you received any prior offers? Is the seller open to a 12% concession, seller financing, or rate buy-down credit?
- Built in 1971 — when were the roof, HVAC, electrical panel, plumbing, and water heater last replaced?
- What does the HOA fee cover, when was the last increase, and are there any pending special assessments or reserve-fund shortfalls?
- Any open or pending special assessments — roof, HVAC, plumbing, elevator, façade? What's the per-unit balance and payoff schedule, and is the seller paying it off at close or rolling it to the buyer?
- Why hasn't it sold? Are there any deal-killer items the seller is aware of (foundation, flood, title, zoning, code violations)?
- Is there a deadline driving the sale (1031 exchange, divorce, estate, relocation)? That informs how much negotiation room exists.
- Crime grade is D in this area — have there been break-ins, vandalism, or insurance claims at this property in the last 3 years? What carrier currently insures it and at what premium?
- What's the average days-on-market for RENTAL listings here right now (not sales)? A rising rental-DOM trend means longer vacancies and softer asking-rent achievability than the comps imply.
- What's the recent tenant-quality profile in this submarket — average credit score on applications, eviction rate, late-payment / NSF rate, and stable-employment percentage? A property-management company in the area should have these aggregated.
- How much new apartment / multifamily construction is in the pipeline within 1–3 miles? Heavy new supply (>2% of stock underway) typically softens rents 12–24 months out; light construction supports rent growth.
Investment metrics
- 1% rule
- 1.36% ✓
- Cap rate
- 6.78%
- Cash-on-cash
- 1.73%
- DSCR
- 1.08
- GRM
- 6.1
CMA / ARV
No comps found within radius.
Projected returns pro-forma
-3.0% appreciation · 3.64% rent growth · sell at horizon
- IRR
- -12.2%
- Equity multiple
- 0.55×
- Total profit
- $-28,182
- Equity at exit
- $33,548
- IRR
- -1.5%
- Equity multiple
- 0.89×
- Total profit
- $-6,768
- Equity at exit
- $19,454
Cash invested: $63,000 (down + closing). Projections, not guarantees.
Landlord ↔ Tenant lean methodology
- Overall (STATE)
- 87 Strongly Landlord-Friendly
- State Florida
- 87 Strongly Landlord-Friendly · R+3
- County
- — inherits STATE
- City
- — inherits STATE
ZIP-level market 33435
- Rents YoY
- 3.6%
- Active inventory
- 536
- Price-to-rent
- 6.1×
Monthly cashflow live
- Estimated rent
- $3,054 high interval (Pro) →
- Mortgage (P&I)
- −$1,180
- Tax from tax record
- −$363 /mo · $4,357/yr
- Insurance
- −$94
- HOA
- −$685
- Vacancy / Maint / Mgmt
- −$641
- Net cashflow
- $91
Break-even live
UW: 25.0% down · 7.5% · 30yr · 1.5% tax · 5.0% vac · 8.0% maint · 8.0% mgmt
Financing live
Cash to close
- Down payment
- $56,250
- Closing costs
- $6,750
- Reserves months
- —
- Total cash needed
- —
Loan-product check · same deal, 3 products live
Conventional
25% down · 7.5% · 30yr
- Down + closing
- —
- Monthly P&I
- —
- Monthly cashflow
- —
- DSCR
- —
- Eligible?
- —
Personal DTI + credit; lowest rate.
DSCR
20% down · 8.5% · 30yr
- Down + closing
- —
- Monthly P&I
- —
- Monthly cashflow
- —
- DSCR
- —
- Eligible?
- —
No personal income docs; deal must DSCR.
Hard money
10% down · 12.0% · 12mo
- Down + closing
- —
- Monthly P&I
- —
- Monthly cashflow
- —
- DSCR
- —
- Eligible?
- —
Short-term bridge; refi at stabilization.
Rent comps 40 comps
| Address | Beds | Baths | Sqft | Rent | $/sqft | DOM | Units | Dist |
|---|---|---|---|---|---|---|---|---|
| 689 NE 6th Ct #404 Boynton Beach, FL | 1.0 | 1.0 | 703 | $2,000 | $2.84 | 24d | 1 | 0.09mi |
| 689 NE 6th Ct #4070 Boynton Beach, FL | 1.0 | 1.0 | 703 | $1,900 | $2.70 | 17d | 1 | 0.09mi |
| 710 NE 7th St #1050 Boynton Beach, FL | 2.0 | 2.0 | 1029 | $3,350 | $3.26 | 24d | 1 | 0.15mi |
| 717 NE 10th Ave Unit 6 Boynton Beach, FL | 1.0 | 1.0 | 700 | $1,600 | $2.29 | 8d | 1 | 0.23mi |
| 450 N Federal Hwy Boynton Beach, FL | 2.0 | 2.0–2.5 | 1439 | $3,450 | $2.40 | 17d | 2 | 0.24mi |
| 350 N Federal Hwy Boynton Beach, FL | 2.0 | 2.0 | 1289 | $3,550 | $2.75 | 11d | 3 | 0.24mi |
| 350 N Federal Hwy #9 Boynton Beach, FL | 2.0 | 2.0 | 1350 | $4,500 | $3.33 | 24d | 1 | 0.24mi |
| 700 E Boynton Beach Blvd #203 Boynton Beach, FL | 2.0 | 2.0 | 1130 | $2,650 | $2.35 | 24d | 1 | 0.29mi |
| 700 E Boynton Beach Blvd #1203 Boynton Beach, FL | 2.0 | 2.0 | 1130 | $4,000 | $3.54 | 24d | 1 | 0.29mi |
| 700 E Boynton Beach Blvd #511 Boynton Beach, FL | 2.0 | 2.0 | 1153 | $5,000 | $4.34 | 24d | 1 | 0.29mi |
| 700 E Boynton Beach Blvd #1507 Boynton Beach, FL | 1.0 | 1.0 | 782 | $3,800 | $4.86 | 24d | 1 | 0.29mi |
| 700 E Boynton Beach Blvd #405 Boynton Beach, FL | 2.0 | 2.0 | 1200 | $3,495 | $2.91 | 19d | 1 | 0.29mi |
| 700 E Boynton Beach Blvd #803 Boynton Beach, FL | 2.0 | 2.0 | 1130 | $3,500 | $3.10 | 24d | 1 | 0.29mi |
| 700 E Boynton Beach Blvd #1007 Boynton Beach, FL | 1.0 | 1.0 | 782 | $3,950 | $5.05 | 24d | 1 | 0.29mi |
| 700 E Boynton Beach Blvd #510 Boynton Beach, FL | 2.0 | 2.0 | 1153 | $3,000 | $2.60 | 24d | 1 | 0.29mi |
| 700 E Boynton Beach Blvd #1509 Boynton Beach, FL | 2.0 | 2.0 | 1129 | $4,200 | $3.72 | 24d | 1 | 0.29mi |
| 700 E Boynton Beach Blvd #1408 Boynton Beach, FL | 3.0 | 2.0 | 1385 | $3,500 | $2.53 | 24d | 1 | 0.29mi |
| 700 E Boynton Beach Blvd #105 Boynton Beach, FL | 1.0 | 1.0 | 762 | $2,100 | $2.76 | 24d | 1 | 0.29mi |
| 625 Casa Loma Blvd #304 Boynton Beach, FL | 2.0 | 2.0 | 1130 | $4,500 | $3.98 | 19d | 1 | 0.34mi |
| 625 Casa Loma Blvd #705 Boynton Beach, FL | 2.0 | 2.0 | 1206 | $2,750 | $2.28 | 22d | 1 | 0.34mi |
| 625 Casa Loma Blvd #304 Boynton Beach, FL | 2.0 | 2.0 | 1130 | $4,500 | $3.98 | 5d | 1 | 0.34mi |
| 625 Casa Loma Blvd #1504 Boynton Beach, FL | 2.0 | 2.0 | 1130 | $3,500 | $3.10 | 24d | 1 | 0.34mi |
| 625 Casa Loma Blvd #207 Boynton Beach, FL | 1.0 | 1.0 | 782 | $2,200 | $2.81 | 2d | 1 | 0.34mi |
| 625 Casa Loma Blvd #1507 Boynton Beach, FL | 1.0 | 1.0 | 782 | $2,400 | $3.07 | 24d | 1 | 0.34mi |
| 625 Casa Loma Blvd #1206 Boynton Beach, FL | 2.0 | 2.0 | 1206 | $3,650 | $3.03 | 24d | 1 | 0.34mi |
| 100 NE 6th St Boynton Beach, FL | 1.0 | 1.0 | 745 | $2,975 | $3.99 | 12d | 3 | 0.38mi |
| 100 NE 6th St Boynton Beach, FL | 1.0 | 1.0 | 745 | $2,975 | $3.99 | 20d | 3 | 0.38mi |
| 336 NE 12th Ave Boynton Beach, FL | 3.0 | 2.0 | 1040 | $2,500 | $2.40 | 8d | 1 | 0.39mi |
| 740 E Ocean Ave #407 Boynton Beach, FL | 2.0 | 2.0 | 908 | $2,800 | $3.08 | 24d | 1 | 0.46mi |
| 6520 N Ocean Blvd Apt 3 Ocean Ridge, FL | 1.0 | 1.0 | 702 | $3,500 | $4.99 | 24d | 1 | 0.50mi |
| 6520 N Ocean Blvd Ocean Ridge, FL | 1.0–2.0 | 1.0 | 776 | $3,500 | $4.51 | 12d | 1 | 0.50mi |
| 101 S Federal Hwy Boynton Beach, FL | 1.0–2.0 | 1.0–2.0 | 969 | $2,794 | $2.88 | 2d | 17 | 0.50mi |
| 6530 N Ocean Blvd #206 Ocean Ridge, FL | 2.0 | 2.0 | 975 | $3,200 | $3.28 | 24d | 1 | 0.54mi |
| 222 SE 3rd St Boynton Beach, FL | 3.0 | 2.0 | 1466 | $3,600 | $2.46 | 24d | 1 | 0.58mi |
| 806 NW 1st St Boynton Beach, FL | 3.0 | 2.0 | 1169 | $3,500 | $2.99 | 4d | 1 | 0.59mi |
| 806 NW 1st St Boynton Beach, FL | 3.0 | 2.0 | 1169 | $3,500 | $2.99 | 20d | 1 | 0.59mi |
| 217 SE 2nd Ave Boynton Beach, FL | 2.0 | 2.0 | 832 | $2,900 | $3.49 | 24d | 1 | 0.61mi |
| 115 SW 1st Ave Boynton Beach, FL | 1.0–2.0 | 1.0–2.0 | 804 | $2,250 | $2.80 | 15d | 2 | 0.70mi |
| 1632 N Federal Hwy Boynton Beach, FL | 1.0–3.0 | 1.0–2.0 | 1098 | $2,580 | $2.35 | 2d | 20 | 0.71mi |
| 306 Circle Dr S #104 Boynton Beach, FL | 2.0 | 2.0 | 1150 | $2,100 | $1.83 | 5d | 1 | 0.81mi |
HOA detail condo
- Monthly dues
- $685 · $8,220/yr
- Likely covers
- pool
- Assessments
- None detected in remarks — confirm with the listing agent.
Listing history 24 events
-
2026-06-18days on market $225,000 Active 224 DOM
-
2026-06-17days on market $225,000 Active 223 DOM
-
2026-06-16days on market $225,000 Active 222 DOM
-
2026-06-15days on market $225,000 Active 221 DOM
-
2026-06-13days on market $225,000 Active 219 DOM
-
2026-06-09days on market $225,000 Active 215 DOM
-
2026-06-07days on market $225,000 Active 213 DOM
-
2026-06-04days on market $225,000 Active 210 DOM
-
2026-06-03days on market $225,000 Active 209 DOM
-
2026-06-01days on market $225,000 Active 207 DOM
-
2026-05-31days on market $225,000 Active 206 DOM
-
2026-02-01historical $2,000
-
2026-01-26price $2,000
-
2026-01-25$1,850
-
2026-01-23status Active
-
2025-12-05historical
-
2025-11-12historical $1,850
-
2025-10-09price $1,850
-
2025-09-19$2,000
-
2025-09-18historical $2,000
-
2025-09-18$2,000
-
2025-09-18$225,000 Active
-
2016-05-23soldstatus $115,000
-
1989-03-17soldstatus $65,000
ⓘ Source: listings_history table (triggers on properties + properties_extension) + one-shot
backfill from property_details.listing_events for pre-trigger history.
Tax reassessment forecast FL · Resets to sale price
- Current annual tax
- $4,357 · $363/mo
- Projected year-2 tax
- $4,357 · $363/mo
- Expected delta
- $0/yr ($0/mo · 0.0%)
ⓘ Screening estimate from a state-policy table — verify with the county assessor before closing.
Climate risk First Street
- Flood 6/10 Major FEMA zone X (shaded) · 69% chance over 30 yrs
- Wildfire 2/10 Low
- Heat 10/10 Extreme 7 d/yr ≥104°F today · 28 d/yr by 30 yrs out
- Wind 10/10 Extreme 99% chance of damaging wind over 30 yrs
- Air quality 2/10 Low 1 unhealthy d/yr today · 2 by 30 yrs out
Nearby sold comps map
Loading sold comps map…
Walkable amenities ~0.75 mi
Loading nearby amenities…
Taxation est. · year 1
- Rental income
- $36,646
- − Mortgage interest
- −$12,603
- − Property taxes
- −$4,357
- − Insurance
- −$1,125
- − Repairs & maintenance
- −$2,932
- − Management
- −$2,932
- − HOA
- −$8,220
- − Depreciation
- −$6,545
- Taxable loss
- −$2,068
- Est. tax savings @ 24.0%
- +$496
- After-tax cash flow
- $1,586/yr
For passive investors: Depreciation is non-cash, so a rental often shows a tax loss while cash-flowing — sheltering income. Rental losses are passive: they offset passive income freely, and up to $25,000/yr can offset ordinary (W-2) income if you actively participate and your MAGI is under $100k (phasing out to $0 by $150k); unused losses carry forward. On sale, claimed depreciation is recaptured at up to 25%, and gains may owe capital-gains tax (a 1031 exchange can defer both). Figures are a year-1 estimate at your 24.0% rate — not tax advice; consult a CPA.
Schools (NCES district)
- District
- Palm Beach
- NCES district ID
- 1201500
- Math proficiency
- 46% ▼ -16.00%
- Reading proficiency
- 53% ▼ -4.00%
- Median HH income
- $53,943
- Composite
- 42.72/100
- National rank
- #3160
- State rank
- #34 of 73 in FL
Livability — Boynton Beach
- Score
- 72/100
- State rank
- #351
- US rank
- #6098
Category grades
Schools grade is shown separately in the Schools card above.
Census & demographics
- Census place
- Boynton Beach, FL
- County
- Palm Beach County · 1,438,312 people
- City population
- 148,060
- Metro
- Miami-Fort Lauderdale-Pompano Beach, FL
- Population (ZIP)
- 37,833
- Household income
- $67,979
- Rent vs Own
- Severe rent burden
- 1623.0
Population outlook (Palm Beach County) Hauer SSP2
- Today (2025)
- 1,637,487 people
- By 2030
- 1,743,255 · +6.5%
- By 2040
- 1,948,712 · +19.0%
- By 2050
- 2,132,979 · +30.3%
- By 2075
- 2,530,027 · +54.5%
- By 2100
- 2,706,979 · +65.3%
Race, ethnicity, and origin ACS 2023
- Neighborhood character
- Diverse neighborhood (Simpson 0.65)
- Race & ethnicity
- White 41% Black 40% Hispanic / Latino 15% Two or more races 10%
- Hispanic origin (detail)
- Mexican 3% Puerto Rican 3% Cuban 2% Dominican 1%
- Common ancestry
- Hispanic 23% Romanian 2% Lithuanian 2%
- Foreign-born
- 30% · Canada, Jamaica
- Languages at home
- 61% English-only · French/Haitian/Cajun 24% Spanish 11% Other Indo-European 2%
Political lean MEDSL · Palm Beach
- 2024 margin
- Toss-up / Even · D 50.0% · R 49.2%
- 2008→2024 swing
- -22.1pp toward R · 2008: 22.9pp · 2024: 0.8pp
- All cycles
- 2024: D+0.8 2020: D+12.8 2016: D+15.3 2012: D+17.0 2008: D+22.9
Not yet ingested
- Civics
- —
Market trends
- HPI YoY
- ▼ -345.86%
- Current HPI
- 371.0527
- Rent YoY
- ▲ 3.64%
- Metro
- Miami-Fort Lauderdale-Pompano Beach, FL
- State GDP YoY
- ▲ 3.28%
- F500 in state
- 36
Industry mix (Fortune 500 HQ in FL)
| Industry | F500 HQs | Revenue |
|---|---|---|
| Industrial Technology | 2 | $29B |
|
||
| Insurance | 2 | $17B |
|
||
| Retail | 1 | $60B |
|
||
| Technology Distribution | 1 | $58B |
|
||
| Homebuilding | 1 | $35B |
|
||
| Technology Manufacturing | 1 | $35B |
|
||
Price history
-96.9% since first listed13 events — show timeline
- 2026-02-01 Rental Removed $2,000 RMLSFL
- 2026-01-26 Price Changed $2,000 RMLSFL
- 2026-01-25 Listed for Rent $1,850 RMLSFL
- 2026-01-23 Relisted — Beaches MLS
- 2025-12-05 Listing Removed — Beaches MLS
- 2025-11-12 Rental Removed $1,850 RMLSFL
- 2025-10-09 Price Changed $1,850 RMLSFL
- 2025-09-19 Listed for Rent $2,000 RMLSFL
- 2025-09-18 Rental Removed $2,000 GFLMLS
- 2025-09-18 Listed for Rent $2,000 GFLMLS
- 2025-09-18 Listed $225,000 Beaches MLS
- 2016-05-23 Sold (Public Records) $115,000 Public Records
- 1989-03-17 Sold (Public Records) $65,000 Public Records
Property tax history
+14.7%/yrLatest (2025): $4,357 · +7.4% YoY. Source: county tax records.
Cash-flow waterfall
monthlySold comps — $/sqft
last 12 mo · ≤1 miLoading sold comps…