 🏷️ Likely Rental
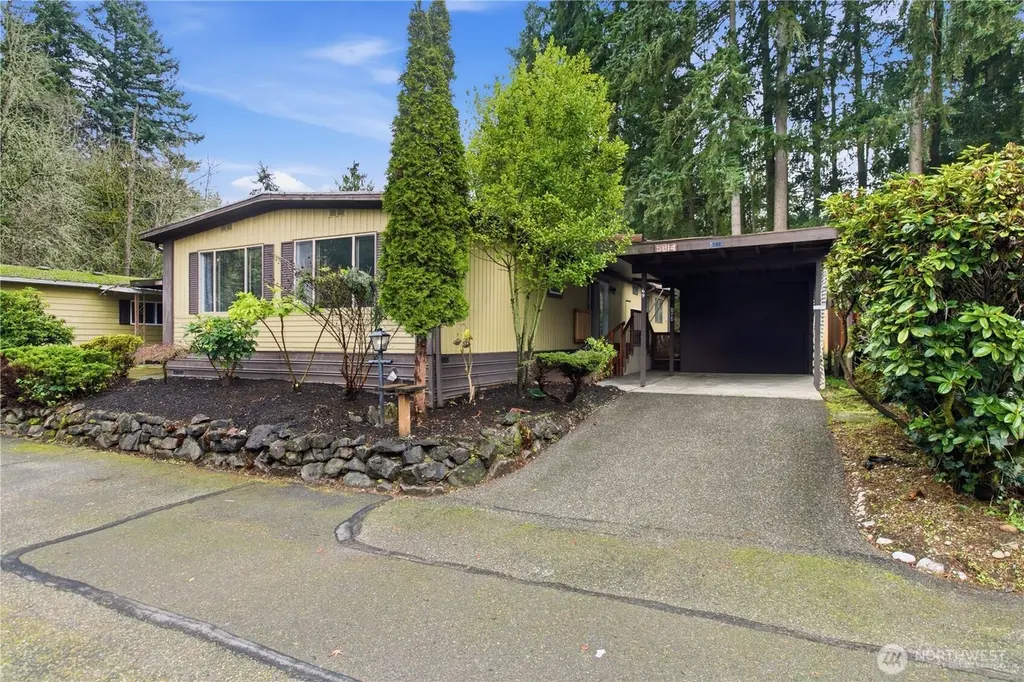
5814 79th Street Ct E #69 · Waller, WA
Flood risk 1/10 · Minimal
- FEMA flood zone
- X (unshaded)
- Chance of flooding over 30 yrs
- 0.0%
- Est. flood insurance / yr
- $507 – $1,088
Fire risk 1/10 · Minimal
- Est. fire insurance / yr
- $604 – $1,122
Heat risk 3/10 · Minor
- Hot days now (above 87°F)
- 7 days/yr
- Hot days in 30 yrs
- 15 days/yr
Wind risk 1/10 · Minimal
- Chance of severe wind over 30 yrs
- —
Air-quality risk 7/10 · Major
- Unhealthy air days now
- 11 days/yr
- Unhealthy air days in 30 yrs
- 12 days/yr
Risk factors via First Street. Map © Google.
Why this score? — see what drove the B+ grade
The composite is a weighted blend of 9 inputs, each scored 0–100. Each bar is that input's sub-score; the figure is the points it added to the 100-point composite (weight × sub-score).
- Cash flow +30.0/30.0
- ARV discount +15.0/15.0
- 1% rule +10.0/10.0
- DSCR +10.0/10.0
- Schools +5.4/10.0
- Livability +3.5/5.0
- Rent growth +2.9/5.0
- Condition / age +2.5/5.0
- Appreciation +0.0/10.0
$79,999
🖨 Deal sheet 📄 Offer letter ✓ Due diligence
Listing remarks
Welcome home to this inviting 3-bedroom, 1.75-bath home offering 1,528 sq. ft. of comfortable living space. Enjoy brand-new vinyl plank flooring throughout the main living areas and new carpet in all three bedrooms. The updated tile walk-in shower adds a modern touch, while the cozy pellet stove creates the perfect atmosphere for relaxing evenings. A newer roof provides added peace of mind. Located in the desirable Crestview West 55+ community, this home features low monthly rent that includes water and sewer. Conveniently close to medical facilities, shopping, and the Washington State Fair.
Key facts
- Tile walk-in shower
- Newer roof
- Pellet stove
Tags
Neighborhood map
What this means for you Summary
Snapshot
- This is a 3-bed/2.0-bath manufactured listed at $80k.
Deal economics
- At list price, monthly cash flow is $1k ($17k/yr) — positive.
- The deal already cash-flows at list — no discount required.
- Meets the 1% rule at list price ($3k rent vs $80k).
- Recommended offer: $70k (12.0% below list) — sets the bar for market timing.
- Cap rate 28.2% vs local median 2.1% in Waller — top-decile yield for the area; either an underpriced asset or a hidden risk that comps aren't pricing in. Stress-test before assuming the spread holds.
Location & tenants
- Location reads 69/100 on livability (#254 in WA) — a middle-class / working-renter tenant base. Strengths: employment A+, housing A+, crime B; Watch: health & safety C-, commute D+, schools D-.
- Puyallup School District (suburban): math 53% / reading 66% proficiency, ranked #52 of 291 in WA (top 18%) — acceptable for families but not a draw, mixed tenant base, ~2y average lease.
- Market conditions: Rents rising (+1.4%/yr); 227 active listings in the ZIP; solid renter incomes; 3,209 units permitted in Pierce County in 2024 (1,269 in 5+ unit buildings).
- This rent runs 31% of the median local income ($97k/yr) — at the standard rent-burdened threshold; future hikes will face affordability resistance.
Forward outlook
- Local home prices are declining (-3.0%/yr); year-one equity from $553 of loan paydown is wiped out by about $2k of value loss. Plan a longer hold.
- Pierce County population projected at +26% by 2050 — long-run rental-demand tailwind backs the buy-and-hold thesis.
- At projected returns (-3.0% appreciation + 1.4% rent growth), your $22k cash investment doubles in ~2 years — after that, you're playing with house money.
Negotiation context
- It's been on market 172 days — a 12% lower offer ($70k) is reasonable based on typical stale-listing flexibility.
- 4 sale attempts since 13y ago; this cycle's ask has dropped $35k (30%) from the opening price — seller is motivated, your offer sets the floor, not the list.
- Current owner paid $65k; 23% above their basis — modest negotiation headroom, anchor on the comps not their cost.
Questions for the listing agent
- It's been on market 172 days. Have you received any prior offers? Is the seller open to a 12% concession, seller financing, or rate buy-down credit?
- Built in 1975 — when were the roof, HVAC, electrical panel, plumbing, and water heater last replaced?
- Why hasn't it sold? Are there any deal-killer items the seller is aware of (foundation, flood, title, zoning, code violations)?
- Is there a deadline driving the sale (1031 exchange, divorce, estate, relocation)? That informs how much negotiation room exists.
- Schools are D-rated, which usually means shorter tenancies and higher turnover. Who's the typical renter profile here, and what's been the actual vacancy rate?
- What's the average days-on-market for RENTAL listings here right now (not sales)? A rising rental-DOM trend means longer vacancies and softer asking-rent achievability than the comps imply.
- What's the recent tenant-quality profile in this submarket — average credit score on applications, eviction rate, late-payment / NSF rate, and stable-employment percentage? A property-management company in the area should have these aggregated.
- How much new for-sale + rental construction is in the pipeline within 1–3 miles? Heavy new supply typically softens prices + rents 12–24 months out; constrained supply supports both.
Investment metrics
- 1% rule
- 3.15% ✓
- Cap rate
- 28.15%
- Cash-on-cash
- 78.06%
- DSCR
- 4.47
- GRM
- 2.6
CMA / ARV
- ARV (median comp)
- $121,984
- List price
- $79,999
- Delta
- -13.96%
- Verdict
- UNDERPRICED
- Comps
- 20 within 1.0 mi
Show comp detail 12 sales within ~0.75 mi
| Address | Dist | Beds/Ba | Sqft | Sold | Price | $/sf | Match |
|---|---|---|---|---|---|---|---|
| 6106 78th Street Ct E #2 | 0.20mi | 3/2.0 | 1,568 (+3%) | 6mo | $120,000 | $77 | 81 |
| 5808 78th Street Ct E #89 | 0.09mi | 3/2.0 | 1,436 (-6%) | 8mo | $102,000 | $71 | 79 |
| 6022 89th Street Ct E #20 | 0.64mi | 3/2.0 | 1,528 (0%) | 2mo | $257,500 | $169 | 69 |
| 5801 89th Street Ct E #5 | 0.60mi | 3/2.0 | 1,496 (-2%) | 10mo | $151,000 | $101 | 60 |
| 5902 89th Street Ct E #11 | 0.63mi | 2/2.0 (-1) | 1,596 (+4%) | 1mo | $289,000 | $181 | 57 |
| 6011 89th St E #59 | 0.57mi | 2/2.0 (-1) | 1,692 (+11%) | 4mo | $280,000 | $165 | 48 |
| 6021 90th Street Ct E #109 | 0.67mi | 3/2.0 | 1,648 (+8%) | 11mo | $325,000 | $197 | 47 |
| 5115 88th Street Ct E #29 | 0.69mi | 2/2.0 (-1) | 1,436 (-6%) | 9mo | $129,950 | $90 | 45 |
| 6124 91ST St E #148 | 0.74mi | 3/2.0 | 1,716 (+12%) | 6mo | $310,000 | $181 | 40 |
| 5916 89th Street Ct E #14 | 0.63mi | 2/2.0 (-1) | 1,712 (+12%) | 10mo | $350,100 | $204 | 37 |
| 6010 89th Street Ct E #17 | 0.63mi | 2/2.0 (-1) | 1,711 (+12%) | 14mo | $360,000 | $210 | 34 |
| 5123 88th Street Ct E | 0.68mi | 3/2.0 | 1,336 (-13%) | 17mo | $114,800 | $86 | 33 |
Match score weights: distance 35% · size 25% · config 20% · recency 20%. Top-matched comps best support the ARV.
Projected returns pro-forma
-3.0% appreciation · 1.41% rent growth · sell at horizon
- IRR
- 76.3%
- Equity multiple
- 4.39×
- Total profit
- $75,904
- Equity at exit
- $11,928
- IRR
- 79.6%
- Equity multiple
- 8.59×
- Total profit
- $169,946
- Equity at exit
- $6,917
Cash invested: $22,400 (down + closing). Projections, not guarantees.
Landlord ↔ Tenant lean methodology
- Overall (STATE)
- 28 Tenant-Leaning
- State Washington
- 28 Tenant-Leaning · D+8
- County
- — inherits STATE
- City
- — inherits STATE
ZIP-level market 98371
- Rents YoY
- 1.4%
- Active inventory
- 227
- Price-to-rent
- 2.6×
Monthly cashflow live
- Estimated rent
- $2,517 medium interval (Pro) →
- Mortgage (P&I)
- −$420
- Tax from tax record
- −$78 /mo · $939/yr
- Insurance
- −$33
- HOA
- −$0
- Vacancy / Maint / Mgmt
- −$529
- Net cashflow
- $1,457
Break-even live
UW: 25.0% down · 7.5% · 30yr · 1.5% tax · 5.0% vac · 8.0% maint · 8.0% mgmt
Financing live
Cash to close
- Down payment
- $20,000
- Closing costs
- $2,400
- Reserves months
- —
- Total cash needed
- —
Loan-product check · same deal, 3 products live
Conventional
25% down · 7.5% · 30yr
- Down + closing
- —
- Monthly P&I
- —
- Monthly cashflow
- —
- DSCR
- —
- Eligible?
- —
Personal DTI + credit; lowest rate.
DSCR
20% down · 8.5% · 30yr
- Down + closing
- —
- Monthly P&I
- —
- Monthly cashflow
- —
- DSCR
- —
- Eligible?
- —
No personal income docs; deal must DSCR.
Hard money
10% down · 12.0% · 12mo
- Down + closing
- —
- Monthly P&I
- —
- Monthly cashflow
- —
- DSCR
- —
- Eligible?
- —
Short-term bridge; refi at stabilization.
Listing history 29 events
-
2026-06-18days on market $79,999 Active 172 DOM
-
2026-06-17price $79,999 Active 171 DOM
-
2026-06-17days on market $104,955 Active 171 DOM
-
2026-06-16days on market $104,955 Active 170 DOM
-
2026-06-15days on market $104,955 Active 169 DOM
-
2026-06-13days on market $104,955 Active 167 DOM
-
2026-06-13days on market $104,955 Active 166 DOM
-
2026-06-09days on market $104,955 Active 163 DOM
-
2026-06-08days on market $104,955 Active 162 DOM
-
2026-06-07days on market $104,955 Active 161 DOM
-
2026-06-04days on market $104,955 Active 158 DOM
-
2026-06-03days on market $104,955 Active 157 DOM
-
2026-06-02days on market $104,955 Active 156 DOM
-
2026-06-01days on market $104,955 Active 155 DOM
-
2026-05-31days on market $104,955 Active 154 DOM
-
2026-04-07price $104,955
-
2026-02-20price $109,955
-
2025-12-28$114,955 Active
-
2023-03-01soldstatus $65,000 Closed
-
2023-02-04status Pending
-
2023-01-21price $65,000
-
2023-01-14status Active
-
2023-01-02status Pending
-
2022-12-15$70,000 Active
-
2013-05-22status Pending Inspection
-
2013-05-21status Pending
-
2013-05-17soldstatus $15,000 Sold
-
2013-04-12price $16,500
-
2013-03-16$18,950 Active
ⓘ Source: listings_history table (triggers on properties + properties_extension) + one-shot
backfill from property_details.listing_events for pre-trigger history.
Tax reassessment forecast WA · Resets to sale price
- Current annual tax
- $939 · $78/mo
- Projected year-2 tax
- $939 · $78/mo
- Expected delta
- $0/yr ($0/mo · -0.0%)
ⓘ Screening estimate from a state-policy table — verify with the county assessor before closing.
Climate risk First Street
- Flood 1/10 Low FEMA zone X (unshaded) · 0% chance over 30 yrs
- Wildfire 1/10 Low
- Heat 3/10 Moderate 7 d/yr ≥87°F today · 15 d/yr by 30 yrs out
- Wind 1/10 Low
- Air quality 7/10 Severe 11 unhealthy d/yr today · 12 by 30 yrs out
Nearby sold comps map
Loading sold comps map…
Walkable amenities ~0.75 mi
Loading nearby amenities…
Taxation est. · year 1
- Rental income
- $30,202
- − Mortgage interest
- −$4,481
- − Property taxes
- −$939
- − Insurance
- −$400
- − Repairs & maintenance
- −$2,416
- − Management
- −$2,416
- − Depreciation
- −$2,327
- Taxable income
- $17,222
- Est. tax owed @ 24.0%
- −$4,133
- After-tax cash flow
- $13,353/yr
For passive investors: Depreciation is non-cash, so a rental often shows a tax loss while cash-flowing — sheltering income. Rental losses are passive: they offset passive income freely, and up to $25,000/yr can offset ordinary (W-2) income if you actively participate and your MAGI is under $100k (phasing out to $0 by $150k); unused losses carry forward. On sale, claimed depreciation is recaptured at up to 25%, and gains may owe capital-gains tax (a 1031 exchange can defer both). Figures are a year-1 estimate at your 24.0% rate — not tax advice; consult a CPA.
Schools (NCES district)
- District
- Puyallup School District
- NCES district ID
- 5306960
- Math proficiency
- 53% ▬ 0.00%
- Reading proficiency
- 66% ▬ 0.00%
- Median HH income
- $68,291
- Composite
- 54.01/100
- National rank
- #3006
- State rank
- #52 of 291 in WA
Livability — Waller
- Score
- 69/100
- State rank
- #254
- US rank
- #8174
Category grades
Schools grade is shown separately in the Schools card above.
Census & demographics
- Census place
- Waller, WA
- County
- Pierce County · 788,257 people
- City population
- 5,787
- Metro
- Seattle-Tacoma-Bellevue, WA
- Population (ZIP)
- 24,682
- Household income
- $97,242
- Rent vs Own
- Severe rent burden
- 507.0
Population outlook (Pierce County) Hauer SSP2
- Today (2025)
- 956,648 people
- By 2030
- 1,010,862 · +5.7%
- By 2040
- 1,113,170 · +16.4%
- By 2050
- 1,206,524 · +26.1%
- By 2075
- 1,436,425 · +50.2%
- By 2100
- 1,563,654 · +63.5%
Race, ethnicity, and origin ACS 2023
- Neighborhood character
- Predominantly White (70%)
- Race & ethnicity
- White 70% Two or more races 12% Hispanic / Latino 11% Asian 6% Black 4%
- Hispanic origin (detail)
- Mexican 9%
- Common ancestry
- Portuguese 5% Slovak 3% Italian 2%
- Foreign-born
- 10% · Canada, South Korea, Vietnam
- Languages at home
- 85% English-only · Spanish 5% Korean 2% Vietnamese 2%
Political lean MEDSL · Pierce
- 2024 margin
- D (+10.8) · D 53.9% · R 43.1% · Other 3.0%
- 2008→2024 swing
- -1.4pp toward R · 2008: 12.2pp · 2024: 10.8pp
- All cycles
- 2024: D+10.8 2020: D+11.2 2016: D+7.5 2012: D+11.0 2008: D+12.2
Not yet ingested
- Civics
- —
Market trends
- HPI YoY
- ▼ -580.45%
- Current HPI
- 295.2143
- Rent YoY
- ▲ 1.41%
- Metro
- Seattle-Tacoma-Bellevue, WA
- State GDP YoY
- ▲ 4.65%
- F500 in state
- 22
Industry mix (Fortune 500 HQ in WA)
| Industry | F500 HQs | Revenue |
|---|---|---|
| Retail | 2 | $269B |
|
||
| Technology / Retail | 1 | $638B |
|
||
| Technology | 1 | $245B |
|
||
| Telecommunications | 1 | $38B |
|
||
| Food / Beverage | 1 | $36B |
|
||
| Automotive / Trucks | 1 | $34B |
|
||
Price history
+453.9% since first listed14 events — show timeline
- 2026-04-07 Price Changed $104,955 NWMLS as Distributed by MLS Grid
- 2026-02-20 Price Changed $109,955 NWMLS as Distributed by MLS Grid
- 2025-12-28 Listed $114,955 NWMLS as Distributed by MLS Grid
- 2023-03-01 Sold (MLS) $65,000 NWMLS as Distributed by MLS Grid
- 2023-02-04 Pending — NWMLS as Distributed by MLS Grid
- 2023-01-21 Price Changed $65,000 NWMLS as Distributed by MLS Grid
- 2023-01-14 Relisted — NWMLS as Distributed by MLS Grid
- 2023-01-02 Pending — NWMLS as Distributed by MLS Grid
- 2022-12-15 Listed $70,000 NWMLS as Distributed by MLS Grid
- 2013-05-22 Pending — NWMLS as Distributed by MLS Grid
- 2013-05-21 Pending — NWMLS as Distributed by MLS Grid
- 2013-05-17 Sold (MLS) $15,000 NWMLS as Distributed by MLS Grid
- 2013-04-12 Price Changed $16,500 NWMLS as Distributed by MLS Grid
- 2013-03-16 Listed $18,950 NWMLS as Distributed by MLS Grid
Property tax history
+8.5%/yrLatest (2026): $939 · +21.0% YoY. Source: county tax records.
Cash-flow waterfall
monthlySold comps — $/sqft
last 12 mo · ≤1 miLoading sold comps…