2500 Poplar St · Opelika, AL
Flood risk 1/10 · Minimal
- FEMA flood zone
- X (unshaded)
- Chance of flooding over 30 yrs
- 0.0%
- Est. flood insurance / yr
- $507 – $1,088
Fire risk 3/10 · Minor
- Est. fire insurance / yr
- $916 – $1,700
Heat risk 5/10 · Moderate
- Hot days now (above 104°F)
- 7 days/yr
- Hot days in 30 yrs
- 19 days/yr
Wind risk 6/10 · Moderate
- Chance of severe wind over 30 yrs
- 76.0%
Air-quality risk 2/10 · Minimal
- Unhealthy air days now
- 1 days/yr
- Unhealthy air days in 30 yrs
- 1 days/yr
Risk factors via First Street. Map © Google.
Why this score? — see what drove the D- grade
The composite is a weighted blend of 9 inputs, each scored 0–100. Each bar is that input's sub-score; the figure is the points it added to the 100-point composite (weight × sub-score).
- Cash flow +15.0/30.0
- DSCR +4.6/10.0
- Livability +3.2/5.0
- 1% rule +2.9/10.0
- Schools +2.9/10.0
- Rent growth +2.5/5.0
- Condition / age +2.5/5.0
- ARV discount +1.9/15.0
- Appreciation +0.0/10.0
$245,000
🖨 Deal sheet 📄 Offer letter ✓ Due diligence
Listing remarks
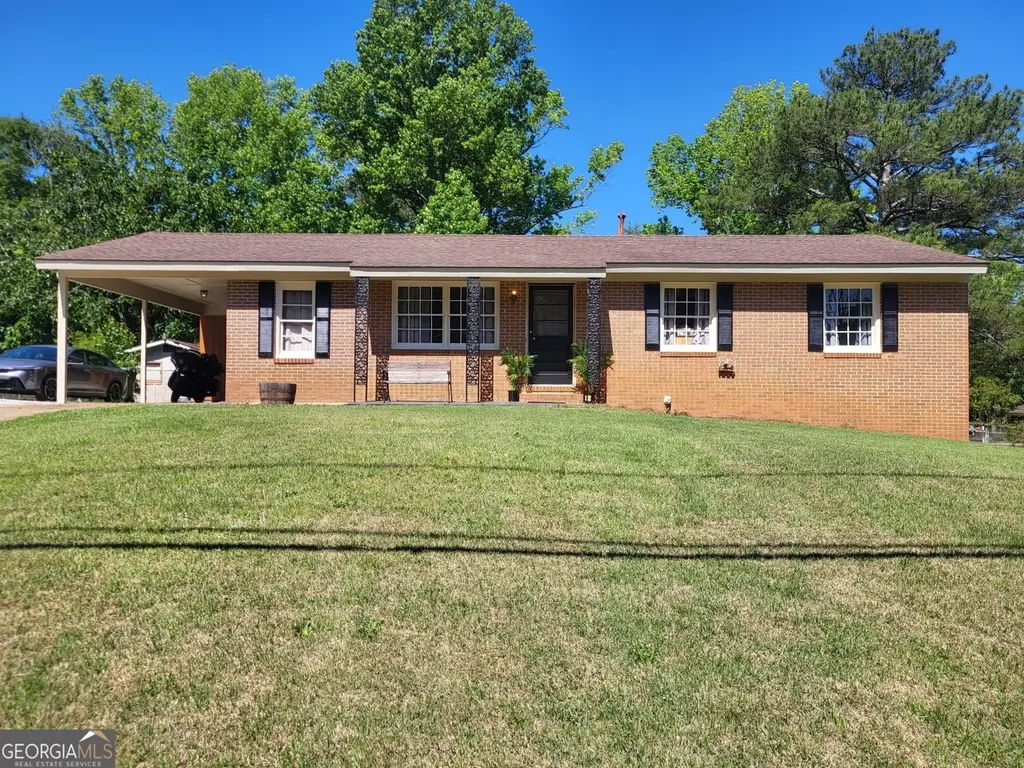
Charming 3BR/1.5BA brick ranch in Opelika has so much to offer! Recent updates include a new HVAC unit, water heater, LVP flooring, and blown insulation, all added less than two years ago. The living room boasts a desk nook and hardwood floors, while the den showcases the new LVP. The kitchen comes with a stainless-steel stove, pantry, and LVP flooring. Bedrooms are good-sized with hardwood floors and new ceiling fans. The full bath features a tub/shower combo and tile flooring, and the half bath is conveniently located off the master bedroom. Outside, enjoy a covered patio, powered and A/C-equipped storage shed, and a fenced yard. Situated on a corner lot just minutes from I-85 and 15 minu
Key facts
- Water heater
- New hvac unit
- Desk nook
Tags
Property features AI
Finance
- HOA & community: No community amenities listed
Exterior
- Parking: Attached carport; 1 covered parking space; 1 carport space
- Utilities: Public water; Public sewer; Electricity available; Natural gas available; Cable available
- Home design: Single-family residence; One level; Residential property; Has a view
- Construction: Brick construction; Blown-in insulation; Composition roof; Crawl space foundation; Built with no common walls
- Exterior features: Covered patio; Back yard; Corner lot; Chain link and privacy fencing; Shed(s)
Interior
- Kitchen: Electric oven; Gas water heater
- Bedrooms: 3 bedrooms (all on the main level)
- Flooring: Hardwood; Laminate; Tile
- Bathrooms: 1 full bathroom; 1 half bathroom
- Heating & cooling: Central heating (natural gas); Central air conditioning; Ceiling fans; Electric cooling components
- Interior features: High speed internet; Storm windows; Storage shed(s)
- Laundry & utility: Laundry closet; Additional laundry area
Neighborhood map
What this means for you Summary
Snapshot
- This is a 3-bed/1.5-bath single-family listed at $245k.
Deal economics
- At list price, monthly cash flow is $76 ($912/yr) — positive.
- The deal already cash-flows at list — no discount required.
- To meet the 1% rule (rent ≥ 1% of price), the offer needs to be $194k (21.0% below list).
- Recommended offer: $194k (21.0% below list) — sets the bar for 1% rule.
- Cap rate 6.7% vs local median 3.8% in Opelika — top-decile yield for the area; either an underpriced asset or a hidden risk that comps aren't pricing in. Stress-test before assuming the spread holds.
Location & tenants
- Location reads 63/100 on livability (#188 in AL) — a middle-class / working-renter tenant base. Strengths: cost of living A+, housing A+; Watch: schools C-, employment C-, crime F.
- Opelika City (urban): math 27% / reading 43% proficiency, ranked #45 of 129 in AL (top 35%) — families likely to look elsewhere, expect single-tenant / working-renter base with shorter leases; 62% free/reduced lunch — lower-income household profile, screen leases tightly.
- Market conditions: 395 active listings in the ZIP; 3 comparable units currently listed for rent nearby; rentals at typical pace (median 21d on market — plan ~3-4 weeks tenant-placement turnaround); 1,858 units permitted in Lee County in 2024 (113 in 5+ unit buildings).
- This rent runs 38% of the median local income ($62k/yr) — at the standard rent-burdened threshold; future hikes will face affordability resistance.
Forward outlook
- Local home prices are declining (-3.0%/yr); year-one equity from $2k of loan paydown is wiped out by about $7k of value loss. Plan a longer hold.
- Lee County population projected at +54% by 2050 — long-run rental-demand tailwind backs the buy-and-hold thesis.
Negotiation context
- Only 3 days on market — expect competitive offers; lowballing is unlikely to land.
- 3 sale attempts with the ask held roughly flat each time — persistent listings suggest the price (not the market) is what's stuck; bring a comps-based counter.
- Current owner paid $120k; list at $245k implies a 104% gain — meaningful room to come down on a strong offer.
Risks & watch-outs
- Climate carrying-cost: major wind risk, 76% chance of damaging wind over 30y; extreme-heat days projected 7→19/yr by 2055 (HVAC capex compounding) — expect insurance premiums to compound above CPI over the hold.
Questions for the listing agent
- Built in 1965 — when were the roof, HVAC, electrical panel, plumbing, and water heater last replaced?
- Is there a deadline driving the sale (1031 exchange, divorce, estate, relocation)? That informs how much negotiation room exists.
- Crime grade is F in this area — have there been break-ins, vandalism, or insurance claims at this property in the last 3 years? What carrier currently insures it and at what premium?
- The area grade is low — what's the realistic commute time and amenity access for the typical tenant pool here? Any planned neighborhood developments (good or bad) we should know about?
- What's the average days-on-market for RENTAL listings here right now (not sales)? A rising rental-DOM trend means longer vacancies and softer asking-rent achievability than the comps imply.
- What's the recent tenant-quality profile in this submarket — average credit score on applications, eviction rate, late-payment / NSF rate, and stable-employment percentage? A property-management company in the area should have these aggregated.
- How much new for-sale + rental construction is in the pipeline within 1–3 miles? Heavy new supply typically softens prices + rents 12–24 months out; constrained supply supports both.
Investment metrics
- 1% rule
- 0.79% ✗
- Cap rate
- 6.67%
- Cash-on-cash
- 1.33%
- DSCR
- 1.06
- GRM
- 10.5
CMA / ARV
- ARV (on-the-fly)
- $217,728
- Comps found
- 12
Show comp detail 12 sales within ~0.75 mi
| Address | Dist | Beds/Ba | Sqft | Sold | Price | $/sf | Match |
|---|---|---|---|---|---|---|---|
| 307 Hall Ave | 0.15mi | 3/1.5 | 1,392 (+7%) | 6mo | $145,000 | $104 | 75 |
| 408 Wittel Ave | 0.12mi | 3/2.0 | 1,352 (+4%) | 22mo | $198,000 | $146 | 67 |
| 602 Edmon Ave | 0.30mi | 4/2.5 (+1) | 1,365 (+5%) | 3mo | $230,000 | $168 | 65 |
| 306 Crawford Rd | 0.71mi | 3/1.5 | 1,272 (-2%) | 0mo | $251,500 | $198 | 63 |
| 2712 Tara Ct | 0.42mi | 3/2.0 | 1,402 (+8%) | 4mo | $285,000 | $203 | 62 |
| 2706 Samantha Ln | 0.33mi | 3/2.0 | 1,479 (+14%) | 1mo | $300,000 | $203 | 58 |
| 2800 Edgemont St | 0.61mi | 3/2.0 | 1,396 (+8%) | 1mo | $231,000 | $165 | 56 |
| 605 Hall Ave | 0.39mi | 3/2.0 | 1,469 (+13%) | 3mo | $230,000 | $157 | 55 |
| 2803 Pineknoll St | 0.49mi | 3/2.0 | 1,276 (-2%) | 22mo | $194,000 | $152 | 54 |
| 107 Southridge Ct | 0.59mi | 3/2.0 | 1,381 (+7%) | 9mo | $235,000 | $170 | 52 |
| 2802 Matsu Ln | 0.40mi | 3/2.0 | 1,450 (+12%) | 9mo | $280,000 | $193 | 52 |
| 102 Ballard Ave | 0.62mi | 3/2.0 | 1,311 (+1%) | 19mo | $202,500 | $154 | 51 |
Match score weights: distance 35% · size 25% · config 20% · recency 20%. Top-matched comps best support the ARV.
Projected returns pro-forma
-3.0% appreciation · 3.0% rent growth · sell at horizon
- IRR
- -14.2%
- Equity multiple
- 0.49×
- Total profit
- $-34,980
- Equity at exit
- $36,530
- IRR
- -5.6%
- Equity multiple
- 0.64×
- Total profit
- $-24,710
- Equity at exit
- $21,183
Cash invested: $68,600 (down + closing). Projections, not guarantees.
Landlord ↔ Tenant lean methodology
- Overall (STATE)
- 90 Strongly Landlord-Friendly
- State Alabama
- 90 Strongly Landlord-Friendly · R+15
- County
- — inherits STATE
- City
- — inherits STATE
ZIP-level market 36804
- Home prices YoY
- -19.0%
- Active inventory
- 395
- Price-to-rent
- 10.5×
Monthly cashflow live
- Estimated rent
- $1,936 medium interval (Pro) →
- Mortgage (P&I)
- −$1,285
- Tax from tax record
- −$67 /mo · $798/yr
- Insurance
- −$102
- HOA
- −$0
- Vacancy / Maint / Mgmt
- −$407
- Net cashflow
- $76
Break-even live
UW: 25.0% down · 7.5% · 30yr · 1.5% tax · 5.0% vac · 8.0% maint · 8.0% mgmt
Financing live
Cash to close
- Down payment
- $61,250
- Closing costs
- $7,350
- Reserves months
- —
- Total cash needed
- —
Loan-product check · same deal, 3 products live
Conventional
25% down · 7.5% · 30yr
- Down + closing
- —
- Monthly P&I
- —
- Monthly cashflow
- —
- DSCR
- —
- Eligible?
- —
Personal DTI + credit; lowest rate.
DSCR
20% down · 8.5% · 30yr
- Down + closing
- —
- Monthly P&I
- —
- Monthly cashflow
- —
- DSCR
- —
- Eligible?
- —
No personal income docs; deal must DSCR.
Hard money
10% down · 12.0% · 12mo
- Down + closing
- —
- Monthly P&I
- —
- Monthly cashflow
- —
- DSCR
- —
- Eligible?
- —
Short-term bridge; refi at stabilization.
Rent comps 3 comps
| Address | Beds | Baths | Sqft | Rent | $/sqft | DOM | Units | Dist |
|---|---|---|---|---|---|---|---|---|
| 2704 Matsu Ln Opelika, AL | 3.0 | 2.0 | 1430 | $2,350 | $1.64 | 20d | 1 | 0.34mi |
| 613 Lismore Dr Opelika, AL | 3.0 | 2.0 | 1300 | $1,600 | $1.23 | 43d | 1 | 1.04mi |
| 1213 Monroe Ave Opelika, AL | 2.0 | 2.0 | 928 | $850 | $0.92 | 20d | 1 | 1.35mi |
Listing history 5 events
-
2026-05-15$245,000 Active 770-char remark
-
2026-05-15$245,000 New 758-char remark
-
2026-05-12historical $245,000 758-char remark
-
2026-05-11historical $245,000 770-char remark
-
2024-07-31soldstatus $120,000
ⓘ Source: listings_history table (triggers on properties + properties_extension) + one-shot
backfill from property_details.listing_events for pre-trigger history.
Tax reassessment forecast AL · Resets to sale price
- Current annual tax
- $798 · $67/mo
- Projected year-2 tax
- $1,005 · $84/mo
- Expected delta
- +$206/yr (+$17/mo · 25.9%)
ⓘ Screening estimate from a state-policy table — verify with the county assessor before closing.
Climate risk First Street
- Flood 1/10 Low FEMA zone X (unshaded) · 0% chance over 30 yrs
- Wildfire 3/10 Moderate
- Heat 5/10 Major 7 d/yr ≥104°F today · 19 d/yr by 30 yrs out
- Wind 6/10 Major 76% chance of damaging wind over 30 yrs
- Air quality 2/10 Low 1 unhealthy d/yr today · 1 by 30 yrs out
Nearby sold comps map
Loading sold comps map…
Walkable amenities ~0.75 mi
Loading nearby amenities…
Taxation est. · year 1
- Rental income
- $23,231
- − Mortgage interest
- −$13,724
- − Property taxes
- −$798
- − Insurance
- −$1,225
- − Repairs & maintenance
- −$1,858
- − Management
- −$1,858
- − Depreciation
- −$7,127
- Taxable loss
- −$3,360
- Est. tax savings @ 24.0%
- +$806
- After-tax cash flow
- $1,718/yr
For passive investors: Depreciation is non-cash, so a rental often shows a tax loss while cash-flowing — sheltering income. Rental losses are passive: they offset passive income freely, and up to $25,000/yr can offset ordinary (W-2) income if you actively participate and your MAGI is under $100k (phasing out to $0 by $150k); unused losses carry forward. On sale, claimed depreciation is recaptured at up to 25%, and gains may owe capital-gains tax (a 1031 exchange can defer both). Figures are a year-1 estimate at your 24.0% rate — not tax advice; consult a CPA.
Schools (NCES district)
- District
- Opelika City
- NCES district ID
- 0102580
- Math proficiency
- 27% ▼ -25.00%
- Reading proficiency
- 43% ▼ -1.00%
- Median HH income
- $40,081
- Composite
- 29.34/100
- National rank
- #6541
- State rank
- #45 of 129 in AL
Livability — Opelika
- Score
- 63/100
- State rank
- #188
- US rank
- #15556
Category grades
Schools grade is shown separately in the Schools card above.
Census & demographics
- Census place
- Opelika, AL
- County
- Lee County · 144,175 people
- City population
- 45,973
- Metro
- Auburn-Opelika, AL
- Population (ZIP)
- 20,535
- Household income
- $61,880
- Rent vs Own
- Severe rent burden
- 399.0
Population outlook (Lee County) Hauer SSP2
- Today (2025)
- 196,440 people
- By 2030
- 217,417 · +10.7%
- By 2040
- 259,467 · +32.1%
- By 2050
- 301,557 · +53.5%
- By 2075
- 402,186 · +104.7%
- By 2100
- 474,503 · +141.6%
Race, ethnicity, and origin ACS 2023
- Neighborhood character
- Diverse neighborhood (Simpson 0.55)
- Race & ethnicity
- White 61% Black 27% Hispanic / Latino 8% Two or more races 6% Native American 1%
- Hispanic origin (detail)
- Mexican 6%
- Common ancestry
- Slovak 2% Serbian 1% Lithuanian 1%
- Foreign-born
- 4% · Canada, South Korea
- Languages at home
- 90% English-only · Spanish 8% Korean 1% Other Indo-European 1%
Political lean MEDSL · Lee
- 2024 margin
- Strong R (+27.8) · D 35.5% · R 63.3% · Other 1.2%
- 2008→2024 swing
- -8.1pp toward R · 2008: -19.8pp · 2024: -27.8pp
- All cycles
- 2024: R+27.8 2020: R+20.1 2016: R+23.1 2012: R+19.9 2008: R+19.8
Not yet ingested
- Civics
- —
Market trends
- HPI YoY
- ▼ -49.83%
- Current HPI
- 212.8718
- Rent YoY
- —
- Metro
- Auburn-Opelika, AL
- State GDP YoY
- ▲ 2.94%
- F500 in state
- 4
Industry mix (Fortune 500 HQ in AL)
| Industry | F500 HQs | Revenue |
|---|---|---|
| Financial Services | 1 | $8B |
|
||
| Healthcare | 1 | $5B |
|
||
Price history
+104.2% since first listed6 events — show timeline
- 2026-05-26 Listing Removed — GAMLS
- 2026-05-26 Relisted — EABOR
- 2026-05-15 Listed $245,000 GAMLS
- 2026-05-12 Coming Soon — GAMLS
- 2026-05-11 Listed $245,000 EABOR
- 2024-07-31 Sold (Public Records) $120,000 Public Records
Property tax history
+5.7%/yrLatest (2025): $798 · -53.1% YoY. Source: county tax records.
Cash-flow waterfall
monthlySold comps — $/sqft
last 12 mo · ≤1 miLoading sold comps…