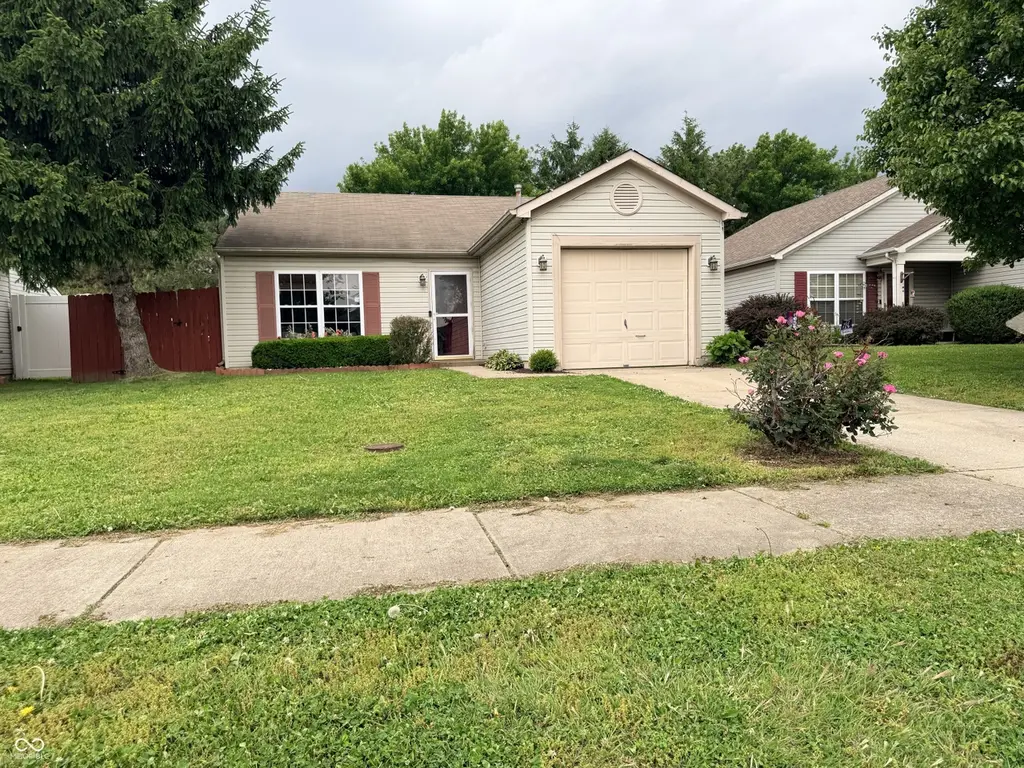
1098 Williamsburg Way · Avon, IN
Flood risk 1/10 · Minimal
- FEMA flood zone
- X (unshaded)
- Chance of flooding over 30 yrs
- 0.0%
- Est. flood insurance / yr
- $507 – $1,088
Fire risk 1/10 · Minimal
- Est. fire insurance / yr
- $717 – $1,331
Heat risk 3/10 · Minor
- Hot days now (above 101°F)
- 7 days/yr
- Hot days in 30 yrs
- 19 days/yr
Wind risk 2/10 · Minimal
- Chance of severe wind over 30 yrs
- 0.0%
Air-quality risk 4/10 · Minor
- Unhealthy air days now
- 4 days/yr
- Unhealthy air days in 30 yrs
- 5 days/yr
Risk factors via First Street. Map © Google.
Why this score? — see what drove the C- grade
The composite is a weighted blend of 9 inputs, each scored 0–100. Each bar is that input's sub-score; the figure is the points it added to the 100-point composite (weight × sub-score).
- Cash flow +16.7/30.0
- ARV discount +11.9/15.0
- DSCR +5.2/10.0
- Schools +4.7/10.0
- Rent growth +4.4/5.0
- 1% rule +4.1/10.0
- Livability +3.7/5.0
- Condition / age +2.5/5.0
- Appreciation +0.0/10.0
$199,900
🖨 Deal sheet 📄 Offer letter ✓ Due diligence
Listing remarks MLS
Ranch Home in AVON school system! 2 Bedrooms can easily be converted to 3 bedrooms if needed! Master bedroom includes walk-in-closet & Full walk-in-shower! Nice backyard with FULL Privacy Fence and nice landscaping around home..Neighborhood includes park conveniently located behind this home!
Key facts
- Avon school district
- Updated hvac system
- Water heater
Tags
Property features AI
Finance
- Other: Mandatory fee ownership interest
- HOA & community: Homeowners association with an annual fee of $225
Exterior
- Parking: Attached garage (1 car)
- Utilities: Public water; Municipal sewer connected; Municipal solid waste service
- Home design: Single-family residence; One-story home
- Construction: Vinyl siding; Slab foundation
- Exterior features: Lot under 1/4 acre (approximately 0.12 acre)
Interior
- Kitchen: Kitchen with space for dining; Includes refrigerator
- Bedrooms: Three bedrooms on the main level
- Bathrooms: Two full bathrooms (both on the main level)
- Heating & cooling: Natural gas heating; Central air conditioning
- Interior features: Attic access; Eat-in kitchen; Electric fireplace in living room
- Laundry & utility: Main-level laundry (9 x 5)
Neighborhood map
What this means for you Summary
Snapshot
- This is a 2-bed/2.0-bath single-family listed at $200k.
Deal economics
- At list price, monthly cash flow is $124 ($1k/yr) — positive.
- The deal already cash-flows at list — no discount required.
- To meet the 1% rule (rent ≥ 1% of price), the offer needs to be $181k (9.5% below list).
- Recommended offer: $181k (9.5% below list) — sets the bar for 1% rule.
- Cap rate 7.0% vs local median 3.8% in Avon — top-decile yield for the area; either an underpriced asset or a hidden risk that comps aren't pricing in. Stress-test before assuming the spread holds.
Location & tenants
- Location reads 74/100 on livability (#75 in IN, #4,686 nationally) — a middle-class / working-renter tenant base. Strengths: employment A+, cost of living A+, housing A+; Watch: amenities F, commute F.
- Avon Community School Corporation (suburban): math 51% / reading 53% proficiency, ranked #32 of 301 in IN (top 11%) — acceptable for families but not a draw, mixed tenant base, ~2y average lease; only 20% free/reduced lunch — higher-income household profile.
- Zoned schools: Avon High School (math 44% / reading 76%, grade C+, #46 of 369 statewide, top 13%, 3,348 students, 38% FRL) — zoned schools average 38% FRL vs 20% district-wide (19 pts higher); higher-poverty schools than district average — tighter screening recommended.
- Market conditions: Rents rising fast (+7.6%/yr); 64 active listings in the ZIP; 9 comparable units currently listed for rent nearby; rentals at typical pace (median 18d on market — plan ~3-4 weeks tenant-placement turnaround); solid renter incomes; 1,294 units permitted in Hendricks County in 2024 (18 in 5+ unit buildings).
Forward outlook
- Local home prices are declining (-3.0%/yr); year-one equity from $1k of loan paydown is wiped out by about $6k of value loss. Plan a longer hold.
- Hendricks County population projected at +35% by 2050 — long-run rental-demand tailwind backs the buy-and-hold thesis.
Negotiation context
- Only 2 days on market — expect competitive offers; lowballing is unlikely to land.
- 8 sale attempts since 18y ago with the ask held roughly flat each time — persistent listings suggest the price (not the market) is what's stuck; bring a comps-based counter.
- Current owner paid $125k; list at $200k implies a 60% gain — meaningful room to come down on a strong offer.
Questions for the listing agent
- What does the HOA fee cover, when was the last increase, and are there any pending special assessments or reserve-fund shortfalls?
- Is there a deadline driving the sale (1031 exchange, divorce, estate, relocation)? That informs how much negotiation room exists.
- Schools are A-rated — typically a magnet for longer-tenancy family renters. What's the average tenant stay here, and is there a school-zone premium baked into asking?
- What's the average days-on-market for RENTAL listings here right now (not sales)? A rising rental-DOM trend means longer vacancies and softer asking-rent achievability than the comps imply.
- What's the recent tenant-quality profile in this submarket — average credit score on applications, eviction rate, late-payment / NSF rate, and stable-employment percentage? A property-management company in the area should have these aggregated.
- How much new for-sale + rental construction is in the pipeline within 1–3 miles? Heavy new supply typically softens prices + rents 12–24 months out; constrained supply supports both.
Investment metrics
- 1% rule
- 0.91% ✗
- Cap rate
- 7.04%
- Cash-on-cash
- 2.66%
- DSCR
- 1.12
- GRM
- 9.2
CMA / ARV
- ARV (on-the-fly)
- $221,796
- Comps found
- 4
Show comp detail 4 sales within ~0.75 mi
| Address | Dist | Beds/Ba | Sqft | Sold | Price | $/sf | Match |
|---|---|---|---|---|---|---|---|
| 1270 Valley Forge Dr | 0.29mi | 3/2.0 (+1) | 1,178 (+7%) | 6mo | $217,500 | $185 | 64 |
| 10652 Revere Ln | 0.09mi | 3/2.0 (+1) | 1,178 (+7%) | 19mo | $237,500 | $202 | 63 |
| 1415 Linden Way | 0.41mi | 3/2.0 (+1) | 1,258 (+15%) | 2mo | $245,000 | $195 | 50 |
| 1341 Valley Forge Dr | 0.36mi | 3/2.0 (+1) | 1,256 (+14%) | 14mo | $265,000 | $211 | 42 |
Match score weights: distance 35% · size 25% · config 20% · recency 20%. Top-matched comps best support the ARV.
Projected returns pro-forma
-3.0% appreciation · 7.56% rent growth · sell at horizon
- IRR
- -7.3%
- Equity multiple
- 0.72×
- Total profit
- $-15,828
- Equity at exit
- $29,806
- IRR
- 7.0%
- Equity multiple
- 1.63×
- Total profit
- $35,463
- Equity at exit
- $17,284
Cash invested: $55,972 (down + closing). Projections, not guarantees.
Landlord ↔ Tenant lean methodology
- Overall (STATE)
- 90 Strongly Landlord-Friendly
- State Indiana
- 90 Strongly Landlord-Friendly · R+11
- County
- — inherits STATE
- City
- — inherits STATE
ZIP-level market 46234
- Home prices YoY
- -33.0%
- Rents YoY
- 7.6%
- Active inventory
- 64
- Price-to-rent
- 9.2×
Monthly cashflow live
- Estimated rent
- $1,809 high interval (Pro) →
- Mortgage (P&I)
- −$1,048
- Tax from tax record
- −$155 /mo · $1,856/yr
- Insurance
- −$83
- HOA
- −$19
- Vacancy / Maint / Mgmt
- −$380
- Net cashflow
- $124
Break-even live
UW: 25.0% down · 7.5% · 30yr · 1.5% tax · 5.0% vac · 8.0% maint · 8.0% mgmt
Financing live
Cash to close
- Down payment
- $49,975
- Closing costs
- $5,997
- Reserves months
- —
- Total cash needed
- —
Loan-product check · same deal, 3 products live
Conventional
25% down · 7.5% · 30yr
- Down + closing
- —
- Monthly P&I
- —
- Monthly cashflow
- —
- DSCR
- —
- Eligible?
- —
Personal DTI + credit; lowest rate.
DSCR
20% down · 8.5% · 30yr
- Down + closing
- —
- Monthly P&I
- —
- Monthly cashflow
- —
- DSCR
- —
- Eligible?
- —
No personal income docs; deal must DSCR.
Hard money
10% down · 12.0% · 12mo
- Down + closing
- —
- Monthly P&I
- —
- Monthly cashflow
- —
- DSCR
- —
- Eligible?
- —
Short-term bridge; refi at stabilization.
Rent comps 9 comps
| Address | Beds | Baths | Sqft | Rent | $/sqft | DOM | Units | Dist |
|---|---|---|---|---|---|---|---|---|
| 10435 Cox Pl Indianapolis, IN | 1.0–2.0 | 1.0–2.0 | 999 | $1,625 | $1.63 | 43d | 1 | 0.33mi |
| 10341 Buckshire Ln Indianapolis, IN | 3.0 | 2.0 | 1257 | $1,779 | $1.42 | 43d | 1 | 0.45mi |
| 781 Hollowood Ln Avon, IN | 3.0 | 2.0 | 1370 | $1,800 | $1.31 | 43d | 1 | 0.82mi |
| 10272 Steeplechase Dr Avon, IN | 1.0–3.0 | 1.0–2.0 | 940 | $1,578 | $1.68 | 1d | 42 | 0.96mi |
| 10318 E County Road 200 N Indianapolis, IN | 2.0 | 1.0 | 825 | $1,420 | $1.72 | 16d | 4 | 0.97mi |
| 9762 Trail Dr Avon, IN | 3.0 | 2.0 | 1212 | $1,901 | $1.57 | 1d | 1 | 1.05mi |
| 2135 Redland Rd Indianapolis, IN | 2.0–3.0 | 2.0 | 1136 | $1,329 | $1.17 | 1d | 1 | 1.13mi |
| 9661 Trail Dr Avon, IN | 3.0 | 2.0 | 1444 | $1,925 | $1.33 | 17d | 1 | 1.15mi |
| 481 Villa Meadow Dr Avon, IN | 3.0 | 2.0 | 1300 | $1,900 | $1.46 | 23d | 1 | 1.30mi |
HOA detail
- Monthly dues
- $19 · $228/yr
- Likely covers
- landscaping
Listing history 21 events
-
2026-05-21status Pending
-
2026-05-19$199,900 Active
-
2018-12-31soldstatus $125,000 Sold 297-char remark
Show marketing remark (297 chars)
Ranch Home in AVON school system! 2 Bedrooms can easily be converted to 3 bedrooms if needed! Master bedroom includes walk-in-closet & Full walk-in-shower! Nice backyard with FULL Privacy Fence and nice landscaping around home..Neighborhood includes park conveniently located behind this home!
-
2018-11-18status Pending 297-char remark
Show marketing remark (297 chars)
Ranch Home in AVON school system! 2 Bedrooms can easily be converted to 3 bedrooms if needed! Master bedroom includes walk-in-closet & Full walk-in-shower! Nice backyard with FULL Privacy Fence and nice landscaping around home..Neighborhood includes park conveniently located behind this home!
-
2018-11-02$125,000 Active 297-char remark
Show marketing remark (297 chars)
Ranch Home in AVON school system! 2 Bedrooms can easily be converted to 3 bedrooms if needed! Master bedroom includes walk-in-closet & Full walk-in-shower! Nice backyard with FULL Privacy Fence and nice landscaping around home..Neighborhood includes park conveniently located behind this home!
-
2018-11-01historical
-
2018-09-24$125,000 Active
-
2017-11-01historical
-
2017-10-23price $116,900
-
2017-10-23historical Active with Contingency
-
2017-10-13$119,900 Active
-
2015-09-09soldstatus $99,500 Sold
-
2015-06-05historical Contingent - Backup Pending Other
-
2015-04-17$103,500 Active
-
2012-04-19historical
-
2012-04-19soldstatus $83,500
-
2012-01-06$84,900
-
2012-01-04historical
-
2011-05-02$84,900
-
2008-10-17historical
-
2008-04-14$99,900
ⓘ Source: listings_history table (triggers on properties + properties_extension) + one-shot
backfill from property_details.listing_events for pre-trigger history.
Tax reassessment forecast IN · Partial reset (capped growth)
- Current annual tax
- $1,856 · $155/mo
- Projected year-2 tax
- $1,856 · $155/mo
- Expected delta
- $0/yr ($0/mo · -0.0%)
ⓘ Screening estimate from a state-policy table — verify with the county assessor before closing.
Climate risk First Street
- Flood 1/10 Low FEMA zone X (unshaded) · 0% chance over 30 yrs
- Wildfire 1/10 Low
- Heat 3/10 Moderate 7 d/yr ≥101°F today · 19 d/yr by 30 yrs out
- Wind 2/10 Low 0% chance of damaging wind over 30 yrs
- Air quality 4/10 Moderate 4 unhealthy d/yr today · 5 by 30 yrs out
Nearby sold comps map
Loading sold comps map…
Walkable amenities ~0.75 mi
Loading nearby amenities…
Taxation est. · year 1
- Rental income
- $21,711
- − Mortgage interest
- −$11,198
- − Property taxes
- −$1,856
- − Insurance
- −$1,000
- − Repairs & maintenance
- −$1,737
- − Management
- −$1,737
- − HOA
- −$228
- − Depreciation
- −$5,815
- Taxable loss
- −$1,859
- Est. tax savings @ 24.0%
- +$446
- After-tax cash flow
- $1,935/yr
For passive investors: Depreciation is non-cash, so a rental often shows a tax loss while cash-flowing — sheltering income. Rental losses are passive: they offset passive income freely, and up to $25,000/yr can offset ordinary (W-2) income if you actively participate and your MAGI is under $100k (phasing out to $0 by $150k); unused losses carry forward. On sale, claimed depreciation is recaptured at up to 25%, and gains may owe capital-gains tax (a 1031 exchange can defer both). Figures are a year-1 estimate at your 24.0% rate — not tax advice; consult a CPA.
Schools (NCES district)
- District
- Avon Community School Corporation
- NCES district ID
- 1800270
- Math proficiency
- 51% ▼ -8.00%
- Reading proficiency
- 53% ▼ -8.00%
- Median HH income
- $75,987
- Composite
- 46.93/100
- National rank
- #2362
- State rank
- #32 of 301 in IN
Livability — Avon
- Score
- 74/100
- State rank
- #75
- US rank
- #4686
Category grades
Schools grade is shown separately in the Schools card above.
Census & demographics
- County
- Marion County · 998,460 people
- City population
- 43,353
- Metro
- Indianapolis-Carmel-Anderson, IN
- Population (ZIP)
- 28,300
- Household income
- $83,190
- Rent vs Own
- Severe rent burden
- 764.0
Population outlook (Hendricks County) Hauer SSP2
- Today (2025)
- 187,418 people
- By 2030
- 201,494 · +7.5%
- By 2040
- 228,487 · +21.9%
- By 2050
- 253,068 · +35.0%
- By 2075
- 308,920 · +64.8%
- By 2100
- 336,510 · +79.6%
Race, ethnicity, and origin ACS 2023
- Neighborhood character
- Diverse neighborhood (Simpson 0.56)
- Race & ethnicity
- White 63% Black 19% Hispanic / Latino 10% Two or more races 7% Asian 4%
- Hispanic origin (detail)
- Mexican 6%
- Common ancestry
- Italian 2% Romanian 2% Iranian 2%
- Foreign-born
- 11% · Canada, China, United Kingdom
- Languages at home
- 82% English-only · Spanish 8% Other Indo-European 3% French/Haitian/Cajun 3%
Political lean MEDSL · Hendricks
- 2024 margin
- Strong R (+21.5) · D 38.4% · R 59.9% · Other 1.7%
- 2008→2024 swing
- +1.9pp toward D · 2008: -23.4pp · 2024: -21.5pp
- All cycles
- 2024: R+21.5 2020: R+23.9 2016: R+34.2 2012: R+34.9 2008: R+23.4
Not yet ingested
- Civics
- —
Market trends
- HPI YoY
- ▼ -106.23%
- Current HPI
- 215.5854
- Rent YoY
- ▲ 7.56%
- Metro
- Indianapolis-Carmel-Anderson, IN
- State GDP YoY
- ▲ 2.90%
- F500 in state
- 18
Industry mix (Fortune 500 HQ in IN)
| Industry | F500 HQs | Revenue |
|---|---|---|
| Industrial Machinery | 2 | $37B |
|
||
| Healthcare | 1 | $177B |
|
||
| Pharmaceuticals | 1 | $45B |
|
||
| Metals / Steel | 1 | $18B |
|
||
| Agriculture | 1 | $17B |
|
||
| Packaging | 1 | $12B |
|
||
Price history
+100.1% since first listed21 events — show timeline
- 2026-05-21 Pending — MIBOR as Distributed by MLS Grid
- 2026-05-19 Listed $199,900 MIBOR as Distributed by MLS Grid
- 2018-12-31 Sold (MLS) $125,000 MIBOR as Distributed by MLS Grid
- 2018-11-18 Pending — MIBOR as Distributed by MLS Grid
- 2018-11-02 Listed $125,000 MIBOR as Distributed by MLS Grid
- 2018-11-01 Listing Removed — MIBOR as Distributed by MLS Grid
- 2018-09-24 Listed $125,000 MIBOR as Distributed by MLS Grid
- 2017-11-01 Listing Removed — MIBOR as Distributed by MLS Grid
- 2017-10-23 Price Changed $116,900 MIBOR as Distributed by MLS Grid
- 2017-10-23 Contingent — MIBOR as Distributed by MLS Grid
- 2017-10-13 Listed $119,900 MIBOR as Distributed by MLS Grid
- 2015-09-09 Sold (MLS) $99,500 MIBOR as Distributed by MLS Grid
- 2015-06-05 Contingent — MIBOR as Distributed by MLS Grid
- 2015-04-17 Listed $103,500 MIBOR as Distributed by MLS Grid
- 2012-04-19 Listing Removed — MIBOR as Distributed by MLS Grid
- 2012-04-19 Sold (MLS) $83,500 MIBOR as Distributed by MLS Grid
- 2012-01-06 Listed $84,900 MIBOR as Distributed by MLS Grid
- 2012-01-04 Listing Removed — MIBOR as Distributed by MLS Grid
- 2011-05-02 Listed $84,900 MIBOR as Distributed by MLS Grid
- 2008-10-17 Listing Removed — MIBOR as Distributed by MLS Grid
- 2008-04-14 Listed $99,900 MIBOR as Distributed by MLS Grid
Property tax history
+7.1%/yrLatest (2025): $1,856 · +20.5% YoY. Source: county tax records.
Cash-flow waterfall
monthlySold comps — $/sqft
last 12 mo · ≤1 miLoading sold comps…