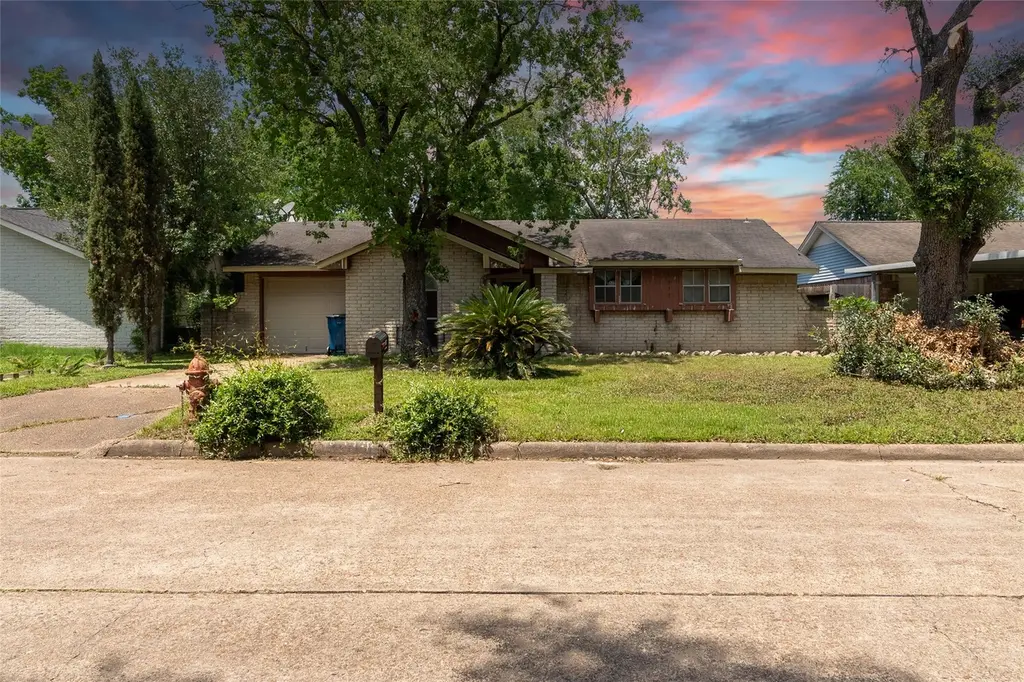
1938 Barnsley Ln · Houston, TX
Flood risk 4/10 · Minor
- FEMA flood zone
- X (shaded)
- Chance of flooding over 30 yrs
- 0.22%
- Est. flood insurance / yr
- $507 – $1,088
Fire risk 3/10 · Minor
- Est. fire insurance / yr
- $1,222 – $2,270
Heat risk 9/10 · Severe
- Hot days now (above 109°F)
- 7 days/yr
- Hot days in 30 yrs
- 24 days/yr
Wind risk 9/10 · Severe
- Chance of severe wind over 30 yrs
- 99.0%
Air-quality risk 3/10 · Minor
- Unhealthy air days now
- 3 days/yr
- Unhealthy air days in 30 yrs
- 4 days/yr
Risk factors via First Street. Map © Google.
Why this score? — see what drove the B grade
The composite is a weighted blend of 9 inputs, each scored 0–100. Each bar is that input's sub-score; the figure is the points it added to the 100-point composite (weight × sub-score).
- Cash flow +28.9/30.0
- ARV discount +15.0/15.0
- DSCR +10.0/10.0
- 1% rule +8.7/10.0
- Livability +3.7/5.0
- Condition / age +2.5/5.0
- Rent growth +2.2/5.0
- Schools +1.5/10.0
- Appreciation +0.0/10.0
$140,000
🖨 Deal sheet (PDF) 📄 Offer letter ✓ Due diligence
Listing remarks
Great opportunity to own an affordable 3 bedroom home in Houston!! This well maintained property offers a functional floor plan, updated flooring in most rooms, neutral paint, and a spacious living area. The home is move in ready with central AC and a one car garage. Large backyard provides plenty of room for outdoor enjoyment, gardening , or entertaining. Conveniently located with easy access to major highways, shopping. Priced to sell
Key facts
- Spacious living area
- Large backyard
- Updated flooring
Tags
Property features AI
Finance
- Other: Seller disclosure available
Exterior
- Parking: Attached garage (1 space)
- Utilities: Public water; Public sewer
- Home design: Residential property; Entry level: First floor
- Construction: Built in 1973; Brick and wood siding exterior; Shingle and wood roof; Slab foundation
- Exterior features: Concrete road frontage; Subdivision lot
Interior
- Kitchen: Kitchen (first floor)
- Bedrooms: Primary bedroom (first floor); Two additional bedrooms (first floor)
- Bathrooms: 1 full bathroom; 1 half bathroom
- Heating & cooling: Central electric heating; Central electric cooling (Central Air)
- Interior features: Living room; Total of 7 rooms
Neighborhood map
What this means for you Summary
Snapshot
- This is a 3-bed/1.5-bath single-family listed at $140k.
Deal economics
- At list price, monthly cash flow is $473 ($6k/yr) — positive.
- The deal already cash-flows at list — no discount required.
- Meets the 1% rule at list price ($2k rent vs $140k).
- Cap rate 10.3% vs local median 3.2% in Houston — top-decile yield for the area; either an underpriced asset or a hidden risk that comps aren't pricing in. Stress-test before assuming the spread holds.
Location & tenants
- Location reads 74/100 on livability (#184 in TX, #4,771 nationally) — a middle-class / working-renter tenant base. Strengths: amenities A+, cost of living A+, housing A+; Watch: crime F.
- Aldine ISD (suburban): math 16% / reading 21% proficiency, ranked #790 of 826 in TX (top 96%) — low school quality limits family demand, transient renter base, plan for 1-2y turnover; 79% free/reduced lunch — lower-income household profile, screen leases tightly.
- Zoned schools: Garcia Middle (math 18% / reading 24%, grade F, #1,387 of 1,662 statewide, top 85%, 1,054 students, 90% FRL); Eisenhower H S (math 16% / reading 23%, grade F, #1,424 of 1,632 statewide, top 88%, 2,855 students, 83% FRL).
- Market conditions: Rents soft (-1.0%/yr); 468 active listings in the ZIP; 15 comparable units currently listed for rent nearby; rentals at typical pace (median 21d on market — plan ~3-4 weeks tenant-placement turnaround); 40% of comp listings sitting > 30 days — soft ceiling on asking rent; 29,883 units permitted in Harris County in 2024 (8,621 in 5+ unit buildings).
- This rent runs 42% of the median local income ($54k/yr) — at the standard rent-burdened threshold; future hikes will face affordability resistance.
Forward outlook
- Local home prices are declining (-3.0%/yr); year-one equity from $968 of loan paydown is wiped out by about $4k of value loss. Plan a longer hold.
- Harris County population projected at +47% by 2050 — long-run rental-demand tailwind backs the buy-and-hold thesis.
Negotiation context
- Only 2 days on market — expect competitive offers; lowballing is unlikely to land.
Risks & watch-outs
- Climate carrying-cost: severe wind risk, 99% chance of damaging wind over 30y; extreme-heat days projected 7→24/yr by 2055 (HVAC capex compounding) — expect insurance premiums to compound above CPI over the hold.
Questions for the listing agent
- Built in 1973 — when were the roof, HVAC, electrical panel, plumbing, and water heater last replaced?
- Is there a deadline driving the sale (1031 exchange, divorce, estate, relocation)? That informs how much negotiation room exists.
- Schools are D-rated, which usually means shorter tenancies and higher turnover. Who's the typical renter profile here, and what's been the actual vacancy rate?
- Crime grade is F in this area — have there been break-ins, vandalism, or insurance claims at this property in the last 3 years? What carrier currently insures it and at what premium?
- What's the average days-on-market for RENTAL listings here right now (not sales)? A rising rental-DOM trend means longer vacancies and softer asking-rent achievability than the comps imply.
- What's the recent tenant-quality profile in this submarket — average credit score on applications, eviction rate, late-payment / NSF rate, and stable-employment percentage? A property-management company in the area should have these aggregated.
- How much new for-sale + rental construction is in the pipeline within 1–3 miles? Heavy new supply typically softens prices + rents 12–24 months out; constrained supply supports both.
Investment metrics
- 1% rule
- 1.37% ✓
- Cap rate
- 10.34%
- Cash-on-cash
- 14.47%
- DSCR
- 1.64
- GRM
- 6.1
CMA / ARV
- ARV (on-the-fly)
- $169,171
- Comps found
- 9
Show comp detail 9 sales within ~0.75 mi
| Address | Dist | Beds/Ba | Sqft | Sold | Price | $/sf | Match |
|---|---|---|---|---|---|---|---|
| 1902 Bunzel St | 0.25mi | 3/2.0 | 1,030 (+2%) | 0mo | $198,000 | $192 | 83 |
| 8839 Glenhouse Dr | 0.43mi | 3/1.5 | 935 (-8%) | 1mo | $129,000 | $138 | 67 |
| 8811 Cottage Gate Ln | 0.51mi | 3/1.5 | 989 (-2%) | 11mo | $208,000 | $210 | 63 |
| 1710 Beaver Bend Rd | 0.30mi | 3/2.0 | 1,134 (+12%) | 2mo | $223,000 | $197 | 62 |
| 1939 Mosher Ln | 0.10mi | 2/1.0 (-1) | 885 (-13%) | 10mo | $130,000 | $147 | 59 |
| 2007 Beaver Bend Rd | 0.15mi | 2/1.0 (-1) | 1,074 (+6%) | 22mo | $171,900 | $160 | 58 |
| 9018 Rutherford Ln | 0.49mi | 3/1.5 | 934 (-8%) | 8mo | $165,000 | $177 | 58 |
| 1811 W Gulf Bank Rd | 0.63mi | 3/1.5 | 1,021 (+1%) | 15mo | $170,000 | $167 | 57 |
| 1407 Rainy River Dr | 0.60mi | 3/1.5 | 1,120 (+11%) | 22mo | $179,999 | $161 | 36 |
Match score weights: distance 35% · size 25% · config 20% · recency 20%. Top-matched comps best support the ARV.
Projected returns pro-forma
-3.0% appreciation · 0.0% rent growth · sell at horizon
- IRR
- 1.3%
- Equity multiple
- 1.05×
- Total profit
- $1,855
- Equity at exit
- $20,874
- IRR
- 7.5%
- Equity multiple
- 1.48×
- Total profit
- $18,902
- Equity at exit
- $12,105
Cash invested: $39,200 (down + closing). Projections, not guarantees.
Landlord ↔ Tenant lean methodology
- Overall (STATE)
- 87 Strongly Landlord-Friendly
- State Texas
- 87 Strongly Landlord-Friendly · R+5
- County
- — inherits STATE
- City
- — inherits STATE
ZIP-level market 77088
- Home prices YoY
- -23.2%
- Rents YoY
- -1.0%
- Active inventory
- 468
- Price-to-rent
- 6.1×
Monthly cashflow live
- Estimated rent
- $1,924 high interval (Pro) →
- Mortgage (P&I)
- −$734
- Tax from tax record
- −$255 /mo · $3,061/yr
- Insurance
- −$58
- HOA
- −$0
- Vacancy / Maint / Mgmt
- −$404
- Net cashflow
- $473
Break-even live
Sensitivity live
| Price | -10% $552 | -5% $512 | +0% $473 | +5% $433 | +10% $393 |
|---|---|---|---|---|---|
| Rent | -10% $321 | -5% $397 | +0% $473 | +5% $549 | +10% $625 |
| Rate | -1.0pp $543 | -0.5pp $508 | base $473 | +0.5pp $436 | +1.0pp $399 |
UW: 25.0% down · 7.5% · 30yr · 1.5% tax · 5.0% vac · 8.0% maint · 8.0% mgmt
Financing live
Cash to close
- Down payment
- $35,000
- Closing costs
- $4,200
- Reserves months
- —
- Total cash needed
- —
Loan-product check · same deal, 3 products live
Conventional
25% down · 7.5% · 30yr
- Down + closing
- —
- Monthly P&I
- —
- Monthly cashflow
- —
- DSCR
- —
- Eligible?
- —
Personal DTI + credit; lowest rate.
DSCR
20% down · 8.5% · 30yr
- Down + closing
- —
- Monthly P&I
- —
- Monthly cashflow
- —
- DSCR
- —
- Eligible?
- —
No personal income docs; deal must DSCR.
Hard money
10% down · 12.0% · 12mo
- Down + closing
- —
- Monthly P&I
- —
- Monthly cashflow
- —
- DSCR
- —
- Eligible?
- —
Short-term bridge; refi at stabilization.
Rent comps 15 comps
| Address | Beds | Baths | Sqft | Rent | $/sqft | DOM | Units | Dist |
|---|---|---|---|---|---|---|---|---|
| 1438 Peach Spring Dr Houston, TX | 4.0 | 1.5 | 1288 | $1,599 | $1.24 | 2d | 1 | 0.66mi |
| 1330 Blue Bell Rd Houston, TX | 2.0–3.0 | 1.0–2.0 | 1418 | $1,790 | $1.26 | 2d | 6 | 0.79mi |
| 1450 Dewalt St Houston, TX | 3.0 | 2.5 | 1371 | $2,500 | $1.82 | 44d | 1 | 0.90mi |
| 9750 Deer Trail Dr Houston, TX | 3.0 | 2.0 | 1050 | $2,200 | $2.10 | 44d | 1 | 1.01mi |
| 9750 Deer Trail Dr Houston, TX | 2.0 | 2.0 | 1000 | $1,800 | $1.80 | 25d | 1 | 1.01mi |
| 2320 Wavell St Unit A Houston, TX | 3.0 | 2.5 | 1150 | $1,900 | $1.65 | 44d | 1 | 1.08mi |
| 2320 Wavell St Unit B Houston, TX | 3.0 | 2.5 | 1150 | $1,683 | $1.46 | 44d | 1 | 1.08mi |
| 1464 Ferguson Way Houston, TX | 2.0 | 3.0 | 850 | $1,850 | $2.18 | 44d | 1 | 1.15mi |
| 2722 Stallings Dr Houston, TX | 3.0 | 2.0 | 1298 | $1,635 | $1.26 | 5d | 1 | 1.30mi |
| 2407 Ferguson Way Houston, TX | 3.0 | 2.5 | 1195 | $1,650 | $1.38 | 44d | 1 | 1.42mi |
| 2850 W Gulf Bank Rd Houston, TX | 1.0–4.0 | 1.0–2.0 | 1055 | $1,413 | $1.34 | 2d | 107 | 1.43mi |
| 929 Marjorie St Unit 1060806P Houston, TX | 3.0 | 2.0 | 1076 | $3,091 | $2.87 | 8d | 1 | 1.46mi |
| 8312 De Priest St Unit B Houston, TX | 3.0 | 3.5 | 1500 | $1,900 | $1.27 | 21d | 1 | 1.48mi |
| 8312 De Priest St Unit A Houston, TX | 3.0 | 2.5 | 1500 | $1,900 | $1.27 | 21d | 1 | 1.48mi |
| 8310 De Priest St Unit B Houston, TX | 3.0 | 2.5 | 1500 | $1,900 | $1.27 | 21d | 1 | 1.49mi |
Listing history 3 events
-
2026-05-14status Pending
-
2026-05-12$140,000 Active
-
1991-07-28soldstatus
ⓘ Source: listings_history table (triggers on properties + properties_extension) + one-shot
backfill from property_details.listing_events for pre-trigger history.
Tax reassessment forecast TX · Resets to sale price
- Current annual tax
- $3,061 · $255/mo
- Projected year-2 tax
- $3,061 · $255/mo
- Expected delta
- $0/yr ($0/mo · 0.0%)
ⓘ Screening estimate from a state-policy table — verify with the county assessor before closing.
Climate risk First Street
- Flood 4/10 Moderate FEMA zone X (shaded) · 22% chance over 30 yrs
- Wildfire 3/10 Moderate
- Heat 9/10 Extreme 7 d/yr ≥109°F today · 24 d/yr by 30 yrs out
- Wind 9/10 Extreme 99% chance of damaging wind over 30 yrs
- Air quality 3/10 Moderate 3 unhealthy d/yr today · 4 by 30 yrs out
Nearby sold comps map
Loading sold comps map…
Walkable amenities ~0.75 mi
Loading nearby amenities…
Taxation est. · year 1
- Rental income
- $23,091
- − Mortgage interest
- −$7,842
- − Property taxes
- −$3,061
- − Insurance
- −$700
- − Repairs & maintenance
- −$1,847
- − Management
- −$1,847
- − Depreciation
- −$4,073
- Taxable income
- $3,721
- Est. tax owed @ 24.0%
- −$893
- After-tax cash flow
- $4,779/yr
For passive investors: Depreciation is non-cash, so a rental often shows a tax loss while cash-flowing — sheltering income. Rental losses are passive: they offset passive income freely, and up to $25,000/yr can offset ordinary (W-2) income if you actively participate and your MAGI is under $100k (phasing out to $0 by $150k); unused losses carry forward. On sale, claimed depreciation is recaptured at up to 25%, and gains may owe capital-gains tax (a 1031 exchange can defer both). Figures are a year-1 estimate at your 24.0% rate — not tax advice; consult a CPA.
Schools (NCES district)
- District
- Aldine ISD
- NCES district ID
- 4807710
- Math proficiency
- 16% ▼ -23.00%
- Reading proficiency
- 21% ▼ -11.00%
- Median HH income
- $37,081
- Composite
- 15.42/100
- National rank
- #9317
- State rank
- #790 of 826 in TX
Livability — Houston
- Score
- 74/100
- State rank
- #184
- US rank
- #4771
Category grades
Schools grade is shown separately in the Schools card above.
Census & demographics
- County
- Harris County · 4,702,590 people
- City population
- 3,226,434
- Metro
- Houston-The Woodlands-Sugar Land, TX
- Population (ZIP)
- 57,047
- Household income
- $54,411
- Rent vs Own
- Severe rent burden
- 2294.0
Population outlook (Harris County) Hauer SSP2
- Today (2025)
- 5,571,493 people
- By 2030
- 6,089,821 · +9.3%
- By 2040
- 7,142,806 · +28.2%
- By 2050
- 8,185,864 · +46.9%
- By 2075
- 10,574,329 · +89.8%
- By 2100
- 12,109,958 · +117.4%
Race, ethnicity, and origin ACS 2023
- Neighborhood character
- Diverse neighborhood (Simpson 0.59)
- Race & ethnicity
- Hispanic / Latino 52% Black 37% Two or more races 18% White 6% Asian 4%
- Hispanic origin (detail)
- Mexican 36%
- Common ancestry
- Lithuanian 1%
- Foreign-born
- 25% · Canada, Vietnam, China
- Languages at home
- 49% English-only · Spanish 47% Vietnamese 3%
Political lean MEDSL · Harris
- 2024 margin
- Lean D (+5.5) · D 52.0% · R 46.4% · Other 1.6%
- 2008→2024 swing
- +3.9pp toward D · 2008: 1.6pp · 2024: 5.5pp
- All cycles
- 2024: D+5.5 2020: D+13.3 2016: D+12.4 2012: D+0.1 2008: D+1.6
Not yet ingested
- Civics
- —
Market trends
- HPI YoY
- ▼ -98.37%
- Current HPI
- 325.0499
- Rent YoY
- ▼ -1.01%
- Metro
- Houston-The Woodlands-Sugar Land, TX
- State GDP YoY
- ▲ 3.95%
- F500 in state
- 110
Industry mix (Fortune 500 HQ in TX)
| Industry | F500 HQs | Revenue |
|---|---|---|
| Energy | 16 | $1,198B |
|
||
| Technology | 5 | $198B |
|
||
| Engineering / Construction | 4 | $72B |
|
||
| Energy Services | 3 | $60B |
|
||
| Utilities | 3 | $41B |
|
||
| Healthcare | 2 | $330B |
|
||
Price history
3 events — show timeline
- 2026-05-14 Pending — HARMLS
- 2026-05-12 Listed $140,000 HARMLS
- 1991-07-28 Sold (Public Records) — Public Records
Property tax history
+9.9%/yrLatest (2025): $3,061 · +1.0% YoY. Source: county tax records.
Cash-flow waterfall
monthlySold comps — $/sqft
last 12 mo · ≤1 miLoading sold comps…