128 Amadeus Dr · Cordova, SC
Flood risk No data
- FEMA flood zone
- —
- Chance of flooding over 30 yrs
- —
- Est. flood insurance / yr
- —
Fire risk No data
- Est. fire insurance / yr
- —
Heat risk No data
- Hot days now (above threshold)
- —
- Hot days in 30 yrs
- —
Wind risk No data
- Chance of severe wind over 30 yrs
- —
Air-quality risk No data
- Unhealthy air days now
- —
- Unhealthy air days in 30 yrs
- —
Risk factors via First Street. Map © Google.
Why this score? — see what drove the B+ grade
The composite is a weighted blend of 9 inputs, each scored 0–100. Each bar is that input's sub-score; the figure is the points it added to the 100-point composite (weight × sub-score).
- Cash flow +30.0/30.0
- 1% rule +10.0/10.0
- DSCR +10.0/10.0
- Appreciation +8.0/10.0
- ARV discount +7.5/15.0
- Schools +5.0/10.0
- Livability +3.0/5.0
- Rent growth +2.5/5.0
- Condition / age +2.2/5.0
$50,000
🖨 Deal sheet 📄 Offer letter ✓ Due diligence
Listing remarks
INVESTMENT OPPORTUNITY, Tenants in place, AS IS WHERE IS. Current rent $600/month.
Key facts
- 0.52 acre lot
- Built 1997
- Listed 16 days
Property features AI
Exterior
- Utilities: Septic tank
- Home design: Manufactured / Mobile Home; Residential property
- Construction: Aluminum skirting
- Exterior features: Lot between 0.5 and 1 acre
Interior
- Bedrooms: 3 bedrooms
- Bathrooms: 2 bathrooms
- Interior features: No other structures on the property
Neighborhood map
What this means for you Summary
Snapshot
- This is a 3-bed/2.0-bath manufactured listed at $50k. Condition is rated fair.
Deal economics
- At list price, monthly cash flow is $499 ($6k/yr) — positive.
- The deal already cash-flows at list — no discount required.
- Meets the 1% rule at list price ($1k rent vs $50k).
- Recommended offer: $49k (1.5% below list) — sets the bar for market timing.
Location & tenants
- Location reads 60/100 on livability (#230 in SC) — a middle-class / working-renter tenant base. Strengths: cost of living A+; Watch: health & safety C-, crime F, amenities F.
- Zoned schools: Edisto Primary (554 students, 100% FRL); Carver Edisto Middle (math 12%, 515 students, 100% FRL); Edisto High (math 24%, 677 students, 100% FRL).
- Market conditions: 15 active listings in the ZIP; 87 units permitted in Orangeburg County in 2024 (0 in 5+ unit buildings).
Forward outlook
- In year one you build about $3k of equity ($346 loan paydown + $3k appreciation (6.0% local appreciation)).
- Orangeburg County population projected at -27% by 2050 — secular population decline; favor cash flow + early exit over multi-decade hold.
- At projected returns (6.0% appreciation + 3.0% rent growth), your $14k cash investment doubles in ~2 years — after that, you're playing with house money.
- By year 9, paydown + projected appreciation supports a ~$30k cash-out refi (75% LTV) — recoverable capital for the next deal without selling this one.
Negotiation context
- It's been on market 17 days — a 2% lower offer ($49k) is reasonable based on typical stale-listing flexibility.
Questions for the listing agent
- Have any recent inspections been done? Can we get a copy of the seller's disclosures and any deferred-maintenance estimates?
- Is there a deadline driving the sale (1031 exchange, divorce, estate, relocation)? That informs how much negotiation room exists.
- Schools are D-rated, which usually means shorter tenancies and higher turnover. Who's the typical renter profile here, and what's been the actual vacancy rate?
- Crime grade is F in this area — have there been break-ins, vandalism, or insurance claims at this property in the last 3 years? What carrier currently insures it and at what premium?
- What's the average days-on-market for RENTAL listings here right now (not sales)? A rising rental-DOM trend means longer vacancies and softer asking-rent achievability than the comps imply.
- What's the recent tenant-quality profile in this submarket — average credit score on applications, eviction rate, late-payment / NSF rate, and stable-employment percentage? A property-management company in the area should have these aggregated.
- How much new for-sale + rental construction is in the pipeline within 1–3 miles? Heavy new supply typically softens prices + rents 12–24 months out; constrained supply supports both.
Investment metrics
- 1% rule
- 2.14% ✓
- Cap rate
- 18.28%
- Cash-on-cash
- 42.80%
- DSCR
- 2.90
- GRM
- 3.9
CMA / ARV
No comps found within radius.
Projected returns pro-forma
6.04% appreciation · 3.0% rent growth · sell at horizon
- IRR
- 52.3%
- Equity multiple
- 4.31×
- Total profit
- $46,376
- Equity at exit
- $31,556
- IRR
- 49.2%
- Equity multiple
- 8.96×
- Total profit
- $111,507
- Equity at exit
- $57,334
Cash invested: $14,000 (down + closing). Projections, not guarantees.
Landlord ↔ Tenant lean methodology
- Overall (STATE)
- 90 Strongly Landlord-Friendly
- State South Carolina
- 90 Strongly Landlord-Friendly · R+6
- County
- — inherits STATE
- City
- — inherits STATE
ZIP-level market 29039
- Home prices YoY
- 4.0%
- Active inventory
- 15
- Price-to-rent
- 3.9×
Monthly cashflow live
- Estimated rent
- $1,070 medium interval (Pro) →
- Mortgage (P&I)
- −$262
- Tax est. 1.5%
- −$62 /mo · $750/yr
- Insurance
- −$21
- HOA
- −$0
- Vacancy / Maint / Mgmt
- −$225
- Net cashflow
- $499
Break-even live
UW: 25.0% down · 7.5% · 30yr · 1.5% tax · 5.0% vac · 8.0% maint · 8.0% mgmt
Financing live
Cash to close
- Down payment
- $12,500
- Closing costs
- $1,500
- Reserves months
- —
- Total cash needed
- —
Loan-product check · same deal, 3 products live
Conventional
25% down · 7.5% · 30yr
- Down + closing
- —
- Monthly P&I
- —
- Monthly cashflow
- —
- DSCR
- —
- Eligible?
- —
Personal DTI + credit; lowest rate.
DSCR
20% down · 8.5% · 30yr
- Down + closing
- —
- Monthly P&I
- —
- Monthly cashflow
- —
- DSCR
- —
- Eligible?
- —
No personal income docs; deal must DSCR.
Hard money
10% down · 12.0% · 12mo
- Down + closing
- —
- Monthly P&I
- —
- Monthly cashflow
- —
- DSCR
- —
- Eligible?
- —
Short-term bridge; refi at stabilization.
Listing history 13 events
-
2026-06-19days on market $50,000 Active 17 DOM
-
2026-06-18days on market $50,000 Active 16 DOM
-
2026-06-17days on market $50,000 Active 15 DOM
-
2026-06-16days on market $50,000 Active 14 DOM
-
2026-06-15days on market $50,000 Active 13 DOM
-
2026-06-14days on market $50,000 Active 11 DOM
-
2026-06-12days on market $50,000 Active 10 DOM
-
2026-06-09days on market $50,000 Active 7 DOM
-
2026-06-08days on market $50,000 Active 6 DOM
-
2026-06-07days on market $50,000 Active 5 DOM
-
2026-06-07days on market $50,000 Active 4 DOM
-
2026-06-03remarks 82-char remark
-
2026-06-03$50,000 Active 1 DOM
ⓘ Source: listings_history table (triggers on properties + properties_extension) + one-shot
backfill from property_details.listing_events for pre-trigger history.
Nearby sold comps map
Loading sold comps map…
Walkable amenities ~0.75 mi
Loading nearby amenities…
Taxation est. · year 1
- Rental income
- $12,834
- − Mortgage interest
- −$2,801
- − Property taxes
- −$750
- − Insurance
- −$250
- − Repairs & maintenance
- −$1,027
- − Management
- −$1,027
- − Depreciation
- −$1,455
- Taxable income
- $5,526
- Est. tax owed @ 24.0%
- −$1,326
- After-tax cash flow
- $4,667/yr
For passive investors: Depreciation is non-cash, so a rental often shows a tax loss while cash-flowing — sheltering income. Rental losses are passive: they offset passive income freely, and up to $25,000/yr can offset ordinary (W-2) income if you actively participate and your MAGI is under $100k (phasing out to $0 by $150k); unused losses carry forward. On sale, claimed depreciation is recaptured at up to 25%, and gains may owe capital-gains tax (a 1031 exchange can defer both). Figures are a year-1 estimate at your 24.0% rate — not tax advice; consult a CPA.
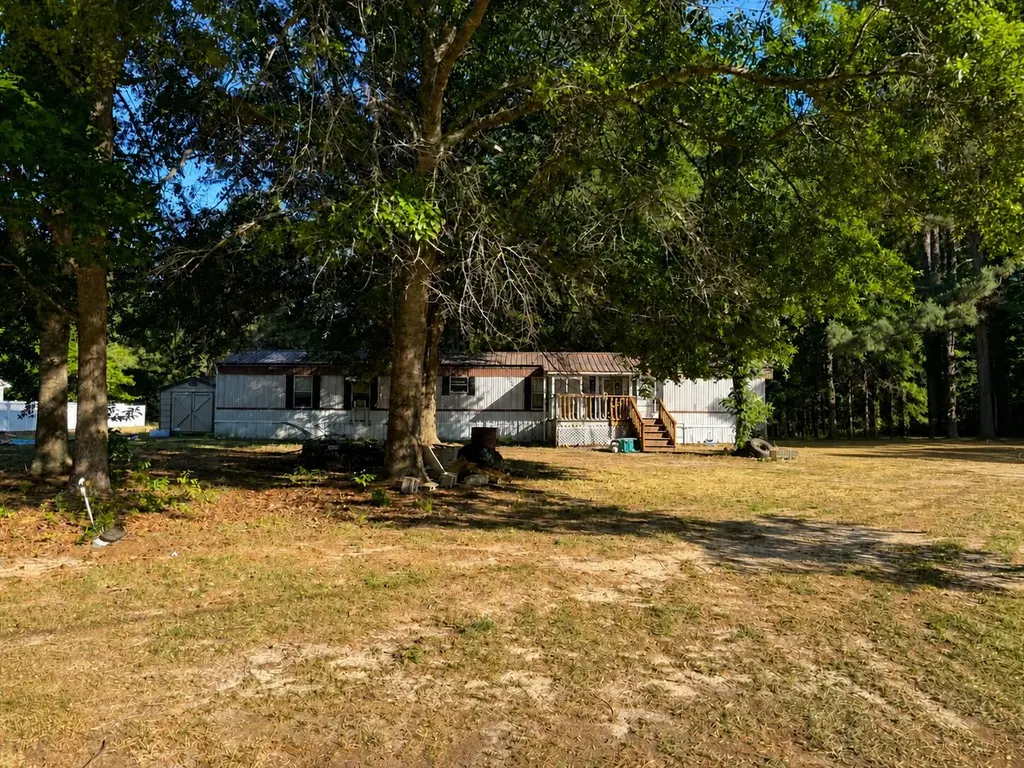
Condition & rehab AI · 4 photos
The home is in fair condition with significant repairs and maintenance needed, including roof repair, exterior work, and landscaping. These updates would significantly increase its resale and rental value.
Repairs flagged
- Major roof — The satellite image shows visible damage and missing shingles.
- Major exterior — The satellite image shows a mobile home with visible wear and tear, and the listing photo shows a lack of landscaping and fencing.
- Major landscaping — The satellite image shows a lack of landscaping and fencing, and the listing photo shows a lack of landscaping and fencing.
- Major fencing — The satellite image shows a lack of landscaping and fencing, and the listing photo shows a lack of landscaping and fencing.
Value-add opportunities
- Both landscaping and fencing — Landscaping and fencing can improve the curb appeal and increase both resale and rental value.
- Both paint — Painting the exterior can improve the home's appearance and increase both resale and rental value.
- Both roof repair — Repairing the roof can improve the home's structural integrity and increase both resale and rental value.
Renovation cost estimate screening
| Repair item | Severity | Est. cost |
|---|---|---|
| roof · The satellite image shows visible damage and missing shingles. | Major | $15,000–50,000 |
| exterior · The satellite image shows a mobile home with visible wear and tear, and the listing photo shows a lack of landscaping and fencing. | Major | $15,000–50,000 |
| landscaping · The satellite image shows a lack of landscaping and fencing, and the listing photo shows a lack of landscaping and fencing. | Major | $15,000–50,000 |
| fencing · The satellite image shows a lack of landscaping and fencing, and the listing photo shows a lack of landscaping and fencing. | Major | $15,000–50,000 |
| Total estimated repair cost · 4 items | $60,000–200,000 |
Value-add ROI direction
- Both landscaping and fencing — Landscaping and fencing can improve the curb appeal and increase both resale and rental value. ↑
- Both paint — Painting the exterior can improve the home's appearance and increase both resale and rental value. ↑
- Both roof repair — Repairing the roof can improve the home's structural integrity and increase both resale and rental value. ↑
ⓘ Cost ranges are severity-bucket heuristics (US national rule-of-thumb). Get contractor quotes + a written scope before underwriting a rehab budget.
Schools (NCES district)
No district data.
Livability — Cordova
- Score
- 60/100
- State rank
- #230
- US rank
- #19531
Category grades
Schools grade is shown separately in the Schools card above.
Census & demographics
- Population (ZIP)
- 3,008
Population outlook (Orangeburg County) Hauer SSP2
- Today (2025)
- 82,698 people
- By 2030
- 78,615 · -4.9%
- By 2040
- 69,308 · -16.2%
- By 2050
- 60,629 · -26.7%
- By 2075
- 42,678 · -48.4%
- By 2100
- 28,136 · -66.0%
Race, ethnicity, and origin ACS 2023
- Neighborhood character
- Diverse neighborhood (Simpson 0.57)
- Race & ethnicity
- Black 52% White 40% Hispanic / Latino 6% Two or more races 4%
- Hispanic origin (detail)
- Mexican 6%
- Common ancestry
- Portuguese 1% Italian 1% Lithuanian 1%
- Foreign-born
- 2% · Canada
- Languages at home
- 98% English-only · Spanish 2%
Political lean MEDSL · Orangeburg
- 2024 margin
- Strong D (+24.6) · D 61.8% · R 37.2% · Other 1.1%
- 2008→2024 swing
- -13.5pp toward R · 2008: 38.1pp · 2024: 24.6pp
- All cycles
- 2024: D+24.6 2020: D+33.2 2016: D+37.0 2012: D+43.5 2008: D+38.1
Not yet ingested
- Civics
- —
Market trends
- HPI YoY
- ▲ 6.04%
- Current HPI
- 158.3882
- Rent YoY
- —
- Metro
- —
- State GDP YoY
- ▲ 4.51%
- F500 in state
- 2
Industry mix (Fortune 500 HQ in SC)
| Industry | F500 HQs | Revenue |
|---|---|---|
| Packaging | 1 | $7B |
|
||
Price history
1 event — show timeline
- 2026-05-03 Listed $50,000 Charleston Trident MLS
Cash-flow waterfall
monthlySold comps — $/sqft
last 12 mo · ≤1 miLoading sold comps…