1622 Acre Cir · Upper Grand Lagoon, FL
Flood risk 4/10 · Minor
- FEMA flood zone
- X (unshaded)
- Chance of flooding over 30 yrs
- 0.22%
- Est. flood insurance / yr
- $507 – $1,088
Fire risk 5/10 · Moderate
- Est. fire insurance / yr
- $947 – $1,759
Heat risk 10/10 · Severe
- Hot days now (above 106°F)
- 7 days/yr
- Hot days in 30 yrs
- 21 days/yr
Wind risk 9/10 · Severe
- Chance of severe wind over 30 yrs
- 99.0%
Air-quality risk 1/10 · Minimal
- Unhealthy air days now
- 0 days/yr
- Unhealthy air days in 30 yrs
- 0 days/yr
Risk factors via First Street. Map © Google.
Why this score? — see what drove the D+ grade
The composite is a weighted blend of 9 inputs, each scored 0–100. Each bar is that input's sub-score; the figure is the points it added to the 100-point composite (weight × sub-score).
- Cash flow +21.8/30.0
- DSCR +7.0/10.0
- 1% rule +5.7/10.0
- Schools +4.3/10.0
- Livability +3.4/5.0
- Condition / age +2.5/5.0
- Rent growth +2.4/5.0
- ARV discount +0.0/15.0
- Appreciation +0.0/10.0
$160,000
🖨 Deal sheet 📄 Offer letter ✓ Due diligence
Listing remarks
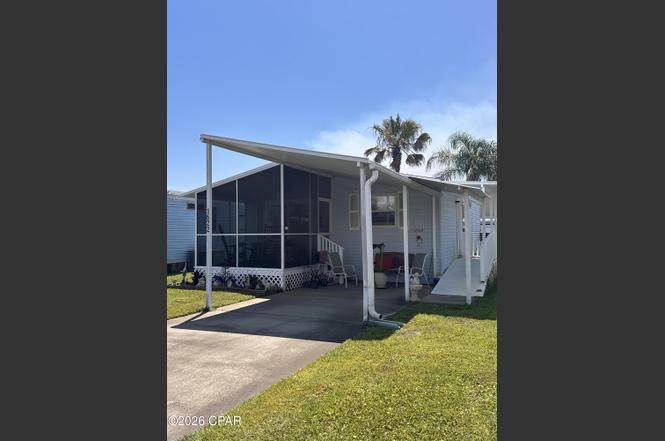
Just minutes to the beach. 55+ community. Monthly HOA payment covers Xfinity Wi-fi and basic cable, water, sewage, garbage, yard maintenance, pool and clubhouse maintenance. There is also a gated RV/Boat storage area. No lot rent since you own the land! This property offers a convenient location, close proximity to the beach, and a low-maintenance lifestyle. Screened in front porch and covered carport. Wheelchair accessible. Located within close proximity of shopping, dinging, and local attractions, making this property an excellent value. Short-term rentals are not allowed. Schedule your showing today.
Key facts
- Covered carport
- Convenient location
- 2,614 sq ft lot
Tags
Property features AI
Finance
- HOA & community: Property is part of a homeowners association; Community pool included
Exterior
- Utilities: Electricity available; Sewer available; Phone service available
- Home design: Single-family property
- Exterior features: Community pool; Lot dimensions approximately 35 ft x 80 ft
Interior
- Bedrooms: One first-floor bedroom (10 x 12)
- Bathrooms: 2 full bathrooms
- Interior features: Living room; Total of 2 rooms
Neighborhood map
What this means for you Summary
Snapshot
- This is a 2-bed/2.0-bath manufactured listed at $160k.
Deal economics
- At list price, monthly cash flow is $250 ($3k/yr) — positive.
- The deal already cash-flows at list — no discount required.
- Meets the 1% rule at list price ($2k rent vs $160k).
- Cap rate 8.2% vs local median 3.2% in Upper Grand Lagoon — top-decile yield for the area; either an underpriced asset or a hidden risk that comps aren't pricing in. Stress-test before assuming the spread holds.
Location & tenants
- Location reads 67/100 on livability (#583 in FL) — a middle-class / working-renter tenant base. Strengths: housing A+, crime A, cost of living B+; Watch: schools D, amenities F, commute F.
- Bay (suburban): math 51% / reading 51% proficiency, ranked #29 of 73 in FL (top 40%) — acceptable for families but not a draw, mixed tenant base, ~2y average lease.
- Market conditions: Rents soft (-0.2%/yr); 702 active listings in the ZIP; 12 comparable units currently listed for rent nearby; rentals leasing fast (median 13d on market — plan ~1-2 weeks tenant-placement turnaround); solid renter incomes; 2,473 units permitted in Bay County in 2024 (559 in 5+ unit buildings).
Forward outlook
- Local home prices are declining (-3.0%/yr); year-one equity from $1k of loan paydown is wiped out by about $5k of value loss. Plan a longer hold.
- Bay County population projected at +24% by 2050 — long-run rental-demand tailwind backs the buy-and-hold thesis.
Negotiation context
- Only 9 days on market — expect competitive offers; lowballing is unlikely to land.
- 5 sale attempts since 16y ago with the ask held roughly flat each time — persistent listings suggest the price (not the market) is what's stuck; bring a comps-based counter.
- Current owner paid $72k; list at $160k implies a 121% gain — meaningful room to come down on a strong offer.
Risks & watch-outs
- Climate carrying-cost: severe wind risk, 99% chance of damaging wind over 30y; moderate wildfire risk; extreme-heat days projected 7→21/yr by 2055 (HVAC capex compounding) — expect insurance premiums to compound above CPI over the hold.
Questions for the listing agent
- Is there a deadline driving the sale (1031 exchange, divorce, estate, relocation)? That informs how much negotiation room exists.
- Schools are D-rated, which usually means shorter tenancies and higher turnover. Who's the typical renter profile here, and what's been the actual vacancy rate?
- The area grade is low — what's the realistic commute time and amenity access for the typical tenant pool here? Any planned neighborhood developments (good or bad) we should know about?
- What's the average days-on-market for RENTAL listings here right now (not sales)? A rising rental-DOM trend means longer vacancies and softer asking-rent achievability than the comps imply.
- What's the recent tenant-quality profile in this submarket — average credit score on applications, eviction rate, late-payment / NSF rate, and stable-employment percentage? A property-management company in the area should have these aggregated.
- How much new for-sale + rental construction is in the pipeline within 1–3 miles? Heavy new supply typically softens prices + rents 12–24 months out; constrained supply supports both.
Investment metrics
- 1% rule
- 1.07% ✓
- Cap rate
- 8.17%
- Cash-on-cash
- 6.69%
- DSCR
- 1.30
- GRM
- 7.8
CMA / ARV
- ARV (on-the-fly)
- $124,416
- Comps found
- 1
Show comp detail 1 sale within ~0.75 mi
| Address | Dist | Beds/Ba | Sqft | Sold | Price | $/sf | Match |
|---|---|---|---|---|---|---|---|
| 9229 Widener St | 0.52mi | 2/2.0 | 936 (+8%) | 23mo | $135,000 | $144 | 42 |
Match score weights: distance 35% · size 25% · config 20% · recency 20%. Top-matched comps best support the ARV.
Projected returns pro-forma
-3.0% appreciation · 0.0% rent growth · sell at horizon
- IRR
- -9.4%
- Equity multiple
- 0.66×
- Total profit
- $-15,023
- Equity at exit
- $23,857
- IRR
- -4.7%
- Equity multiple
- 0.73×
- Total profit
- $-11,926
- Equity at exit
- $13,834
Cash invested: $44,800 (down + closing). Projections, not guarantees.
Landlord ↔ Tenant lean methodology
- Overall (STATE)
- 87 Strongly Landlord-Friendly
- State Florida
- 87 Strongly Landlord-Friendly · R+3
- County
- — inherits STATE
- City
- — inherits STATE
ZIP-level market 32407
- Home prices YoY
- -29.5%
- Rents YoY
- -0.2%
- Active inventory
- 702
- Price-to-rent
- 7.8×
Monthly cashflow live
- Estimated rent
- $1,716 high interval (Pro) →
- Mortgage (P&I)
- −$839
- Tax est. 1.5%
- −$200 /mo · $2,400/yr
- Insurance
- −$67
- HOA
- −$0
- Vacancy / Maint / Mgmt
- −$360
- Net cashflow
- $250
Break-even live
UW: 25.0% down · 7.5% · 30yr · 1.5% tax · 5.0% vac · 8.0% maint · 8.0% mgmt
Financing live
Cash to close
- Down payment
- $40,000
- Closing costs
- $4,800
- Reserves months
- —
- Total cash needed
- —
Loan-product check · same deal, 3 products live
Conventional
25% down · 7.5% · 30yr
- Down + closing
- —
- Monthly P&I
- —
- Monthly cashflow
- —
- DSCR
- —
- Eligible?
- —
Personal DTI + credit; lowest rate.
DSCR
20% down · 8.5% · 30yr
- Down + closing
- —
- Monthly P&I
- —
- Monthly cashflow
- —
- DSCR
- —
- Eligible?
- —
No personal income docs; deal must DSCR.
Hard money
10% down · 12.0% · 12mo
- Down + closing
- —
- Monthly P&I
- —
- Monthly cashflow
- —
- DSCR
- —
- Eligible?
- —
Short-term bridge; refi at stabilization.
Rent comps 12 comps
| Address | Beds | Baths | Sqft | Rent | $/sqft | DOM | Units | Dist |
|---|---|---|---|---|---|---|---|---|
| 8551 Panama City Beach Pkwy Panama City Beach, FL | 1.0–3.0 | 1.0–2.0 | 964 | $1,792 | $1.86 | 13d | 12 | 0.20mi |
| 8604 Whelch Dr Panama City, FL | 1.0–3.0 | 1.0–3.0 | 1087 | $2,250 | $2.07 | 13d | 18 | 0.37mi |
| 2216 Anne Ave Panama City, FL | 2.0 | 2.0 | 951 | $1,300 | $1.37 | 13d | 1 | 0.56mi |
| 2301 Anne Ave Unit 8901 Laird Panama City, FL | 2.0 | 2.0 | 900 | $1,625 | $1.81 | 13d | 1 | 0.60mi |
| 2526 Laurie Ave Panama City, FL | 2.0 | 2.0 | 950 | $1,750 | $1.84 | 13d | 1 | 0.67mi |
| 2195 Wilkinson St Panama City, FL | 1.0–3.0 | 1.0–2.0 | 1017 | $1,940 | $1.91 | 13d | 41 | 0.77mi |
| 2521 Allison Ave Panama City, FL | 2.0 | 2.0 | 980 | $1,450 | $1.48 | 20d | 1 | 0.84mi |
| 204 Potters Bluff Dr Panama City Beach, FL | 1.0–3.0 | 1.0–2.0 | 1035 | $1,651 | $1.60 | 13d | 12 | 1.12mi |
| 8730 Thomas Dr Unit 1355041P Panama City Beach, FL | 1.0 | 1.0 | 839 | $1,373 | $1.64 | 20d | 1 | 1.26mi |
| 10400 Panama City Beach Pkwy Panama City Beach, FL | 1.0–3.0 | 1.0–2.0 | 1151 | $1,890 | $1.64 | 13d | 20 | 1.36mi |
| 9850 S Thomas Dr Unit 1 Panama City Beach, FL | 1.0 | 1.0 | 700 | $2,750 | $3.93 | 20d | 1 | 1.46mi |
| 9850 S Thomas Dr Unit 1355022P Panama City Beach, FL | 1.0 | 1.0 | 602 | $1,639 | $2.72 | 13d | 1 | 1.46mi |
Listing history 8 events
-
2026-06-19days on market $160,000 Active 9 DOM
-
2026-06-18days on market $160,000 Active 8 DOM
-
2026-06-17days on market $160,000 Active 7 DOM
-
2026-06-16days on market $160,000 Active 6 DOM
-
2026-06-15days on market $160,000 Active 5 DOM
-
2026-06-14days on market $160,000 Active 3 DOM
-
2026-06-13remarks 611-char remark
-
2026-06-13$160,000 Active 2 DOM
ⓘ Source: listings_history table (triggers on properties + properties_extension) + one-shot
backfill from property_details.listing_events for pre-trigger history.
Climate risk First Street
- Flood 4/10 Moderate FEMA zone X (unshaded) · 22% chance over 30 yrs
- Wildfire 5/10 Major
- Heat 10/10 Extreme 7 d/yr ≥106°F today · 21 d/yr by 30 yrs out
- Wind 9/10 Extreme 99% chance of damaging wind over 30 yrs
- Air quality 1/10 Low 0 unhealthy d/yr today · 0 by 30 yrs out
Nearby sold comps map
Loading sold comps map…
Walkable amenities ~0.75 mi
Loading nearby amenities…
Taxation est. · year 1
- Rental income
- $20,589
- − Mortgage interest
- −$8,962
- − Property taxes
- −$2,400
- − Insurance
- −$800
- − Repairs & maintenance
- −$1,647
- − Management
- −$1,647
- − Depreciation
- −$4,655
- Taxable income
- $478
- Est. tax owed @ 24.0%
- −$115
- After-tax cash flow
- $2,882/yr
For passive investors: Depreciation is non-cash, so a rental often shows a tax loss while cash-flowing — sheltering income. Rental losses are passive: they offset passive income freely, and up to $25,000/yr can offset ordinary (W-2) income if you actively participate and your MAGI is under $100k (phasing out to $0 by $150k); unused losses carry forward. On sale, claimed depreciation is recaptured at up to 25%, and gains may owe capital-gains tax (a 1031 exchange can defer both). Figures are a year-1 estimate at your 24.0% rate — not tax advice; consult a CPA.
Schools (NCES district)
- District
- Bay
- NCES district ID
- 1200090
- Math proficiency
- 51% ▼ -8.00%
- Reading proficiency
- 51% ▼ -7.00%
- Median HH income
- $47,740
- Composite
- 43.41/100
- National rank
- #3014
- State rank
- #29 of 73 in FL
Livability — Upper Grand Lagoon
- Score
- 67/100
- State rank
- #583
- US rank
- #11085
Category grades
Schools grade is shown separately in the Schools card above.
Census & demographics
- Census place
- Upper Grand Lagoon, FL
- County
- Bay County · 163,593 people
- City population
- 18,326
- Metro
- Panama City, FL
- Population (ZIP)
- 16,404
- Household income
- $80,831
- Rent vs Own
- Severe rent burden
- 939.0
Population outlook (Bay County) Hauer SSP2
- Today (2025)
- 206,264 people
- By 2030
- 217,740 · +5.6%
- By 2040
- 238,738 · +15.7%
- By 2050
- 255,545 · +23.9%
- By 2075
- 288,295 · +39.8%
- By 2100
- 288,638 · +39.9%
Race, ethnicity, and origin ACS 2023
- Neighborhood character
- Predominantly White (73%)
- Race & ethnicity
- White 73% Black 10% Two or more races 9% Hispanic / Latino 8% Asian 2%
- Hispanic origin (detail)
- Mexican 2% Puerto Rican 2%
- Common ancestry
- Lithuanian 4% Italian 3% Portuguese 2%
- Foreign-born
- 12% · Canada, Jamaica, South Korea
- Languages at home
- 89% English-only · Spanish 6% Other Indo-European 1% Russian/Polish/Slavic 1%
Political lean MEDSL · Bay
- 2024 margin
- Solid R (+47.4) · D 25.8% · R 73.1% · Other 1.1%
- 2008→2024 swing
- -6.6pp toward R · 2008: -40.7pp · 2024: -47.4pp
- All cycles
- 2024: R+47.4 2020: R+43.5 2016: R+46.3 2012: R+43.6 2008: R+40.7
Not yet ingested
- Civics
- —
Market trends
- HPI YoY
- ▼ -116.39%
- Current HPI
- 277.8875
- Rent YoY
- ▼ -0.25%
- Metro
- Panama City, FL
- State GDP YoY
- ▲ 3.28%
- F500 in state
- 36
Industry mix (Fortune 500 HQ in FL)
| Industry | F500 HQs | Revenue |
|---|---|---|
| Industrial Technology | 2 | $29B |
|
||
| Insurance | 2 | $17B |
|
||
| Retail | 1 | $60B |
|
||
| Technology Distribution | 1 | $58B |
|
||
| Homebuilding | 1 | $35B |
|
||
| Technology Manufacturing | 1 | $35B |
|
||
Price history
+167.1% since first listed11 events — show timeline
- 2026-06-10 Listed $160,000 CPARMLS
- 2025-06-25 Relisted — CPARMLS
- 2025-06-25 Listing Removed — CPARMLS
- 2025-06-25 Listing Removed — CPARMLS
- 2025-06-19 Listed $140,000 CPARMLS
- 2021-12-14 Listing Removed — CPARMLS
- 2018-09-06 Sold (Public Records) $72,300 Public Records
- 2012-03-15 Sold (Public Records) $50,000 Public Records
- 2012-03-15 Sold (MLS) $50,000 CPARMLS
- 2011-10-07 Listed $59,900 CPARMLS
- 2010-01-26 Listed $59,900 CPARMLS
Property tax history
-12.3%/yrLatest (2025): $140 · +6.5% YoY. Source: county tax records.
Cash-flow waterfall
monthlySold comps — $/sqft
last 12 mo · ≤1 miLoading sold comps…