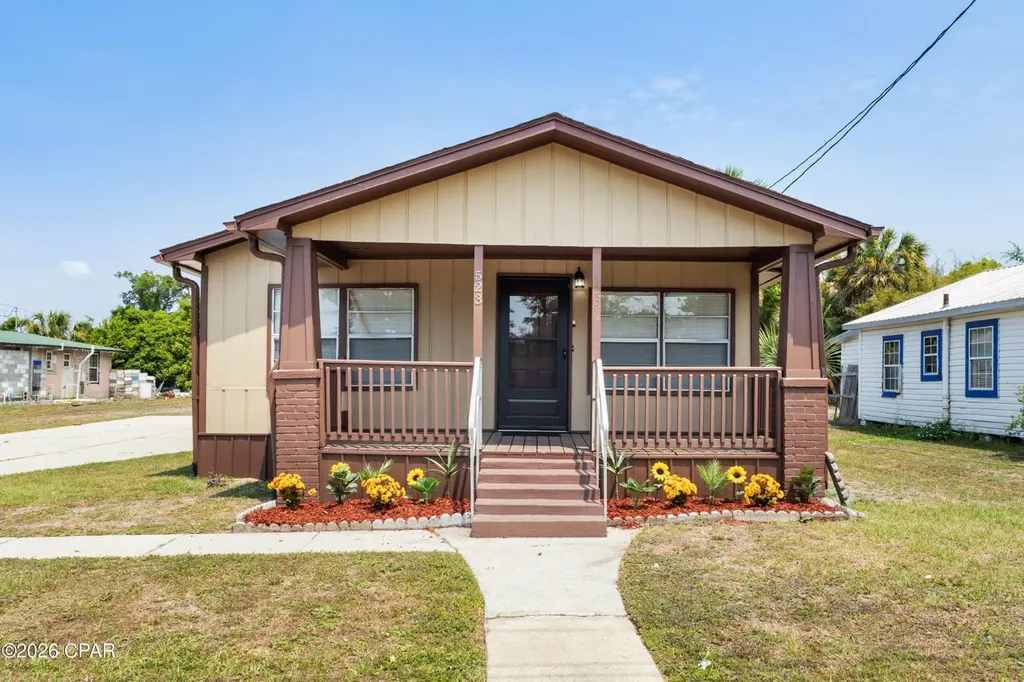
523 E 8th St · Panama City, FL
Flood risk 1/10 · Minimal
- FEMA flood zone
- X (unshaded)
- Chance of flooding over 30 yrs
- 0.0%
- Est. flood insurance / yr
- $507 – $1,088
Fire risk 1/10 · Minimal
- Est. fire insurance / yr
- $947 – $1,759
Heat risk 10/10 · Severe
- Hot days now (above 105°F)
- 7 days/yr
- Hot days in 30 yrs
- 21 days/yr
Wind risk 9/10 · Severe
- Chance of severe wind over 30 yrs
- 99.0%
Air-quality risk 1/10 · Minimal
- Unhealthy air days now
- 0 days/yr
- Unhealthy air days in 30 yrs
- 0 days/yr
Risk factors via First Street. Map © Google.
Why this score? — see what drove the C+ grade
The composite is a weighted blend of 9 inputs, each scored 0–100. Each bar is that input's sub-score; the figure is the points it added to the 100-point composite (weight × sub-score).
- Cash flow +22.2/30.0
- ARV discount +12.7/15.0
- DSCR +7.1/10.0
- 1% rule +5.0/10.0
- Schools +4.3/10.0
- Livability +3.6/5.0
- Rent growth +2.6/5.0
- Condition / age +2.5/5.0
- Appreciation +0.0/10.0
$189,900
🖨 Deal sheet 📄 Offer letter ✓ Due diligence
Listing remarks
Great Investment Opportunity or Starter Home! This 3 bedroom, 2 bath home offers 1,304 sq ft on a . 25 acre lot in Panama City, just minutes from downtown, the hospital, shopping, and dining. Recently updated with a new AC system, refreshed showers, and newer appliances, this property is move in ready with key improvements already completed. Inside features durable wood look flooring, an open living area, and a functional kitchen with a center island. Enjoy a covered front porch, ample parking, and a storage shed, adding convenience and extra value. Ideal for a long term rental, primary residence, or portfolio addition in a centrally located area with strong demand.
Key facts
- Wood look flooring
- Functional kitchen
- Refreshed showers
Tags
Property features AI
Finance
- HOA & community: Short-term rentals allowed
Exterior
- Utilities: Public sewer
- Home design: Single-story property; Entry level: First floor
- Construction: HardiPlank-type siding; Composition/shingle roof
- Exterior features: Covered patio and porch; Porch; Shed(s); Paved lot; City street frontage; Publicly maintained road
Interior
- Kitchen: Convection oven; Electric cooktop
- Bedrooms: Two bedrooms on the first floor (approx. 11.75 x 11.83 and 12 x 11.5)
- Flooring: Luxury vinyl plank
- Bathrooms: One full bathroom; One half bathroom
- Heating & cooling: Central heating; Central air
- Interior features: Luxury vinyl plank flooring; Ceiling fan(s)
- Laundry & utility: Electric water heater
Neighborhood map
What this means for you Summary
Snapshot
- This is a 3-bed/2.0-bath single-family listed at $190k.
Deal economics
- At list price, monthly cash flow is $311 ($4k/yr) — positive.
- The deal already cash-flows at list — no discount required.
- To meet the 1% rule (rent ≥ 1% of price), the offer needs to be $189k (0.3% below list).
- Recommended offer: $184k (3.0% below list) — sets the bar for market timing.
- Cap rate 8.3% vs local median 4.7% in Panama City — top-decile yield for the area; either an underpriced asset or a hidden risk that comps aren't pricing in. Stress-test before assuming the spread holds.
Location & tenants
- Location reads 72/100 on livability (#350 in FL) — a middle-class / working-renter tenant base. Strengths: cost of living A+, housing A+, health & safety A+; Watch: crime F, amenities F, commute F.
- Bay (suburban): math 51% / reading 51% proficiency, ranked #29 of 73 in FL (top 40%) — acceptable for families but not a draw, mixed tenant base, ~2y average lease.
- Market conditions: Rents flat; 258 active listings in the ZIP; 9 comparable units currently listed for rent nearby; rentals at typical pace (median 21d on market — plan ~3-4 weeks tenant-placement turnaround); 2,473 units permitted in Bay County in 2024 (559 in 5+ unit buildings).
- This rent runs 43% of the median local income ($53k/yr) — at the standard rent-burdened threshold; future hikes will face affordability resistance.
Forward outlook
- Local home prices are declining (-3.0%/yr); year-one equity from $1k of loan paydown is wiped out by about $6k of value loss. Plan a longer hold.
- Bay County population projected at +24% by 2050 — long-run rental-demand tailwind backs the buy-and-hold thesis.
Negotiation context
- It's been on market 57 days — a 3% lower offer ($184k) is reasonable based on typical stale-listing flexibility.
- 4 sale attempts since 16y ago; this cycle's ask is 11409% above the opening price — seller raised mid-cycle; expect resistance to lowballs.
Risks & watch-outs
- Watch-outs: built in 1945 — expect roof / HVAC / electrical / plumbing capex.
- Climate carrying-cost: severe wind risk, 99% chance of damaging wind over 30y; extreme-heat days projected 7→21/yr by 2055 (HVAC capex compounding) — expect insurance premiums to compound above CPI over the hold.
Questions for the listing agent
- It's been on market 57 days. Have you received any prior offers? Is the seller open to a 3% concession, seller financing, or rate buy-down credit?
- Built in 1945 — when were the roof, HVAC, electrical panel, plumbing, and water heater last replaced?
- Is there a deadline driving the sale (1031 exchange, divorce, estate, relocation)? That informs how much negotiation room exists.
- Schools are B-rated — typically a magnet for longer-tenancy family renters. What's the average tenant stay here, and is there a school-zone premium baked into asking?
- Crime grade is F in this area — have there been break-ins, vandalism, or insurance claims at this property in the last 3 years? What carrier currently insures it and at what premium?
- What's the average days-on-market for RENTAL listings here right now (not sales)? A rising rental-DOM trend means longer vacancies and softer asking-rent achievability than the comps imply.
- What's the recent tenant-quality profile in this submarket — average credit score on applications, eviction rate, late-payment / NSF rate, and stable-employment percentage? A property-management company in the area should have these aggregated.
- How much new for-sale + rental construction is in the pipeline within 1–3 miles? Heavy new supply typically softens prices + rents 12–24 months out; constrained supply supports both.
Investment metrics
- 1% rule
- 1.00% ✗
- Cap rate
- 8.26%
- Cash-on-cash
- 7.01%
- DSCR
- 1.31
- GRM
- 8.4
CMA / ARV
- ARV (median comp)
- $214,706
- List price
- $189,900
- Delta
- -11.55%
- Verdict
- UNDERPRICED
- Comps
- 20 within 1.0 mi
Show comp detail 5 sales within ~0.75 mi
| Address | Dist | Beds/Ba | Sqft | Sold | Price | $/sf | Match |
|---|---|---|---|---|---|---|---|
| 1009 Cone Ave | 0.33mi | 3/2.0 | 1,300 (-0%) | 15mo | $280,000 | $215 | 72 |
| 917 Hamilton Ave | 0.21mi | 3/2.0 | 1,158 (-11%) | 15mo | $205,500 | $177 | 59 |
| 1032 Jenks Ave | 0.63mi | 3/2.0 | 1,404 (+8%) | 10mo | $312,500 | $223 | 50 |
| 902 E 10th Ct | 0.47mi | 3/2.0 | 1,144 (-12%) | 15mo | $250,000 | $219 | 45 |
| 902 E 8th St | 0.35mi | 3/2.0 | 1,122 (-14%) | 24mo | $240,000 | $214 | 40 |
Match score weights: distance 35% · size 25% · config 20% · recency 20%. Top-matched comps best support the ARV.
Projected returns pro-forma
-3.0% appreciation · 0.45% rent growth · sell at horizon
- IRR
- -8.3%
- Equity multiple
- 0.70×
- Total profit
- $-15,772
- Equity at exit
- $28,315
- IRR
- -2.2%
- Equity multiple
- 0.87×
- Total profit
- $-6,929
- Equity at exit
- $16,419
Cash invested: $53,172 (down + closing). Projections, not guarantees.
Landlord ↔ Tenant lean methodology
- Overall (STATE)
- 87 Strongly Landlord-Friendly
- State Florida
- 87 Strongly Landlord-Friendly · R+3
- County
- — inherits STATE
- City
- — inherits STATE
ZIP-level market 32401
- Home prices YoY
- -32.9%
- Rents YoY
- 0.5%
- Active inventory
- 258
- Price-to-rent
- 8.4×
Monthly cashflow live
- Estimated rent
- $1,894 high interval (Pro) →
- Mortgage (P&I)
- −$996
- Tax from tax record
- −$110 /mo · $1,324/yr
- Insurance
- −$79
- HOA
- −$0
- Vacancy / Maint / Mgmt
- −$398
- Net cashflow
- $311
Break-even live
UW: 25.0% down · 7.5% · 30yr · 1.5% tax · 5.0% vac · 8.0% maint · 8.0% mgmt
Financing live
Cash to close
- Down payment
- $47,475
- Closing costs
- $5,697
- Reserves months
- —
- Total cash needed
- —
Loan-product check · same deal, 3 products live
Conventional
25% down · 7.5% · 30yr
- Down + closing
- —
- Monthly P&I
- —
- Monthly cashflow
- —
- DSCR
- —
- Eligible?
- —
Personal DTI + credit; lowest rate.
DSCR
20% down · 8.5% · 30yr
- Down + closing
- —
- Monthly P&I
- —
- Monthly cashflow
- —
- DSCR
- —
- Eligible?
- —
No personal income docs; deal must DSCR.
Hard money
10% down · 12.0% · 12mo
- Down + closing
- —
- Monthly P&I
- —
- Monthly cashflow
- —
- DSCR
- —
- Eligible?
- —
Short-term bridge; refi at stabilization.
Rent comps 9 comps
| Address | Beds | Baths | Sqft | Rent | $/sqft | DOM | Units | Dist |
|---|---|---|---|---|---|---|---|---|
| 540 E 4th Ct Panama City, FL | 2.0 | 2.0 | 1196 | $1,800 | $1.51 | 21d | 1 | 0.49mi |
| 1114 Mc Kenzie Ave Unit 1 Panama City, FL | 2.0 | 1.0 | 880 | $1,850 | $2.10 | 21d | 1 | 0.51mi |
| 329 N Palo Alto Ave Panama City, FL | 3.0 | 2.0 | 1300 | $1,950 | $1.50 | 13d | 1 | 0.73mi |
| 300 Mercedes Ave Unit 1523335P Panama City, FL | 3.0 | 2.0 | 1194 | $3,807 | $3.19 | 21d | 1 | 0.92mi |
| 603 E 2nd St Panama City, FL | 2.0 | 1.0 | 900 | $1,300 | $1.44 | 21d | 1 | 1.04mi |
| 265 15th St Panama City, FL | 1.0–3.0 | 1.0–2.0 | 967 | $1,462 | $1.51 | 13d | 4 | 1.05mi |
| 725 Sherman Ave Unit B Panama City, FL | 3.0 | 1.0 | 878 | $1,250 | $1.42 | 21d | 1 | 1.14mi |
| 1525 Oak Ave Panama City, FL | 3.0 | 1.5 | 1280 | $2,200 | $1.72 | 21d | 1 | 1.15mi |
| 2002 Wilson Ave Panama City, FL | 1.0–3.0 | 1.0–2.0 | 977 | $2,260 | $2.31 | 13d | 25 | 1.50mi |
Listing history 23 events
-
2026-06-19days on market $189,900 Active 57 DOM
-
2026-06-18days on market $189,900 Active 56 DOM
-
2026-06-17days on market $189,900 Active 55 DOM
-
2026-06-16days on market $189,900 Active 54 DOM
-
2026-06-15days on market $189,900 Active 53 DOM
-
2026-06-14days on market $189,900 Active 51 DOM
-
2026-06-13days on market $189,900 Active 50 DOM
-
2026-06-10pricedays on market $189,900 Active 48 DOM
-
2026-06-09days on market $199,900 Active 47 DOM
-
2026-06-08days on market $199,900 Active 46 DOM
-
2026-06-07days on market $199,900 Active 45 DOM
-
2026-06-05days on market $199,900 Active 42 DOM
-
2026-06-03days on market $199,900 Active 41 DOM
-
2026-06-02days on market $199,900 Active 40 DOM
-
2026-06-01days on market $199,900 Active 39 DOM
-
2026-05-31days on market $199,900 Active 38 DOM
-
2026-05-30days on market $199,900 Active 37 DOM
-
2026-04-29$1,650
-
2026-04-23$199,900 Active 675-char remark
-
2021-12-14historical
-
2021-12-14historical
-
2013-01-21$59,000
-
2010-07-29$68,000
ⓘ Source: listings_history table (triggers on properties + properties_extension) + one-shot
backfill from property_details.listing_events for pre-trigger history.
Tax reassessment forecast FL · Resets to sale price
- Current annual tax
- $1,324 · $110/mo
- Projected year-2 tax
- $1,576 · $131/mo
- Expected delta
- +$252/yr (+$21/mo · 19.0%)
ⓘ Screening estimate from a state-policy table — verify with the county assessor before closing.
Climate risk First Street
- Flood 1/10 Low FEMA zone X (unshaded) · 0% chance over 30 yrs
- Wildfire 1/10 Low
- Heat 10/10 Extreme 7 d/yr ≥105°F today · 21 d/yr by 30 yrs out
- Wind 9/10 Extreme 99% chance of damaging wind over 30 yrs
- Air quality 1/10 Low 0 unhealthy d/yr today · 0 by 30 yrs out
Nearby sold comps map
Loading sold comps map…
Walkable amenities ~0.75 mi
Loading nearby amenities…
Taxation est. · year 1
- Rental income
- $22,724
- − Mortgage interest
- −$10,637
- − Property taxes
- −$1,324
- − Insurance
- −$950
- − Repairs & maintenance
- −$1,818
- − Management
- −$1,818
- − Depreciation
- −$5,524
- Taxable income
- $653
- Est. tax owed @ 24.0%
- −$157
- After-tax cash flow
- $3,572/yr
For passive investors: Depreciation is non-cash, so a rental often shows a tax loss while cash-flowing — sheltering income. Rental losses are passive: they offset passive income freely, and up to $25,000/yr can offset ordinary (W-2) income if you actively participate and your MAGI is under $100k (phasing out to $0 by $150k); unused losses carry forward. On sale, claimed depreciation is recaptured at up to 25%, and gains may owe capital-gains tax (a 1031 exchange can defer both). Figures are a year-1 estimate at your 24.0% rate — not tax advice; consult a CPA.
Schools (NCES district)
- District
- Bay
- NCES district ID
- 1200090
- Math proficiency
- 51% ▼ -8.00%
- Reading proficiency
- 51% ▼ -7.00%
- Median HH income
- $47,740
- Composite
- 43.41/100
- National rank
- #3014
- State rank
- #29 of 73 in FL
Livability — Panama City
- Score
- 72/100
- State rank
- #350
- US rank
- #5823
Category grades
Schools grade is shown separately in the Schools card above.
Census & demographics
- Census place
- Panama City, FL
- County
- Bay County · 163,593 people
- City population
- 91,445
- Metro
- Panama City, FL
- Population (ZIP)
- 18,947
- Household income
- $52,523
- Rent vs Own
- Severe rent burden
- 935.0
Population outlook (Bay County) Hauer SSP2
- Today (2025)
- 206,264 people
- By 2030
- 217,740 · +5.6%
- By 2040
- 238,738 · +15.7%
- By 2050
- 255,545 · +23.9%
- By 2075
- 288,295 · +39.8%
- By 2100
- 288,638 · +39.9%
Race, ethnicity, and origin ACS 2023
- Neighborhood character
- Diverse neighborhood (Simpson 0.57)
- Race & ethnicity
- White 60% Black 23% Hispanic / Latino 11% Two or more races 8% Asian 2%
- Hispanic origin (detail)
- Mexican 5% Puerto Rican 2%
- Common ancestry
- Italian 2% Lithuanian 2% Slovak 2%
- Foreign-born
- 9% · Canada, Vietnam
- Languages at home
- 89% English-only · Spanish 8% Other Indo-European 1% German/W. Germanic 1%
Political lean MEDSL · Bay
- 2024 margin
- Solid R (+47.4) · D 25.8% · R 73.1% · Other 1.1%
- 2008→2024 swing
- -6.6pp toward R · 2008: -40.7pp · 2024: -47.4pp
- All cycles
- 2024: R+47.4 2020: R+43.5 2016: R+46.3 2012: R+43.6 2008: R+40.7
Not yet ingested
- Civics
- —
Market trends
- HPI YoY
- ▼ -142.12%
- Current HPI
- 290.3312
- Rent YoY
- ▲ 0.45%
- Metro
- Panama City, FL
- State GDP YoY
- ▲ 3.28%
- F500 in state
- 36
Industry mix (Fortune 500 HQ in FL)
| Industry | F500 HQs | Revenue |
|---|---|---|
| Industrial Technology | 2 | $29B |
|
||
| Insurance | 2 | $17B |
|
||
| Retail | 1 | $60B |
|
||
| Technology Distribution | 1 | $58B |
|
||
| Homebuilding | 1 | $35B |
|
||
| Technology Manufacturing | 1 | $35B |
|
||
Price history
+179.3% since first listed7 events — show timeline
- 2026-06-09 Price Changed $189,900 CPARMLS
- 2026-04-29 Listed for Rent $1,650 APPFOLIO
- 2026-04-23 Listed $199,900 CPARMLS
- 2021-12-14 Listing Removed — CPARMLS
- 2021-12-14 Listing Removed — CPARMLS
- 2013-01-21 Listed $59,000 CPARMLS
- 2010-07-29 Listed $68,000 CPARMLS
Property tax history
+5.7%/yrLatest (2025): $1,324 · +6.7% YoY. Source: county tax records.
Cash-flow waterfall
monthlySold comps — $/sqft
last 12 mo · ≤1 miLoading sold comps…