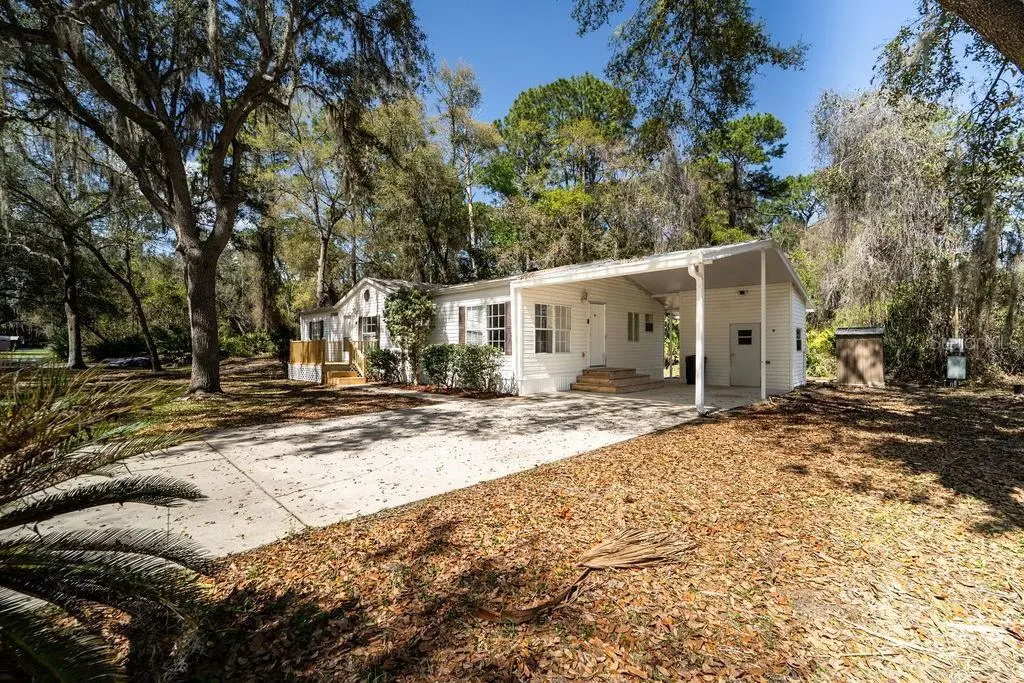
107 Golf Course Ln · Crescent City, FL
Flood risk 1/10 · Minimal
- FEMA flood zone
- X (unshaded)
- Chance of flooding over 30 yrs
- 0.0%
- Est. flood insurance / yr
- $507 – $1,088
Fire risk 4/10 · Minor
- Est. fire insurance / yr
- $947 – $1,759
Heat risk 8/10 · Major
- Hot days now (above 108°F)
- 7 days/yr
- Hot days in 30 yrs
- 21 days/yr
Wind risk 9/10 · Severe
- Chance of severe wind over 30 yrs
- 99.0%
Air-quality risk 3/10 · Minor
- Unhealthy air days now
- 3 days/yr
- Unhealthy air days in 30 yrs
- 3 days/yr
Risk factors via First Street. Map © Google.
Why this score? — see what drove the C- grade
The composite is a weighted blend of 9 inputs, each scored 0–100. Each bar is that input's sub-score; the figure is the points it added to the 100-point composite (weight × sub-score).
- Cash flow +21.0/30.0
- DSCR +6.7/10.0
- Appreciation +6.4/10.0
- 1% rule +4.5/10.0
- Schools +3.0/10.0
- Livability +2.9/5.0
- Rent growth +2.5/5.0
- Condition / age +2.5/5.0
- ARV discount +1.9/15.0
$180,000
🖨 Deal sheet 📄 Offer letter ✓ Due diligence
Listing remarks
Under contract-accepting backup offers. One or more photo(s) has been virtually staged. Step inside this charming 3 bedroom, 2 bathroom home! Nestled on over a quarter acre just steps from the Oaks Golf Club, this property offers a cozy, family friendly vibe with plenty of space to grow. The kitchen, with its generous storage and size, flows naturally into the living area and comes equipped with updated appliances, including a stainless steel refrigerator and range, a wine cooler, as well as a washer and dryer. The primary suite is your private retreat, ideal for relaxing mornings and easy evenings. Enjoy added peace of mind with major system updates, including an AC replaced in 2022 and se
Key facts
- Updated appliances
- Wine cooler
- Brand new roof
Tags
Neighborhood map
What this means for you Summary
Snapshot
- This is a 3-bed/2.0-bath manufactured listed at $180k.
Deal economics
- At list price, monthly cash flow is $253 ($3k/yr) — positive.
- The deal already cash-flows at list — no discount required.
- To meet the 1% rule (rent ≥ 1% of price), the offer needs to be $170k (5.5% below list).
- Recommended offer: $170k (5.5% below list) — sets the bar for 1% rule.
- Cap rate 8.0% vs local median 3.1% in Crescent City — top-decile yield for the area; either an underpriced asset or a hidden risk that comps aren't pricing in. Stress-test before assuming the spread holds.
Location & tenants
- Location reads 57/100 on livability (#857 in FL) — a working-class tenant base; expect higher turnover. Strengths: crime A+, cost of living A+; Watch: health & safety C-, amenities F, commute F.
- Putnam (town): math 34% / reading 39% proficiency, ranked #66 of 73 in FL (top 90%) — families likely to look elsewhere, expect single-tenant / working-renter base with shorter leases; 71% free/reduced lunch — lower-income household profile, screen leases tightly.
- Zoned schools: Middleton-Burney Elementary School (math 31% / reading 30%, grade F, #1,862 of 2,144 statewide, top 88%, 1,046 students, 70% FRL); Crescent City Jr-Sr High School (math 17% / reading 34%, grade F, #499 of 667 statewide, top 75%, 1,005 students, 72% FRL) — zoned schools at 71% FRL track the district average.
- Market conditions: 143 active listings in the ZIP; 113 units permitted in Putnam County in 2024 (0 in 5+ unit buildings).
Forward outlook
- In year one you build about $6k of equity ($1k loan paydown + $5k appreciation (2.9% local appreciation)).
- Putnam County population projected at -31% by 2050 — secular population decline; favor cash flow + early exit over multi-decade hold.
- At projected returns (2.9% appreciation + 3.0% rent growth), your $50k cash investment doubles in ~5 years — after that, you're playing with house money.
- By year 6, paydown + projected appreciation supports a ~$34k cash-out refi (75% LTV) — recoverable capital for the next deal without selling this one.
Negotiation context
- Only 12 days on market — expect competitive offers; lowballing is unlikely to land.
- Current owner paid $98k; list at $180k implies a 84% gain — meaningful room to come down on a strong offer.
Risks & watch-outs
- Climate carrying-cost: severe wind risk, 99% chance of damaging wind over 30y; extreme-heat days projected 7→21/yr by 2055 (HVAC capex compounding) — expect insurance premiums to compound above CPI over the hold.
Questions for the listing agent
- Is there a deadline driving the sale (1031 exchange, divorce, estate, relocation)? That informs how much negotiation room exists.
- Schools are F-rated, which usually means shorter tenancies and higher turnover. Who's the typical renter profile here, and what's been the actual vacancy rate?
- What's the average days-on-market for RENTAL listings here right now (not sales)? A rising rental-DOM trend means longer vacancies and softer asking-rent achievability than the comps imply.
- What's the recent tenant-quality profile in this submarket — average credit score on applications, eviction rate, late-payment / NSF rate, and stable-employment percentage? A property-management company in the area should have these aggregated.
- How much new for-sale + rental construction is in the pipeline within 1–3 miles? Heavy new supply typically softens prices + rents 12–24 months out; constrained supply supports both.
Investment metrics
- 1% rule
- 0.95% ✗
- Cap rate
- 7.98%
- Cash-on-cash
- 6.03%
- DSCR
- 1.27
- GRM
- 8.8
CMA / ARV
- ARV (on-the-fly)
- $160,160
- Comps found
- 9
Show comp detail 9 sales within ~0.75 mi
| Address | Dist | Beds/Ba | Sqft | Sold | Price | $/sf | Match |
|---|---|---|---|---|---|---|---|
| 107 Golf Course Ln | 0.00mi | 3/2.0 | 1,456 (0%) | 1mo | $170,000 | $117 | 99 |
| 118 Putter Ln | 0.32mi | 3/2.0 | 1,404 (-4%) | 13mo | $141,500 | $101 | 68 |
| 206 June Ct | 0.43mi | 2/2.0 (-1) | 1,508 (+4%) | 9mo | $139,900 | $93 | 61 |
| 107 Indiana St | 0.28mi | 3/2.0 | 1,269 (-13%) | 6mo | $160,000 | $126 | 60 |
| 108 Putter Ln | 0.26mi | 3/2.0 | 1,620 (+11%) | 10mo | $184,000 | $114 | 60 |
| 106 Maryland Ave | 0.28mi | 2/2.0 (-1) | 1,269 (-13%) | 4mo | $145,000 | $114 | 57 |
| 212 Alabama St | 0.50mi | 3/2.0 | 1,620 (+11%) | 2mo | $150,000 | $93 | 57 |
| 106 Georgia Ave | 0.51mi | 3/2.0 | 1,344 (-8%) | 9mo | $148,000 | $110 | 56 |
| 123 Peninsular Dr | 0.64mi | 2/2.0 (-1) | 1,345 (-8%) | 3mo | $131,950 | $98 | 50 |
Match score weights: distance 35% · size 25% · config 20% · recency 20%. Top-matched comps best support the ARV.
Projected returns pro-forma
2.86% appreciation · 3.0% rent growth · sell at horizon
- IRR
- 12.7%
- Equity multiple
- 1.72×
- Total profit
- $36,412
- Equity at exit
- $79,523
- IRR
- 14.8%
- Equity multiple
- 3.16×
- Total profit
- $108,619
- Equity at exit
- $121,466
Cash invested: $50,400 (down + closing). Projections, not guarantees.
Landlord ↔ Tenant lean methodology
- Overall (STATE)
- 87 Strongly Landlord-Friendly
- State Florida
- 87 Strongly Landlord-Friendly · R+3
- County
- — inherits STATE
- City
- — inherits STATE
ZIP-level market 32112
- Home prices YoY
- 1.0%
- Active inventory
- 143
- Price-to-rent
- 8.8×
Monthly cashflow live
- Estimated rent
- $1,702 medium interval (Pro) →
- Mortgage (P&I)
- −$944
- Tax from tax record
- −$72 /mo · $866/yr
- Insurance
- −$75
- HOA
- −$0
- Vacancy / Maint / Mgmt
- −$357
- Net cashflow
- $253
Break-even live
UW: 25.0% down · 7.5% · 30yr · 1.5% tax · 5.0% vac · 8.0% maint · 8.0% mgmt
Financing live
Cash to close
- Down payment
- $45,000
- Closing costs
- $5,400
- Reserves months
- —
- Total cash needed
- —
Loan-product check · same deal, 3 products live
Conventional
25% down · 7.5% · 30yr
- Down + closing
- —
- Monthly P&I
- —
- Monthly cashflow
- —
- DSCR
- —
- Eligible?
- —
Personal DTI + credit; lowest rate.
DSCR
20% down · 8.5% · 30yr
- Down + closing
- —
- Monthly P&I
- —
- Monthly cashflow
- —
- DSCR
- —
- Eligible?
- —
No personal income docs; deal must DSCR.
Hard money
10% down · 12.0% · 12mo
- Down + closing
- —
- Monthly P&I
- —
- Monthly cashflow
- —
- DSCR
- —
- Eligible?
- —
Short-term bridge; refi at stabilization.
Listing history 4 events
-
2026-04-06status Pending
-
2026-03-24$180,000 Active
-
2017-11-27soldstatus $98,000
-
2006-01-17soldstatus $129,900
ⓘ Source: listings_history table (triggers on properties + properties_extension) + one-shot
backfill from property_details.listing_events for pre-trigger history.
Tax reassessment forecast FL · Resets to sale price
- Current annual tax
- $866 · $72/mo
- Projected year-2 tax
- $1,494 · $124/mo
- Expected delta
- +$628/yr (+$52/mo · 72.4%)
ⓘ Screening estimate from a state-policy table — verify with the county assessor before closing.
Climate risk First Street
- Flood 1/10 Low FEMA zone X (unshaded) · 0% chance over 30 yrs
- Wildfire 4/10 Moderate
- Heat 8/10 Severe 7 d/yr ≥108°F today · 21 d/yr by 30 yrs out
- Wind 9/10 Extreme 99% chance of damaging wind over 30 yrs
- Air quality 3/10 Moderate 3 unhealthy d/yr today · 3 by 30 yrs out
Nearby sold comps map
Loading sold comps map…
Walkable amenities ~0.75 mi
Loading nearby amenities…
Taxation est. · year 1
- Rental income
- $20,420
- − Mortgage interest
- −$10,083
- − Property taxes
- −$866
- − Insurance
- −$900
- − Repairs & maintenance
- −$1,634
- − Management
- −$1,634
- − Depreciation
- −$5,236
- Taxable income
- $67
- Est. tax owed @ 24.0%
- −$16
- After-tax cash flow
- $3,022/yr
For passive investors: Depreciation is non-cash, so a rental often shows a tax loss while cash-flowing — sheltering income. Rental losses are passive: they offset passive income freely, and up to $25,000/yr can offset ordinary (W-2) income if you actively participate and your MAGI is under $100k (phasing out to $0 by $150k); unused losses carry forward. On sale, claimed depreciation is recaptured at up to 25%, and gains may owe capital-gains tax (a 1031 exchange can defer both). Figures are a year-1 estimate at your 24.0% rate — not tax advice; consult a CPA.
Schools (NCES district)
- District
- Putnam
- NCES district ID
- 1201620
- Math proficiency
- 34% ▼ -10.00%
- Reading proficiency
- 39% ▼ -4.00%
- Median HH income
- $33,350
- Composite
- 29.99/100
- National rank
- #6361
- State rank
- #66 of 73 in FL
Livability — Crescent City
- Score
- 57/100
- State rank
- #857
- US rank
- #22035
Category grades
Schools grade is shown separately in the Schools card above.
Census & demographics
- Population (ZIP)
- 8,099
Population outlook (Putnam County) Hauer SSP2
- Today (2025)
- 65,299 people
- By 2030
- 61,255 · -6.2%
- By 2040
- 52,930 · -18.9%
- By 2050
- 45,051 · -31.0%
- By 2075
- 28,720 · -56.0%
- By 2100
- 15,852 · -75.7%
Race, ethnicity, and origin ACS 2023
- Neighborhood character
- Diverse neighborhood (Simpson 0.63)
- Race & ethnicity
- White 47% Hispanic / Latino 38% Two or more races 30% Black 8% Asian 3%
- Hispanic origin (detail)
- Mexican 34% Puerto Rican 2%
- Common ancestry
- Lithuanian 2% Romanian 2% Slovak 1%
- Foreign-born
- 20% · Canada
- Languages at home
- 64% English-only · Spanish 32% Other Asian/Pacific 3%
Political lean MEDSL · Putnam
- 2024 margin
- Solid R (+47.8) · D 25.8% · R 73.6%
- 2008→2024 swing
- -28.5pp toward R · 2008: -19.3pp · 2024: -47.8pp
- All cycles
- 2024: R+47.8 2020: R+41.2 2016: R+36.6 2012: R+24.5 2008: R+19.3
Not yet ingested
- Civics
- —
Market trends
- HPI YoY
- ▲ 2.86%
- Current HPI
- 279.58
- Rent YoY
- —
- Metro
- —
- State GDP YoY
- ▲ 3.28%
- F500 in state
- 36
Industry mix (Fortune 500 HQ in FL)
| Industry | F500 HQs | Revenue |
|---|---|---|
| Industrial Technology | 2 | $29B |
|
||
| Insurance | 2 | $17B |
|
||
| Retail | 1 | $60B |
|
||
| Technology Distribution | 1 | $58B |
|
||
| Homebuilding | 1 | $35B |
|
||
| Technology Manufacturing | 1 | $35B |
|
||
Price history
+38.6% since first listed4 events — show timeline
- 2026-04-06 Pending — Stellar MLS as Distributed by MLS Grid
- 2026-03-24 Listed $180,000 Stellar MLS as Distributed by MLS Grid
- 2017-11-27 Sold (Public Records) $98,000 Public Records
- 2006-01-17 Sold (Public Records) $129,900 Public Records
Property tax history
-2.0%/yrLatest (2025): $866 · +11.9% YoY. Source: county tax records.
Cash-flow waterfall
monthlySold comps — $/sqft
last 12 mo · ≤1 miLoading sold comps…