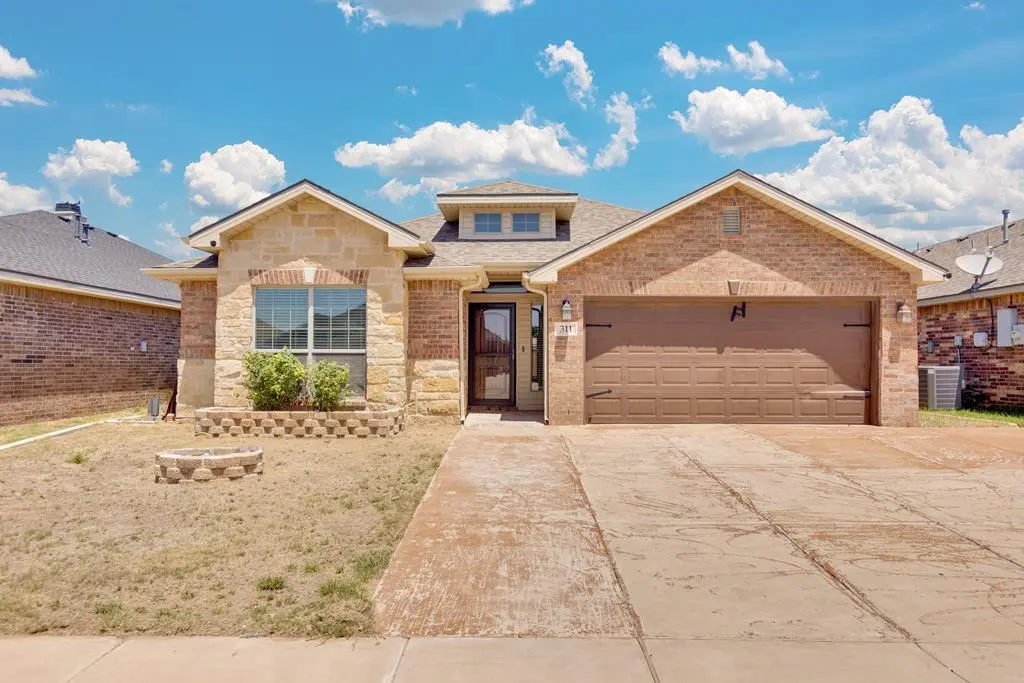
311 E 97th St · Odessa, TX
Flood risk 1/10 · Minimal
- FEMA flood zone
- X (unshaded)
- Chance of flooding over 30 yrs
- 0.0%
- Est. flood insurance / yr
- $507 – $1,088
Fire risk 7/10 · Major
- Est. fire insurance / yr
- $1,222 – $2,270
Heat risk 5/10 · Moderate
- Hot days now (above 101°F)
- 7 days/yr
- Hot days in 30 yrs
- 20 days/yr
Wind risk 2/10 · Minimal
- Chance of severe wind over 30 yrs
- 3.0%
Air-quality risk 1/10 · Minimal
- Unhealthy air days now
- 0 days/yr
- Unhealthy air days in 30 yrs
- 0 days/yr
Risk factors via First Street. Map © Google.
Why this score? — see what drove the D- grade
The composite is a weighted blend of 9 inputs, each scored 0–100. Each bar is that input's sub-score; the figure is the points it added to the 100-point composite (weight × sub-score).
- Cash flow +12.7/30.0
- ARV discount +7.5/15.0
- DSCR +3.8/10.0
- Livability +3.8/5.0
- 1% rule +3.3/10.0
- Rent growth +2.6/5.0
- Condition / age +2.5/5.0
- Schools +2.2/10.0
- Appreciation +0.0/10.0
$299,000
🖨 Deal sheet 📄 Offer letter ✓ Due diligence
Listing remarks MLS
Your home search is over! This is a very nice 3 bedroom 2 bath home built in 2012. The Rachel Marie Plan is fabulous! Garden tub and all. .. Call today!
Key facts
- Bright kitchen
- Spacious living area
- Soaking tub
Tags
Property features AI
Exterior
- Parking: Attached garage with 2 covered spaces (2 total garage spaces); Garage with automatic door opener
- Security: Smoke detector(s)
- Utilities: Public water; Public sewer; Propane available
- Home design: Single-family residence; Residential property
- Construction: Brick veneer construction; Composition roof; Slab foundation; Built living area approximately 1890
- Exterior features: Covered patio/porch; Paved road access; Solar panels
Interior
- Kitchen: Electric range; Microwave; Dishwasher; Garbage disposal; Water heater
- Flooring: Carpet; Tile
- Bathrooms: 2 full bathrooms
- Heating & cooling: Central heating; Central electric cooling
- Interior features: Pantry; Breakfast bar; Blinds; Wood-burning fireplace in living room; Smoke detectors
- Laundry & utility: Washer hookup; Dryer (appliance present)
Neighborhood map
What this means for you Summary
Snapshot
- This is a 3-bed/2.0-bath single-family listed at $299k.
Deal economics
- At list price, monthly cash flow is $-33 ($-392/yr) — negative.
- To cash-flow at today's rent, offer at most $293k (1.9% below list).
- To meet the 1% rule (rent ≥ 1% of price), the offer needs to be $249k (16.9% below list).
- Recommended offer: $249k (16.9% below list) — sets the bar for 1% rule.
Location & tenants
- Location reads 75/100 on livability (#132 in TX, #3,928 nationally) — a middle-class / working-renter tenant base. Strengths: cost of living A+, housing A+, health & safety A+; Watch: commute D+, amenities D.
- Ector County ISD (urban): math 22% / reading 27% proficiency, ranked #707 of 826 in TX (top 86%) — low school quality limits family demand, transient renter base, plan for 1-2y turnover.
- Zoned schools: Barbara Jordan El (math 33% / reading 42%, grade F, #1,744 of 4,322 statewide, top 41%, 854 students, 51% FRL); Permian H S (math 19% / reading 29%, grade F, #1,333 of 1,632 statewide, top 82%, 3,978 students, 51% FRL) — zoned schools at 51% FRL track the district average.
- Market conditions: Rents flat; 431 active listings in the ZIP; 40 comparable units currently listed for rent nearby; rentals lingering (median 44d on market — plan ~5-8 weeks vacancy on turnover, expect pricing pressure); 55% of comp listings sitting > 30 days — soft ceiling on asking rent; solid renter incomes; 1,004 units permitted in Ector County in 2024 (0 in 5+ unit buildings).
Forward outlook
- Local home prices are declining (-3.0%/yr); year-one equity from $2k of loan paydown is wiped out by about $9k of value loss. Plan a longer hold.
- Ector County population projected at +78% by 2050 — long-run rental-demand tailwind backs the buy-and-hold thesis.
Negotiation context
- It's been on market 32 days — a 3% lower offer ($290k) is reasonable based on typical stale-listing flexibility.
- 3 sale attempts since 8y ago with the ask held roughly flat each time — persistent listings suggest the price (not the market) is what's stuck; bring a comps-based counter.
Risks & watch-outs
- Climate carrying-cost: major wildfire risk; extreme-heat days projected 7→20/yr by 2055 (HVAC capex compounding) — expect insurance premiums to compound above CPI over the hold.
Questions for the listing agent
- What do current leases actually rent for vs. the listed asking? Can we see a recent rent roll and the last 12 months of T-12 income?
- It's been on market 32 days. Have you received any prior offers? Is the seller open to a 17% concession, seller financing, or rate buy-down credit?
- Is there a deadline driving the sale (1031 exchange, divorce, estate, relocation)? That informs how much negotiation room exists.
- Schools are F-rated, which usually means shorter tenancies and higher turnover. Who's the typical renter profile here, and what's been the actual vacancy rate?
- The area grade is low — what's the realistic commute time and amenity access for the typical tenant pool here? Any planned neighborhood developments (good or bad) we should know about?
- What's the average days-on-market for RENTAL listings here right now (not sales)? A rising rental-DOM trend means longer vacancies and softer asking-rent achievability than the comps imply.
- What's the recent tenant-quality profile in this submarket — average credit score on applications, eviction rate, late-payment / NSF rate, and stable-employment percentage? A property-management company in the area should have these aggregated.
- How much new for-sale + rental construction is in the pipeline within 1–3 miles? Heavy new supply typically softens prices + rents 12–24 months out; constrained supply supports both.
Investment metrics
- 1% rule
- 0.83% ✗
- Cap rate
- 6.16%
- Cash-on-cash
- -0.47%
- DSCR
- 0.98
- GRM
- 10.0
CMA / ARV
No comps found within radius.
Projected returns pro-forma
-3.0% appreciation · 0.54% rent growth · sell at horizon
- IRR
- -19.8%
- Equity multiple
- 0.32×
- Total profit
- $-56,541
- Equity at exit
- $44,582
- IRR
- -18.7%
- Equity multiple
- 0.10×
- Total profit
- $-75,389
- Equity at exit
- $25,852
Cash invested: $83,720 (down + closing). Projections, not guarantees.
Landlord ↔ Tenant lean methodology
- Overall (STATE)
- 87 Strongly Landlord-Friendly
- State Texas
- 87 Strongly Landlord-Friendly · R+5
- County
- — inherits STATE
- City
- — inherits STATE
ZIP-level market 79765
- Home prices YoY
- -28.7%
- Rents YoY
- 0.5%
- Active inventory
- 431
- Price-to-rent
- 10.0×
Monthly cashflow live
- Estimated rent
- $2,485 high interval (Pro) →
- Mortgage (P&I)
- −$1,568
- Tax from tax record
- −$303 /mo · $3,640/yr
- Insurance
- −$125
- HOA
- −$0
- Vacancy / Maint / Mgmt
- −$522
- Net cashflow
- $-33
Break-even live
UW: 25.0% down · 7.5% · 30yr · 1.5% tax · 5.0% vac · 8.0% maint · 8.0% mgmt
Financing live
Cash to close
- Down payment
- $74,750
- Closing costs
- $8,970
- Reserves months
- —
- Total cash needed
- —
Loan-product check · same deal, 3 products live
Conventional
25% down · 7.5% · 30yr
- Down + closing
- —
- Monthly P&I
- —
- Monthly cashflow
- —
- DSCR
- —
- Eligible?
- —
Personal DTI + credit; lowest rate.
DSCR
20% down · 8.5% · 30yr
- Down + closing
- —
- Monthly P&I
- —
- Monthly cashflow
- —
- DSCR
- —
- Eligible?
- —
No personal income docs; deal must DSCR.
Hard money
10% down · 12.0% · 12mo
- Down + closing
- —
- Monthly P&I
- —
- Monthly cashflow
- —
- DSCR
- —
- Eligible?
- —
Short-term bridge; refi at stabilization.
Rent comps 40 comps
| Address | Beds | Baths | Sqft | Rent | $/sqft | DOM | Units | Dist |
|---|---|---|---|---|---|---|---|---|
| 310 E 95th St Odessa, TX | 3.0 | 2.0 | 1390 | $2,300 | $1.65 | 21d | 1 | 0.16mi |
| 9918 Lamar Ave Odessa, TX | 3.0 | 2.0 | 1596 | $2,400 | $1.50 | 13d | 1 | 0.18mi |
| 320 Panhandle Dr Odessa, TX | 3.0 | 2.0 | 1595 | $2,500 | $1.57 | 43d | 1 | 0.24mi |
| 9914 Rainbow Dr Odessa, TX | 4.0 | 2.0 | 2069 | $3,200 | $1.55 | 43d | 1 | 0.27mi |
| 301 Panhandle Dr Odessa, TX | 4.0 | 2.0 | 2050 | $2,950 | $1.44 | 43d | 1 | 0.28mi |
| 618 Juniper Ct Odessa, TX | 3.0 | 2.0 | 1606 | $2,700 | $1.68 | 13d | 1 | 0.33mi |
| 10306 Sheriff St Odessa, TX | 3.0 | 2.0 | 1240 | $2,050 | $1.65 | 13d | 1 | 0.34mi |
| 9219 Holiday Dr Odessa, TX | 3.0 | 2.5 | 2118 | $2,800 | $1.32 | 43d | 1 | 0.35mi |
| 713 E 96th St Odessa, TX | 3.0 | 2.0 | 1564 | $2,500 | $1.60 | 43d | 1 | 0.35mi |
| 10310 Creek St Odessa, TX | 3.0 | 2.0 | 1238 | $2,300 | $1.86 | 13d | 1 | 0.36mi |
| 808 E 96th St Odessa, TX | 3.0 | 2.0 | 1474 | $2,350 | $1.59 | 43d | 1 | 0.48mi |
| 401 Farmstead Ln Odessa, TX | 3.0 | 2.0 | 1390 | $2,500 | $1.80 | 43d | 1 | 0.49mi |
| 819 E 97th Ct Odessa, TX | 3.0 | 2.0 | 1635 | $2,350 | $1.44 | 13d | 1 | 0.49mi |
| 900 E 96th St Odessa, TX | 3.0 | 2.0 | 1644 | $2,300 | $1.40 | 43d | 1 | 0.55mi |
| 404 Pratt Dr Odessa, TX | 4.0 | 2.0 | 1700 | $2,800 | $1.65 | 43d | 1 | 0.57mi |
| 800 E 92nd St Odessa, TX | 3.0 | 2.0 | 2005 | $2,550 | $1.27 | 43d | 1 | 0.58mi |
| 216 E 91st St Odessa, TX | 3.0 | 3.0 | 1602 | $2,500 | $1.56 | 13d | 1 | 0.66mi |
| 1306 E 94th St Odessa, TX | 3.0 | 2.0 | 1488 | $2,350 | $1.58 | 21d | 1 | 0.84mi |
| 1109 Wagon Way Odessa, TX | 3.0 | 2.0 | 1515 | $2,400 | $1.58 | 13d | 1 | 0.85mi |
| 1303 Terra Cotta St Odessa, TX | 3.0 | 2.0 | 1377 | $1,999 | $1.45 | 43d | 1 | 0.87mi |
| 9017 Pepper Grass Ave Odessa, TX | 3.0 | 2.0 | 1778 | $2,500 | $1.41 | 43d | 1 | 0.90mi |
| 1025 Pine Leaf Pl Odessa, TX | 3.0 | 2.0 | 1411 | $2,200 | $1.56 | 43d | 1 | 0.91mi |
| 9031 Antelope Ave Odessa, TX | 3.0 | 2.0 | 1923 | $2,500 | $1.30 | 43d | 1 | 1.03mi |
| 1226 E 92nd St Odessa, TX | 3.0 | 2.0 | 1526 | $2,250 | $1.47 | 13d | 1 | 1.04mi |
| 8732 Rainbow Dr Odessa, TX | 3.0 | 2.0 | 1573 | $2,400 | $1.53 | 43d | 1 | 1.07mi |
| 1023 E 90th St Odessa, TX | 3.0 | 2.0 | 1760 | $2,500 | $1.42 | 13d | 1 | 1.13mi |
| 1028 E 90th St Odessa, TX | 3.0 | 2.0 | 1461 | $2,145 | $1.47 | 13d | 1 | 1.15mi |
| 8623 Holiday Dr Odessa, TX | 3.0 | 2.0 | 1231 | $1,800 | $1.46 | 43d | 1 | 1.21mi |
| 1210 E 89th St Odessa, TX | 3.0 | 2.0 | 1582 | $2,600 | $1.64 | 43d | 1 | 1.24mi |
| 915 Canal St Odessa, TX | 4.0 | 2.0 | 2080 | $3,100 | $1.49 | 21d | 1 | 1.24mi |
| 8610 Lamar Ave Unit NA Odessa, TX | 3.0 | 2.0 | 1700 | $2,200 | $1.29 | 13d | 1 | 1.24mi |
| 1218 E 89th St Odessa, TX | 3.0 | 2.0 | 1667 | $2,400 | $1.44 | 21d | 1 | 1.27mi |
| 8633 Yale Ave Odessa, TX | 3.0 | 2.0 | 1390 | $2,500 | $1.80 | 21d | 1 | 1.32mi |
| 8633 Yale Ave Odessa, TX | 3.0 | 2.0 | 1371 | $2,500 | $1.82 | 13d | 1 | 1.32mi |
| 1102 Canal St Odessa, TX | 4.0 | 2.0 | 2095 | $2,600 | $1.24 | 21d | 1 | 1.33mi |
| 1115 Canal St Odessa, TX | 3.0 | 2.0 | 1833 | $2,400 | $1.31 | 43d | 1 | 1.34mi |
| 1320 E 89th St Odessa, TX | 3.0 | 2.0 | 1450 | $2,800 | $1.93 | 43d | 1 | 1.36mi |
| 493 Chitalpa Dr Odessa, TX | 3.0 | 2.0 | 1254 | $2,500 | $1.99 | 43d | 1 | 1.39mi |
| 908 Purdue St Odessa, TX | 3.0 | 2.0 | 1480 | $2,500 | $1.69 | 43d | 1 | 1.40mi |
| 912 Purdue St Odessa, TX | 3.0 | 2.0 | 1773 | $2,400 | $1.35 | 43d | 1 | 1.40mi |
Listing history 21 events
-
2026-06-19days on market $299,000 Active 32 DOM
-
2026-06-18days on market $299,000 Active 31 DOM
-
2026-06-17days on market $299,000 Active 30 DOM
-
2026-06-16days on market $299,000 Active 29 DOM
-
2026-06-15days on market $299,000 Active 28 DOM
-
2026-06-14days on market $299,000 Active 26 DOM
-
2026-06-13days on market $299,000 Active 25 DOM
-
2026-06-10days on market $299,000 Active 23 DOM
-
2026-06-09days on market $299,000 Active 22 DOM
-
2026-06-08days on market $299,000 Active 21 DOM
-
2026-06-07days on market $299,000 Active 20 DOM
-
2026-06-03days on market $299,000 Active 15 DOM
-
2026-06-01days on market $299,000 Active 14 DOM
-
2026-05-31days on market $299,000 Active 13 DOM
-
2026-05-30days on market $299,000 Active 12 DOM
-
2026-05-18$299,000 Active
-
2025-03-04historical $2,500
-
2024-12-05$2,500
-
2018-09-18soldstatus
-
2018-09-12soldstatus 153-char remark
Show marketing remark (153 chars)
Your home search is over! This is a very nice 3 bedroom 2 bath home built in 2012. The Rachel Marie Plan is fabulous! Garden tub and all. .. Call today!
-
2018-07-30$249,900 153-char remark
Show marketing remark (153 chars)
Your home search is over! This is a very nice 3 bedroom 2 bath home built in 2012. The Rachel Marie Plan is fabulous! Garden tub and all. .. Call today!
ⓘ Source: listings_history table (triggers on properties + properties_extension) + one-shot
backfill from property_details.listing_events for pre-trigger history.
Tax reassessment forecast TX · Resets to sale price
- Current annual tax
- $3,640 · $303/mo
- Projected year-2 tax
- $5,472 · $456/mo
- Expected delta
- +$1,832/yr (+$153/mo · 50.3%)
ⓘ Screening estimate from a state-policy table — verify with the county assessor before closing.
Climate risk First Street
- Flood 1/10 Low FEMA zone X (unshaded) · 0% chance over 30 yrs
- Wildfire 7/10 Severe
- Heat 5/10 Major 7 d/yr ≥101°F today · 20 d/yr by 30 yrs out
- Wind 2/10 Low 3% chance of damaging wind over 30 yrs
- Air quality 1/10 Low 0 unhealthy d/yr today · 0 by 30 yrs out
Nearby sold comps map
Loading sold comps map…
Walkable amenities ~0.75 mi
Loading nearby amenities…
Taxation est. · year 1
- Rental income
- $29,821
- − Mortgage interest
- −$16,749
- − Property taxes
- −$3,640
- − Insurance
- −$1,495
- − Repairs & maintenance
- −$2,386
- − Management
- −$2,386
- − Depreciation
- −$8,698
- Taxable loss
- −$5,532
- Est. tax savings @ 24.0%
- +$1,328
- After-tax cash flow
- $936/yr
For passive investors: Depreciation is non-cash, so a rental often shows a tax loss while cash-flowing — sheltering income. Rental losses are passive: they offset passive income freely, and up to $25,000/yr can offset ordinary (W-2) income if you actively participate and your MAGI is under $100k (phasing out to $0 by $150k); unused losses carry forward. On sale, claimed depreciation is recaptured at up to 25%, and gains may owe capital-gains tax (a 1031 exchange can defer both). Figures are a year-1 estimate at your 24.0% rate — not tax advice; consult a CPA.
Schools (NCES district)
- District
- Ector County ISD
- NCES district ID
- 4818000
- Math proficiency
- 22% ▼ -9.00%
- Reading proficiency
- 27% ▼ -4.00%
- Median HH income
- $52,740
- Composite
- 21.89/100
- National rank
- #8233
- State rank
- #707 of 826 in TX
Livability — Odessa
- Score
- 75/100
- State rank
- #132
- US rank
- #3928
Category grades
Schools grade is shown separately in the Schools card above.
Census & demographics
- Census place
- Odessa, TX
- County
- Ector County · 131,169 people
- City population
- 131,169
- Metro
- Odessa, TX
- Population (ZIP)
- 25,904
- Household income
- $104,965
- Rent vs Own
- Severe rent burden
- 884.0
Population outlook (Ector County) Hauer SSP2
- Today (2025)
- 212,765 people
- By 2030
- 241,962 · +13.7%
- By 2040
- 306,582 · +44.1%
- By 2050
- 379,755 · +78.5%
- By 2075
- 568,991 · +167.4%
- By 2100
- 709,829 · +233.6%
Race, ethnicity, and origin ACS 2023
- Neighborhood character
- Diverse neighborhood (Simpson 0.59)
- Race & ethnicity
- Hispanic / Latino 49% White 41% Two or more races 15% Black 5% Asian 3% Native American 1%
- Hispanic origin (detail)
- Mexican 45%
- Common ancestry
- Romanian 1% Slovak 1% Lithuanian 1%
- Foreign-born
- 10% · Canada, China, South Korea
- Languages at home
- 63% English-only · Spanish 31% German/W. Germanic 1% Tagalog/Filipino 1%
Political lean MEDSL · Ector
- 2024 margin
- Solid R (+52.9) · D 23.2% · R 76.1%
- 2008→2024 swing
- -4.9pp toward R · 2008: -48.0pp · 2024: -52.9pp
- All cycles
- 2024: R+52.9 2020: R+47.8 2016: R+40.6 2012: R+48.9 2008: R+48.0
Not yet ingested
- Civics
- —
Market trends
- HPI YoY
- ▼ -69.68%
- Current HPI
- 173.4252
- Rent YoY
- ▲ 0.54%
- Metro
- Odessa, TX
- State GDP YoY
- ▲ 3.95%
- F500 in state
- 110
Industry mix (Fortune 500 HQ in TX)
| Industry | F500 HQs | Revenue |
|---|---|---|
| Energy | 16 | $1,198B |
|
||
| Technology | 5 | $198B |
|
||
| Engineering / Construction | 4 | $72B |
|
||
| Energy Services | 3 | $60B |
|
||
| Utilities | 3 | $41B |
|
||
| Healthcare | 2 | $330B |
|
||
Price history
+19.6% since first listed6 events — show timeline
- 2026-05-18 Listed $299,000 ODMLS
- 2025-03-04 Rental Removed $2,500 ODMLS
- 2024-12-05 Listed for Rent $2,500 ODMLS
- 2018-09-18 Sold (Public Records) — Public Records
- 2018-09-12 Sold (MLS) — ODMLS
- 2018-07-30 Listed $249,900 ODMLS
Property tax history
-1.3%/yrLatest (2025): $3,640 · -20.6% YoY. Source: county tax records.
Cash-flow waterfall
monthlySold comps — $/sqft
last 12 mo · ≤1 miLoading sold comps…