111 Vining Rd · Parrish, AL
Flood risk 1/10 · Minimal
- FEMA flood zone
- X (unshaded)
- Chance of flooding over 30 yrs
- 0.0%
- Est. flood insurance / yr
- $507 – $1,088
Fire risk 5/10 · Moderate
- Est. fire insurance / yr
- $916 – $1,700
Heat risk 5/10 · Moderate
- Hot days now (above 106°F)
- 7 days/yr
- Hot days in 30 yrs
- 18 days/yr
Wind risk 6/10 · Moderate
- Chance of severe wind over 30 yrs
- 27.0%
Air-quality risk 3/10 · Minor
- Unhealthy air days now
- 3 days/yr
- Unhealthy air days in 30 yrs
- 3 days/yr
Risk factors via First Street. Map © Google.
Why this score? — see what drove the C+ grade
The composite is a weighted blend of 9 inputs, each scored 0–100. Each bar is that input's sub-score; the figure is the points it added to the 100-point composite (weight × sub-score).
- Cash flow +24.1/30.0
- Appreciation +9.4/10.0
- DSCR +7.8/10.0
- ARV discount +7.5/15.0
- 1% rule +6.3/10.0
- Rent growth +2.5/5.0
- Condition / age +2.5/5.0
- Livability +2.3/5.0
- Schools +2.2/10.0
$134,000
🖨 Deal sheet 📄 Offer letter ✓ Due diligence
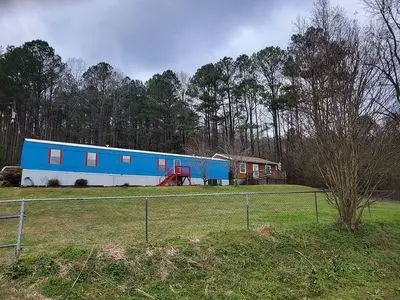
Listing remarks
There are two homes on the property and three out buildings
Key facts
- Three out buildings
- Two homes
- Built 1994
Tags
Neighborhood map
What this means for you Summary
Snapshot
- This is a 4-bed/3.0-bath single-family listed at $134k.
Deal economics
- At list price, monthly cash flow is $266 ($3k/yr) — positive.
- The deal already cash-flows at list — no discount required.
- Meets the 1% rule at list price ($2k rent vs $134k).
- Recommended offer: $132k (1.5% below list) — sets the bar for market timing.
Location & tenants
- Location reads 46/100 on livability (#549 in AL) — a working-class tenant base; expect higher turnover. Strengths: cost of living A+; Watch: housing C-, schools D-, crime F.
- Walker County (rural): math 13% / reading 39% proficiency, ranked #89 of 129 in AL (top 69%) — low school quality limits family demand, transient renter base, plan for 1-2y turnover.
- Market conditions: 18 active listings in the ZIP; 36 units permitted in Walker County in 2024 (0 in 5+ unit buildings).
Forward outlook
- In year one you build about $13k of equity ($926 loan paydown + $12k appreciation (8.7% local appreciation)).
- Walker County population projected at -21% by 2050 — secular population decline; favor cash flow + early exit over multi-decade hold.
- At projected returns (8.7% appreciation + 3.0% rent growth), your $38k cash investment doubles in ~3 years — after that, you're playing with house money.
- By year 3, paydown + projected appreciation supports a ~$32k cash-out refi (75% LTV) — recoverable capital for the next deal without selling this one.
Negotiation context
- It's been on market 21 days — a 2% lower offer ($132k) is reasonable based on typical stale-listing flexibility.
Risks & watch-outs
- Climate carrying-cost: major wind risk, 27% chance of damaging wind over 30y; moderate wildfire risk; extreme-heat days projected 7→18/yr by 2055 (HVAC capex compounding) — expect insurance premiums to compound above CPI over the hold.
Questions for the listing agent
- Is there a deadline driving the sale (1031 exchange, divorce, estate, relocation)? That informs how much negotiation room exists.
- Schools are D-rated, which usually means shorter tenancies and higher turnover. Who's the typical renter profile here, and what's been the actual vacancy rate?
- Crime grade is F in this area — have there been break-ins, vandalism, or insurance claims at this property in the last 3 years? What carrier currently insures it and at what premium?
- What's the average days-on-market for RENTAL listings here right now (not sales)? A rising rental-DOM trend means longer vacancies and softer asking-rent achievability than the comps imply.
- What's the recent tenant-quality profile in this submarket — average credit score on applications, eviction rate, late-payment / NSF rate, and stable-employment percentage? A property-management company in the area should have these aggregated.
- How much new for-sale + rental construction is in the pipeline within 1–3 miles? Heavy new supply typically softens prices + rents 12–24 months out; constrained supply supports both.
Investment metrics
- 1% rule
- 1.13% ✓
- Cap rate
- 8.67%
- Cash-on-cash
- 8.50%
- DSCR
- 1.38
- GRM
- 7.4
CMA / ARV
No comps found within radius.
Projected returns pro-forma
8.73% appreciation · 3.0% rent growth · sell at horizon
- IRR
- 28.0%
- Equity multiple
- 3.09×
- Total profit
- $78,513
- Equity at exit
- $108,563
- IRR
- 24.8%
- Equity multiple
- 6.75×
- Total profit
- $215,815
- Equity at exit
- $222,284
Cash invested: $37,520 (down + closing). Projections, not guarantees.
Landlord ↔ Tenant lean methodology
- Overall (STATE)
- 90 Strongly Landlord-Friendly
- State Alabama
- 90 Strongly Landlord-Friendly · R+15
- County
- — inherits STATE
- City
- — inherits STATE
ZIP-level market 35580
- Home prices YoY
- 3.9%
- Active inventory
- 18
- Price-to-rent
- 7.4×
Monthly cashflow live
- Estimated rent
- $1,509 medium interval (Pro) →
- Mortgage (P&I)
- −$703
- Tax est. 1.5%
- −$168 /mo · $2,010/yr
- Insurance
- −$56
- HOA
- −$0
- Vacancy / Maint / Mgmt
- −$317
- Net cashflow
- $266
Break-even live
UW: 25.0% down · 7.5% · 30yr · 1.5% tax · 5.0% vac · 8.0% maint · 8.0% mgmt
Financing live
Cash to close
- Down payment
- $33,500
- Closing costs
- $4,020
- Reserves months
- —
- Total cash needed
- —
Loan-product check · same deal, 3 products live
Conventional
25% down · 7.5% · 30yr
- Down + closing
- —
- Monthly P&I
- —
- Monthly cashflow
- —
- DSCR
- —
- Eligible?
- —
Personal DTI + credit; lowest rate.
DSCR
20% down · 8.5% · 30yr
- Down + closing
- —
- Monthly P&I
- —
- Monthly cashflow
- —
- DSCR
- —
- Eligible?
- —
No personal income docs; deal must DSCR.
Hard money
10% down · 12.0% · 12mo
- Down + closing
- —
- Monthly P&I
- —
- Monthly cashflow
- —
- DSCR
- —
- Eligible?
- —
Short-term bridge; refi at stabilization.
Listing history 13 events
-
2026-06-15days on market $134,000 Active 21 DOM
-
2026-06-13days on market $134,000 Active 19 DOM
-
2026-06-13days on market $134,000 Active 18 DOM
-
2026-06-10days on market $134,000 Active 16 DOM
-
2026-06-09days on market $134,000 Active 15 DOM
-
2026-06-08days on market $134,000 Active 14 DOM
-
2026-06-07days on market $134,000 Active 13 DOM
-
2026-06-05days on market $134,000 Active 10 DOM
-
2026-06-03days on market $134,000 Active 9 DOM
-
2026-06-03days on market $134,000 Active 8 DOM
-
2026-06-01days on market $134,000 Active 7 DOM
-
2026-05-31days on market $134,000 Active 6 DOM
-
2026-05-26$134,000 Active
ⓘ Source: listings_history table (triggers on properties + properties_extension) + one-shot
backfill from property_details.listing_events for pre-trigger history.
Climate risk First Street
- Flood 1/10 Low FEMA zone X (unshaded) · 0% chance over 30 yrs
- Wildfire 5/10 Major
- Heat 5/10 Major 7 d/yr ≥106°F today · 18 d/yr by 30 yrs out
- Wind 6/10 Major 27% chance of damaging wind over 30 yrs
- Air quality 3/10 Moderate 3 unhealthy d/yr today · 3 by 30 yrs out
Nearby sold comps map
Loading sold comps map…
Walkable amenities ~0.75 mi
Loading nearby amenities…
Taxation est. · year 1
- Rental income
- $18,106
- − Mortgage interest
- −$7,506
- − Property taxes
- −$2,010
- − Insurance
- −$670
- − Repairs & maintenance
- −$1,448
- − Management
- −$1,448
- − Depreciation
- −$3,898
- Taxable income
- $1,124
- Est. tax owed @ 24.0%
- −$270
- After-tax cash flow
- $2,921/yr
For passive investors: Depreciation is non-cash, so a rental often shows a tax loss while cash-flowing — sheltering income. Rental losses are passive: they offset passive income freely, and up to $25,000/yr can offset ordinary (W-2) income if you actively participate and your MAGI is under $100k (phasing out to $0 by $150k); unused losses carry forward. On sale, claimed depreciation is recaptured at up to 25%, and gains may owe capital-gains tax (a 1031 exchange can defer both). Figures are a year-1 estimate at your 24.0% rate — not tax advice; consult a CPA.
Schools (NCES district)
- District
- Walker County
- NCES district ID
- 0103450
- Math proficiency
- 13% ▼ -28.00%
- Reading proficiency
- 39% ▼ -5.00%
- Median HH income
- $36,664
- Composite
- 21.51/100
- National rank
- #8321
- State rank
- #89 of 129 in AL
Livability — Parrish
- Score
- 46/100
- State rank
- #549
- US rank
- #26522
Category grades
Schools grade is shown separately in the Schools card above.
Census & demographics
- Population (ZIP)
- 3,526
Population outlook (Walker County) Hauer SSP2
- Today (2025)
- 61,037 people
- By 2030
- 58,391 · -4.3%
- By 2040
- 53,080 · -13.0%
- By 2050
- 48,031 · -21.3%
- By 2075
- 37,799 · -38.1%
- By 2100
- 29,001 · -52.5%
Race, ethnicity, and origin ACS 2023
- Neighborhood character
- Predominantly White (89%)
- Race & ethnicity
- White 89% Black 7% Two or more races 3% Hispanic / Latino 1%
- Common ancestry
- Slovak 5% Italian 2% Lithuanian 1%
- Foreign-born
- 0%
- Languages at home
- 99% English-only · Spanish 1%
Political lean MEDSL · Walker
- 2024 margin
- Solid R (+71.8) · D 13.8% · R 85.6%
- 2008→2024 swing
- -25.4pp toward R · 2008: -46.4pp · 2024: -71.8pp
- All cycles
- 2024: R+71.8 2020: R+67.9 2016: R+67.4 2012: R+52.9 2008: R+46.4
Not yet ingested
- Civics
- —
Market trends
- HPI YoY
- ▲ 8.73%
- Current HPI
- 235.753
- Rent YoY
- —
- Metro
- —
- State GDP YoY
- ▲ 2.94%
- F500 in state
- 4
Industry mix (Fortune 500 HQ in AL)
| Industry | F500 HQs | Revenue |
|---|---|---|
| Financial Services | 1 | $8B |
|
||
| Healthcare | 1 | $5B |
|
||
Price history
1 event — show timeline
- 2026-05-26 Listed $134,000 FSBO.com
Property tax history
+13.2%/yrLatest (2018): $63 · +0.0% YoY. Source: county tax records.
Cash-flow waterfall
monthlySold comps — $/sqft
last 12 mo · ≤1 miLoading sold comps…