16895 Silver Dr S · Buckhorn, CA
Flood risk 1/10 · Minimal
- FEMA flood zone
- X (unshaded)
- Chance of flooding over 30 yrs
- 0.0%
- Est. flood insurance / yr
- $507 – $1,088
Fire risk 7/10 · Major
- Est. fire insurance / yr
- $659 – $1,223
Heat risk 4/10 · Minor
- Hot days now (above 97°F)
- 7 days/yr
- Hot days in 30 yrs
- 15 days/yr
Wind risk 1/10 · Minimal
- Chance of severe wind over 30 yrs
- —
Air-quality risk 10/10 · Severe
- Unhealthy air days now
- 24 days/yr
- Unhealthy air days in 30 yrs
- 30 days/yr
Risk factors via First Street. Map © Google.
Why this score? — see what drove the D grade
The composite is a weighted blend of 9 inputs, each scored 0–100. Each bar is that input's sub-score; the figure is the points it added to the 100-point composite (weight × sub-score).
- Cash flow +16.2/30.0
- ARV discount +7.5/15.0
- DSCR +5.0/10.0
- 1% rule +3.2/10.0
- Livability +2.8/5.0
- Schools +2.7/10.0
- Rent growth +2.5/5.0
- Condition / age +2.5/5.0
- Appreciation +0.0/10.0
$240,000
🖨 Deal sheet 📄 Offer letter ✓ Due diligence
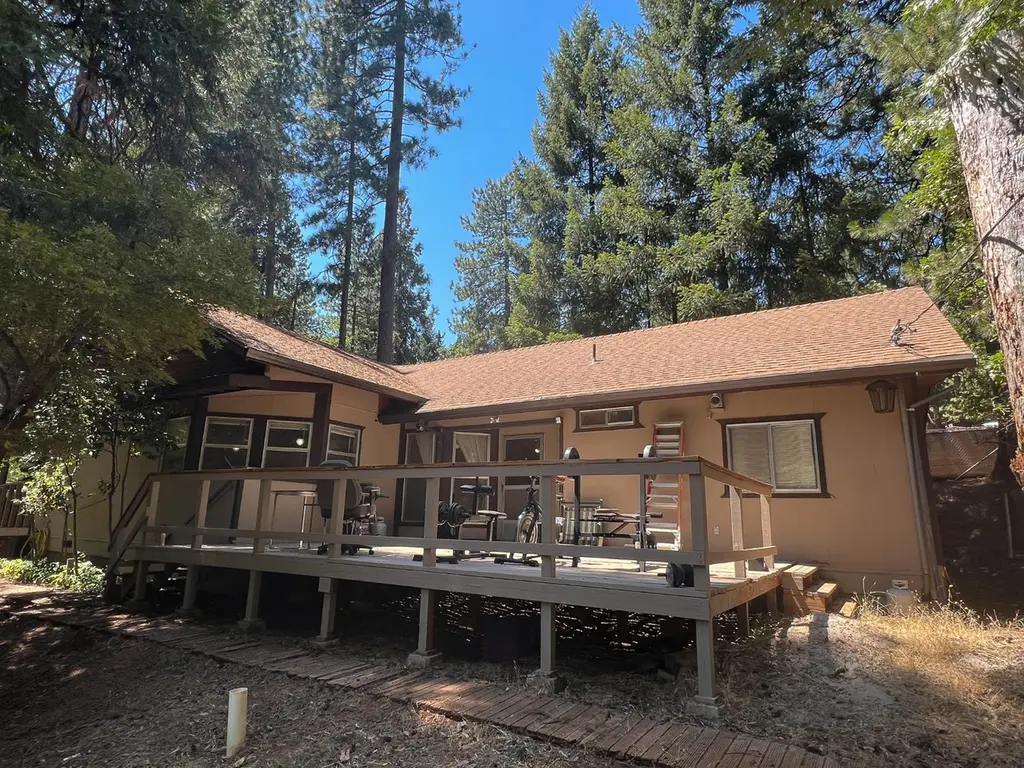
Listing remarks
This great all original 1981 home is packed full of charm and storage. Well cared for and ready for an update, this 3 bedroom 2 bathroom home tucked away in the woods has a spacious open floor plan. A large laundry room has been sectioned off to make an office or storage space but could easily be converted back. The house is currently set up to run on Electric but has gas hook-ups if the buyer wants to set up a propane tank. HVAC system existing but not hooked up, ducting needs to be replaced. House is priced according to current original condition. Pest inspection has been completed. Plumbing functions great! Needs paint, carpet and light cosmetic repairs inside and outside.
Key facts
- 1 acre lot
- Parking
- Built 1981
Neighborhood map
What this means for you Summary
Snapshot
- This is a 3-bed/2.0-bath single-family listed at $240k.
Deal economics
- At list price, monthly cash flow is $128 ($2k/yr) — positive.
- The deal already cash-flows at list — no discount required.
- To meet the 1% rule (rent ≥ 1% of price), the offer needs to be $197k (18.1% below list).
- Recommended offer: $197k (18.1% below list) — sets the bar for 1% rule.
- Cap rate 6.9% vs local median 3.7% in Buckhorn — top-decile yield for the area; either an underpriced asset or a hidden risk that comps aren't pricing in. Stress-test before assuming the spread holds.
Location & tenants
- Location reads 56/100 on livability (#803 in CA) — a working-class tenant base; expect higher turnover. Strengths: housing A+, crime B+; Watch: schools D, amenities F, commute F.
- Amador County Unified (town): math 23% / reading 37% proficiency, ranked #330 of 517 in CA (top 64%) — families likely to look elsewhere, expect single-tenant / working-renter base with shorter leases.
- Market conditions: 152 active listings in the ZIP; 2 comparable units currently listed for rent nearby; 66 units permitted in Amador County in 2024 (0 in 5+ unit buildings).
Forward outlook
- Local home prices are declining (-3.0%/yr); year-one equity from $2k of loan paydown is wiped out by about $7k of value loss. Plan a longer hold.
- Amador County population projected at -15% by 2050 — secular population decline; favor cash flow + early exit over multi-decade hold.
Negotiation context
- It's been on market 275 days — a 12% lower offer ($211k) is reasonable based on typical stale-listing flexibility.
- Current owner paid $126k; list at $240k implies a 91% gain — meaningful room to come down on a strong offer.
Risks & watch-outs
- Climate carrying-cost: major wildfire risk — expect insurance premiums to compound above CPI over the hold.
Questions for the listing agent
- It's been on market 275 days. Have you received any prior offers? Is the seller open to a 18% concession, seller financing, or rate buy-down credit?
- Why hasn't it sold? Are there any deal-killer items the seller is aware of (foundation, flood, title, zoning, code violations)?
- Is there a deadline driving the sale (1031 exchange, divorce, estate, relocation)? That informs how much negotiation room exists.
- Schools are D-rated, which usually means shorter tenancies and higher turnover. Who's the typical renter profile here, and what's been the actual vacancy rate?
- The area grade is low — what's the realistic commute time and amenity access for the typical tenant pool here? Any planned neighborhood developments (good or bad) we should know about?
- What's the average days-on-market for RENTAL listings here right now (not sales)? A rising rental-DOM trend means longer vacancies and softer asking-rent achievability than the comps imply.
- What's the recent tenant-quality profile in this submarket — average credit score on applications, eviction rate, late-payment / NSF rate, and stable-employment percentage? A property-management company in the area should have these aggregated.
- How much new for-sale + rental construction is in the pipeline within 1–3 miles? Heavy new supply typically softens prices + rents 12–24 months out; constrained supply supports both.
Investment metrics
- 1% rule
- 0.82% ✗
- Cap rate
- 6.93%
- Cash-on-cash
- 2.28%
- DSCR
- 1.10
- GRM
- 10.2
CMA / ARV
- ARV (median comp)
- $84,728
- List price
- $240,000
- Delta
- 183.26%
- Verdict
- OVERPRICED
- Comps
- 3 within 2.0 mi
Show comp detail 12 sales within ~0.75 mi
| Address | Dist | Beds/Ba | Sqft | Sold | Price | $/sf | Match |
|---|---|---|---|---|---|---|---|
| 16931 Silver Drive South | 0.04mi | 3/2.5 | 1,784 (+2%) | 9mo | $250,000 | $140 | 85 |
| 16915 S Silver Dr | 0.01mi | 3/2.0 | 1,612 (-8%) | 4mo | $375,000 | $233 | 83 |
| 16931 Alpine Dr | 0.06mi | 2/2.0 (-1) | 1,724 (-1%) | 9mo | $322,500 | $187 | 82 |
| 27076 Silver Dr | 0.08mi | 3/2.0 | 1,932 (+11%) | 1mo | $275,000 | $142 | 77 |
| 27197 Barton Rd | 0.23mi | 3/2.0 | 1,867 (+7%) | 2mo | $350,000 | $187 | 76 |
| 27390 Barton | 0.42mi | 3/2.0 | 1,826 (+5%) | 0mo | $400,000 | $219 | 73 |
| 16878 Broken Oak Rd | 0.24mi | 3/2.0 | 1,641 (-6%) | 9mo | $330,000 | $201 | 71 |
| 26890 Silver Dr | 0.13mi | 2/2.0 (-1) | 1,561 (-10%) | 1mo | $299,000 | $192 | 70 |
| 16689 Silver Pine Rd | 0.40mi | 3/2.0 | 1,637 (-6%) | 4mo | $380,000 | $232 | 68 |
| 26357 Golf View Ln | 0.67mi | 3/2.0 | 1,616 (-7%) | 7mo | $419,500 | $260 | 51 |
| 26321 Golf Links Dr | 0.69mi | 3/2.0 | 1,592 (-9%) | 3mo | $400,000 | $251 | 50 |
| 16548 Alpine Ln | 0.69mi | 3/2.0 | 1,573 (-10%) | 8mo | $374,900 | $238 | 45 |
Match score weights: distance 35% · size 25% · config 20% · recency 20%. Top-matched comps best support the ARV.
Projected returns pro-forma
-3.0% appreciation · 3.0% rent growth · sell at horizon
- IRR
- -12.7%
- Equity multiple
- 0.54×
- Total profit
- $-30,865
- Equity at exit
- $35,785
- IRR
- -3.8%
- Equity multiple
- 0.75×
- Total profit
- $-16,857
- Equity at exit
- $20,751
Cash invested: $67,200 (down + closing). Projections, not guarantees.
Landlord ↔ Tenant lean methodology
- Overall (STATE)
- 18 Strongly Tenant-Friendly
- State California
- 18 Strongly Tenant-Friendly · D+13
- County
- — inherits STATE
- City
- — inherits STATE
ZIP-level market 95666
- Active inventory
- 152
- Price-to-rent
- 10.2×
Monthly cashflow live
- Estimated rent
- $1,966 medium interval (Pro) →
- Mortgage (P&I)
- −$1,259
- Tax from tax record
- −$67 /mo · $805/yr
- Insurance
- −$100
- HOA
- −$0
- Vacancy / Maint / Mgmt
- −$413
- Net cashflow
- $128
Break-even live
UW: 25.0% down · 7.5% · 30yr · 1.5% tax · 5.0% vac · 8.0% maint · 8.0% mgmt
Financing live
Cash to close
- Down payment
- $60,000
- Closing costs
- $7,200
- Reserves months
- —
- Total cash needed
- —
Loan-product check · same deal, 3 products live
Conventional
25% down · 7.5% · 30yr
- Down + closing
- —
- Monthly P&I
- —
- Monthly cashflow
- —
- DSCR
- —
- Eligible?
- —
Personal DTI + credit; lowest rate.
DSCR
20% down · 8.5% · 30yr
- Down + closing
- —
- Monthly P&I
- —
- Monthly cashflow
- —
- DSCR
- —
- Eligible?
- —
No personal income docs; deal must DSCR.
Hard money
10% down · 12.0% · 12mo
- Down + closing
- —
- Monthly P&I
- —
- Monthly cashflow
- —
- DSCR
- —
- Eligible?
- —
Short-term bridge; refi at stabilization.
Rent comps 2 comps
| Address | Beds | Baths | Sqft | Rent | $/sqft | DOM | Units | Dist |
|---|---|---|---|---|---|---|---|---|
| 26232 Parkwood Dr E Pioneer, CA | 3.0 | 2.0 | 1671 | $1,950 | $1.17 | 43d | 1 | 0.80mi |
| 26459 Sugar Pine Dr Pioneer, CA | 4.0 | 3.0 | 1800 | $1,995 | $1.11 | 43d | 1 | 1.41mi |
Listing history 4 events
-
2012-07-03historical
-
2012-03-27$68,000
-
2002-07-11soldstatus $125,500
-
2001-07-31soldstatus $122,500
ⓘ Source: listings_history table (triggers on properties + properties_extension) + one-shot
backfill from property_details.listing_events for pre-trigger history.
Tax reassessment forecast CA · Resets to sale price
- Current annual tax
- $805 · $67/mo
- Projected year-2 tax
- $1,824 · $152/mo
- Expected delta
- +$1,019/yr (+$85/mo · 126.5%)
ⓘ Screening estimate from a state-policy table — verify with the county assessor before closing.
Climate risk First Street
- Flood 1/10 Low FEMA zone X (unshaded) · 0% chance over 30 yrs
- Wildfire 7/10 Severe
- Heat 4/10 Moderate 7 d/yr ≥97°F today · 15 d/yr by 30 yrs out
- Wind 1/10 Low
- Air quality 10/10 Extreme 24 unhealthy d/yr today · 30 by 30 yrs out
Nearby sold comps map
Loading sold comps map…
Walkable amenities ~0.75 mi
Loading nearby amenities…
Taxation est. · year 1
- Rental income
- $23,597
- − Mortgage interest
- −$13,444
- − Property taxes
- −$805
- − Insurance
- −$1,200
- − Repairs & maintenance
- −$1,888
- − Management
- −$1,888
- − Depreciation
- −$6,982
- Taxable loss
- −$2,609
- Est. tax savings @ 24.0%
- +$626
- After-tax cash flow
- $2,160/yr
For passive investors: Depreciation is non-cash, so a rental often shows a tax loss while cash-flowing — sheltering income. Rental losses are passive: they offset passive income freely, and up to $25,000/yr can offset ordinary (W-2) income if you actively participate and your MAGI is under $100k (phasing out to $0 by $150k); unused losses carry forward. On sale, claimed depreciation is recaptured at up to 25%, and gains may owe capital-gains tax (a 1031 exchange can defer both). Figures are a year-1 estimate at your 24.0% rate — not tax advice; consult a CPA.
Schools (NCES district)
- District
- Amador County Unified
- NCES district ID
- 0602450
- Math proficiency
- 23% ▼ -9.00%
- Reading proficiency
- 37% ▼ -10.00%
- Median HH income
- $55,428
- Composite
- 26.67/100
- National rank
- #7163
- State rank
- #330 of 517 in CA
Livability — Buckhorn
- Score
- 56/100
- State rank
- #803
- US rank
- #22794
Category grades
Schools grade is shown separately in the Schools card above.
Census & demographics
- Census place
- Buckhorn, CA
- Population (ZIP)
- 6,089
Population outlook (Amador County) Hauer SSP2
- Today (2025)
- 35,295 people
- By 2030
- 34,147 · -3.3%
- By 2040
- 31,618 · -10.4%
- By 2050
- 29,913 · -15.2%
- By 2075
- 27,308 · -22.6%
- By 2100
- 23,465 · -33.5%
Race, ethnicity, and origin ACS 2023
- Neighborhood character
- Predominantly White (81%)
- Race & ethnicity
- White 81% Hispanic / Latino 13% Two or more races 9% Asian 1%
- Hispanic origin (detail)
- Mexican 10%
- Common ancestry
- Italian 4% Scottish 4% Slovak 2%
- Foreign-born
- 2% · Canada, South Korea
- Languages at home
- 96% English-only · Spanish 1% German/W. Germanic 1% Tagalog/Filipino 1%
Political lean MEDSL · Amador
- 2024 margin
- Strong R (+27.8) · D 34.7% · R 62.6% · Other 2.7%
- 2008→2024 swing
- -13.2pp toward R · 2008: -14.6pp · 2024: -27.8pp
- All cycles
- 2024: R+27.8 2020: R+24.4 2016: R+25.2 2012: R+19.0 2008: R+14.6
Not yet ingested
- Civics
- —
Market trends
- HPI YoY
- ▼ -107.84%
- Current HPI
- 143.0962
- Rent YoY
- —
- Metro
- —
- State GDP YoY
- ▲ 3.21%
- F500 in state
- 116
Industry mix (Fortune 500 HQ in CA)
| Industry | F500 HQs | Revenue |
|---|---|---|
| Technology | 27 | $1,492B |
|
||
| Financial Services | 3 | $174B |
|
||
| Retail | 3 | $44B |
|
||
| Insurance | 3 | $26B |
|
||
| Media / Entertainment | 2 | $115B |
|
||
| Pharmaceuticals / Biotech | 2 | $62B |
|
||
Price history
-44.5% since first listed4 events — show timeline
- 2012-07-03 Listing Removed — CRMLS
- 2012-03-27 Listed $68,000 CRMLS
- 2002-07-11 Sold (Public Records) $125,500 Public Records
- 2001-07-31 Sold (Public Records) $122,500 Public Records
Property tax history
-1.6%/yrLatest (2025): $805 · +1.7% YoY. Source: county tax records.
Cash-flow waterfall
monthlySold comps — $/sqft
last 12 mo · ≤1 miLoading sold comps…