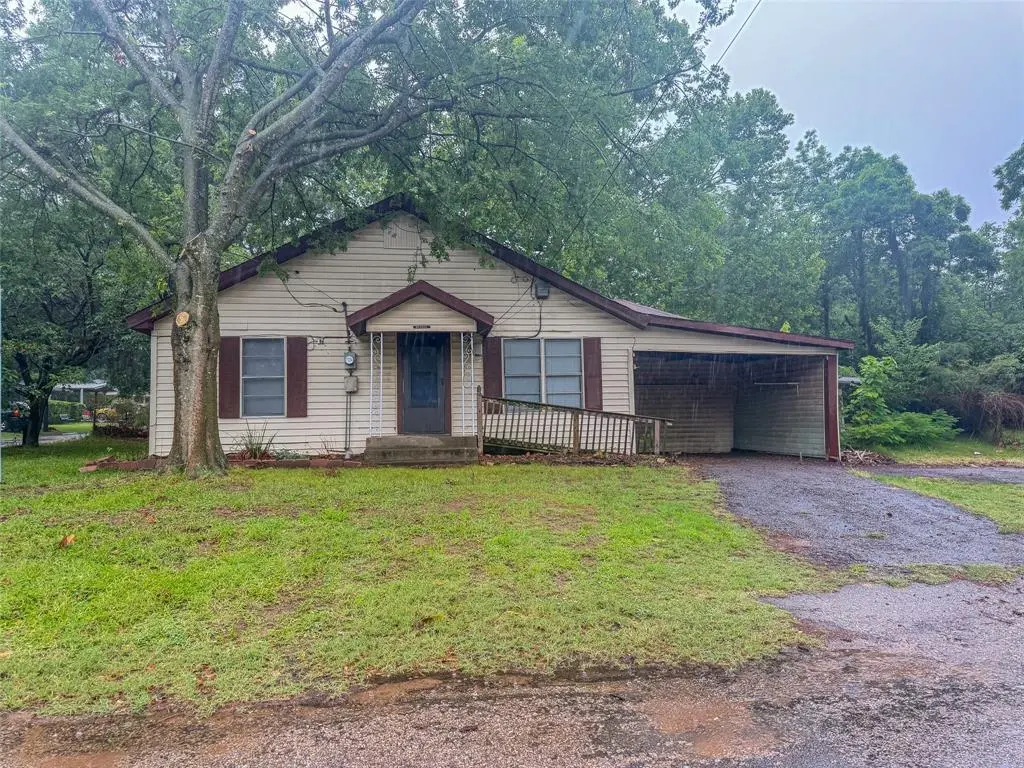
805 12th NE · Paris, TX
Flood risk 1/10 · Minimal
- FEMA flood zone
- X (unshaded)
- Chance of flooding over 30 yrs
- 0.0%
- Est. flood insurance / yr
- $507 – $1,088
Fire risk 5/10 · Moderate
- Est. fire insurance / yr
- $1,222 – $2,270
Heat risk 7/10 · Major
- Hot days now (above 110°F)
- 7 days/yr
- Hot days in 30 yrs
- 20 days/yr
Wind risk 4/10 · Minor
- Chance of severe wind over 30 yrs
- 23.0%
Air-quality risk 2/10 · Minimal
- Unhealthy air days now
- 0 days/yr
- Unhealthy air days in 30 yrs
- 1 days/yr
Risk factors via First Street. Map © Google.
Why this score? — see what drove the C grade
The composite is a weighted blend of 9 inputs, each scored 0–100. Each bar is that input's sub-score; the figure is the points it added to the 100-point composite (weight × sub-score).
- Cash flow +29.6/30.0
- DSCR +10.0/10.0
- 1% rule +8.3/10.0
- Livability +3.1/5.0
- Schools +3.0/10.0
- Rent growth +2.5/5.0
- Condition / age +2.5/5.0
- ARV discount +0.0/15.0
- Appreciation +0.0/10.0
$99,000
🖨 Deal sheet 📄 Offer letter ✓ Due diligence
Listing remarks
INVESTORS!! This 3 bedroom, 1.5 bathroom home offers solid fundamentals and clear upside, making it an attractive option for investors or buyers looking for a value-add opportunity. The open floor plan provides a great foundation, and the home is already functional as-is, but ready for cosmetic improvements—fresh paint and new bedroom flooring will immediately boost appeal and equity. Three oversized bedrooms and a large full bathroom. The deck off the back adds the perfect setting to enjoy the large backyard. The roof is relatively new and in good condition, reducing upfront capital expenses and giving investors confidence in the major systems. Sitting on a corner lot made up of thre
Key facts
- Open floor plan
- Deck off the back
- Potential to add on
Tags
Property features AI
Finance
- Other: Parcel number 10220; Subdivision: Belmont Addition
- Financial info: Second mortgage: no; Loan type treated as clear
- HOA & community: No homeowners association
Exterior
- Parking: Attached carport (1 covered/carport space)
- Utilities: City water; Not in a municipal utility district
- Home design: Single-family residence; Attached property; One story; Residential property
- Construction: Pillar/post/pier foundation; Year built not specified
- Exterior features: Deck; Front porch; Corner lot; Large backyard with grass; Oak trees
Interior
- Kitchen: No appliances included
- Bedrooms: 3 bedrooms (primary bedroom on level 1)
- Flooring: Wood flooring
- Bathrooms: 2 total bathrooms (1 full, 1 half)
- Heating & cooling: Wall/window cooling units
- Interior features: Eat-in kitchen; Natural woodwork; Open floorplan; One living area; One dining area; Room count of 2; One-level layout
- Laundry & utility: No washer/dryer or utility appliances listed
Neighborhood map
What this means for you Summary
Snapshot
- This is a 3-bed/1.0-bath single-family listed at $99k.
Deal economics
- At list price, monthly cash flow is $358 ($4k/yr) — positive.
- The deal already cash-flows at list — no discount required.
- Meets the 1% rule at list price ($1k rent vs $99k).
- Recommended offer: $96k (3.0% below list) — sets the bar for market timing.
- Cap rate 10.6% vs local median 3.6% in Paris — top-decile yield for the area; either an underpriced asset or a hidden risk that comps aren't pricing in. Stress-test before assuming the spread holds.
Location & tenants
- Location reads 61/100 on livability (#984 in TX) — a middle-class / working-renter tenant base. Strengths: cost of living A+, housing A+; Watch: schools D+, crime F, amenities F.
- Paris ISD (town): math 36% / reading 37% proficiency, ranked #521 of 826 in TX (top 63%) — families likely to look elsewhere, expect single-tenant / working-renter base with shorter leases; 70% free/reduced lunch — lower-income household profile, screen leases tightly.
- Market conditions: 274 active listings in the ZIP; 5 comparable units currently listed for rent nearby; rentals lingering (median 44d on market — plan ~5-8 weeks vacancy on turnover, expect pricing pressure); 100% of comp listings sitting > 30 days — soft ceiling on asking rent; 119 units permitted in Lamar County in 2024 (71 in 5+ unit buildings).
- This rent runs 34% of the median local income ($46k/yr) — at the standard rent-burdened threshold; future hikes will face affordability resistance.
Forward outlook
- Local home prices are declining (-3.0%/yr); year-one equity from $684 of loan paydown is wiped out by about $3k of value loss. Plan a longer hold.
- Lamar County population projected at -13% by 2050 — secular population decline; favor cash flow + early exit over multi-decade hold.
- At projected returns (-3.0% appreciation + 3.0% rent growth), your $28k cash investment doubles in ~8 years — after that, you're playing with house money.
Negotiation context
- It's been on market 31 days — a 3% lower offer ($96k) is reasonable based on typical stale-listing flexibility.
Risks & watch-outs
- Climate carrying-cost: moderate wildfire risk; extreme-heat days projected 7→20/yr by 2055 (HVAC capex compounding) — expect insurance premiums to compound above CPI over the hold.
Questions for the listing agent
- It's been on market 31 days. Have you received any prior offers? Is the seller open to a 3% concession, seller financing, or rate buy-down credit?
- Is there a deadline driving the sale (1031 exchange, divorce, estate, relocation)? That informs how much negotiation room exists.
- Schools are D-rated, which usually means shorter tenancies and higher turnover. Who's the typical renter profile here, and what's been the actual vacancy rate?
- Crime grade is F in this area — have there been break-ins, vandalism, or insurance claims at this property in the last 3 years? What carrier currently insures it and at what premium?
- What's the average days-on-market for RENTAL listings here right now (not sales)? A rising rental-DOM trend means longer vacancies and softer asking-rent achievability than the comps imply.
- What's the recent tenant-quality profile in this submarket — average credit score on applications, eviction rate, late-payment / NSF rate, and stable-employment percentage? A property-management company in the area should have these aggregated.
- How much new for-sale + rental construction is in the pipeline within 1–3 miles? Heavy new supply typically softens prices + rents 12–24 months out; constrained supply supports both.
Investment metrics
- 1% rule
- 1.33% ✓
- Cap rate
- 10.63%
- Cash-on-cash
- 15.49%
- DSCR
- 1.69
- GRM
- 6.2
CMA / ARV
- ARV (on-the-fly)
- $78,648
- Comps found
- 11
Show comp detail 11 sales within ~0.75 mi
| Address | Dist | Beds/Ba | Sqft | Sold | Price | $/sf | Match |
|---|---|---|---|---|---|---|---|
| 910 Van Zandt St | 0.24mi | 3/2.0 | 1,352 (-0%) | 0mo | $174,500 | $129 | 84 |
| 1154 Fairfax | 0.04mi | 3/2.0 | 1,514 (+12%) | 14mo | $54,900 | $36 | 63 |
| 380 3rd St NE | 0.63mi | 3/1.0 | 1,305 (-4%) | 2mo | $28,000 | $21 | 62 |
| 1511 Pine Bluff St | 0.36mi | 3/1.0 | 1,296 (-4%) | 20mo | $75,000 | $58 | 59 |
| 506 E Price St | 0.65mi | 3/2.0 | 1,349 (-0%) | 9mo | $205,000 | $152 | 57 |
| 230 NE 20th | 0.60mi | 2/1.0 (-1) | 1,328 (-2%) | 8mo | $119,500 | $90 | 57 |
| 435 2nd St NE | 0.69mi | 3/1.0 | 1,300 (-4%) | 10mo | $50,000 | $38 | 53 |
| 1347 E Houston St | 0.46mi | 2/2.0 (-1) | 1,542 (+14%) | 2mo | $79,000 | $51 | 45 |
| 51 PR 43793 | 0.71mi | 3/2.0 | 1,392 (+3%) | 20mo | $249,900 | $180 | 41 |
| 145 NE 17th | 0.48mi | 2/1.0 (-1) | 1,184 (-13%) | 17mo | $65,000 | $55 | 37 |
| 2390 Ballard Dr | 0.74mi | 3/1.5 | 1,505 (+11%) | 10mo | $142,000 | $94 | 37 |
Match score weights: distance 35% · size 25% · config 20% · recency 20%. Top-matched comps best support the ARV.
Projected returns pro-forma
-3.0% appreciation · 3.0% rent growth · sell at horizon
- IRR
- 6.3%
- Equity multiple
- 1.24×
- Total profit
- $6,769
- Equity at exit
- $14,761
- IRR
- 15.7%
- Equity multiple
- 2.27×
- Total profit
- $35,324
- Equity at exit
- $8,560
Cash invested: $27,720 (down + closing). Projections, not guarantees.
Landlord ↔ Tenant lean methodology
- Overall (STATE)
- 87 Strongly Landlord-Friendly
- State Texas
- 87 Strongly Landlord-Friendly · R+5
- County
- — inherits STATE
- City
- — inherits STATE
ZIP-level market 75460
- Active inventory
- 274
- Price-to-rent
- 6.2×
Monthly cashflow live
- Estimated rent
- $1,320 high interval (Pro) →
- Mortgage (P&I)
- −$519
- Tax from tax record
- −$125 /mo · $1,495/yr
- Insurance
- −$41
- HOA
- −$0
- Vacancy / Maint / Mgmt
- −$277
- Net cashflow
- $358
Break-even live
UW: 25.0% down · 7.5% · 30yr · 1.5% tax · 5.0% vac · 8.0% maint · 8.0% mgmt
Financing live
Cash to close
- Down payment
- $24,750
- Closing costs
- $2,970
- Reserves months
- —
- Total cash needed
- —
Loan-product check · same deal, 3 products live
Conventional
25% down · 7.5% · 30yr
- Down + closing
- —
- Monthly P&I
- —
- Monthly cashflow
- —
- DSCR
- —
- Eligible?
- —
Personal DTI + credit; lowest rate.
DSCR
20% down · 8.5% · 30yr
- Down + closing
- —
- Monthly P&I
- —
- Monthly cashflow
- —
- DSCR
- —
- Eligible?
- —
No personal income docs; deal must DSCR.
Hard money
10% down · 12.0% · 12mo
- Down + closing
- —
- Monthly P&I
- —
- Monthly cashflow
- —
- DSCR
- —
- Eligible?
- —
Short-term bridge; refi at stabilization.
Rent comps 5 comps
| Address | Beds | Baths | Sqft | Rent | $/sqft | DOM | Units | Dist |
|---|---|---|---|---|---|---|---|---|
| 649 E Price St Paris, TX | 2.0 | 1.0 | 900 | $1,100 | $1.22 | 43d | 1 | 0.55mi |
| 2246 Simpson St Paris, TX | 3.0 | 1.0 | 1508 | $1,250 | $0.83 | 43d | 1 | 1.08mi |
| 370 29th St NE Paris, TX | 3.0 | 1.0 | 1220 | $1,200 | $0.98 | 43d | 1 | 1.14mi |
| 635 7th St SW Paris, TX | 1.0–4.0 | 1.0–2.0 | 903 | $1,250 | $1.38 | 43d | 16 | 1.22mi |
| 2121 Cedar St Paris, TX | 3.0 | 2.0 | 1394 | $2,000 | $1.43 | 43d | 1 | 1.31mi |
Listing history 17 events
-
2026-06-19days on market $99,000 Active 31 DOM
-
2026-06-18days on market $99,000 Active 30 DOM
-
2026-06-17days on market $99,000 Active 29 DOM
-
2026-06-16days on market $99,000 Active 28 DOM
-
2026-06-15days on market $99,000 Active 27 DOM
-
2026-06-14days on market $99,000 Active 25 DOM
-
2026-06-12days on market $99,000 Active 24 DOM
-
2026-06-09days on market $99,000 Active 21 DOM
-
2026-06-08days on market $99,000 Active 20 DOM
-
2026-06-07days on market $99,000 Active 19 DOM
-
2026-06-03days on market $99,000 Active 15 DOM
-
2026-06-02days on market $99,000 Active 14 DOM
-
2026-06-01days on market $99,000 Active 13 DOM
-
2026-05-31days on market $99,000 Active 12 DOM
-
2026-05-31days on market $99,000 Active 11 DOM
-
2026-05-19$99,000 Active
-
2007-10-16soldstatus
ⓘ Source: listings_history table (triggers on properties + properties_extension) + one-shot
backfill from property_details.listing_events for pre-trigger history.
Tax reassessment forecast TX · Resets to sale price
- Current annual tax
- $1,495 · $125/mo
- Projected year-2 tax
- $1,812 · $151/mo
- Expected delta
- +$317/yr (+$26/mo · 21.2%)
ⓘ Screening estimate from a state-policy table — verify with the county assessor before closing.
Climate risk First Street
- Flood 1/10 Low FEMA zone X (unshaded) · 0% chance over 30 yrs
- Wildfire 5/10 Major
- Heat 7/10 Severe 7 d/yr ≥110°F today · 20 d/yr by 30 yrs out
- Wind 4/10 Moderate 23% chance of damaging wind over 30 yrs
- Air quality 2/10 Low 0 unhealthy d/yr today · 1 by 30 yrs out
Nearby sold comps map
Loading sold comps map…
Walkable amenities ~0.75 mi
Loading nearby amenities…
Taxation est. · year 1
- Rental income
- $15,841
- − Mortgage interest
- −$5,546
- − Property taxes
- −$1,495
- − Insurance
- −$495
- − Repairs & maintenance
- −$1,267
- − Management
- −$1,267
- − Depreciation
- −$2,880
- Taxable income
- $2,891
- Est. tax owed @ 24.0%
- −$694
- After-tax cash flow
- $3,600/yr
For passive investors: Depreciation is non-cash, so a rental often shows a tax loss while cash-flowing — sheltering income. Rental losses are passive: they offset passive income freely, and up to $25,000/yr can offset ordinary (W-2) income if you actively participate and your MAGI is under $100k (phasing out to $0 by $150k); unused losses carry forward. On sale, claimed depreciation is recaptured at up to 25%, and gains may owe capital-gains tax (a 1031 exchange can defer both). Figures are a year-1 estimate at your 24.0% rate — not tax advice; consult a CPA.
Schools (NCES district)
- District
- Paris ISD
- NCES district ID
- 4834290
- Math proficiency
- 36% ▼ -11.00%
- Reading proficiency
- 37% ▼ -1.00%
- Median HH income
- $31,515
- Composite
- 29.83/100
- National rank
- #6419
- State rank
- #521 of 826 in TX
Livability — Paris
- Score
- 61/100
- State rank
- #984
- US rank
- #17535
Category grades
Schools grade is shown separately in the Schools card above.
Census & demographics
- Census place
- Paris, TX
- County
- Lamar County · 23,426 people
- City population
- 23,426
- Metro
- Paris, TX
- Population (ZIP)
- 23,426
- Household income
- $46,473
- Rent vs Own
- Severe rent burden
- 1355.0
Population outlook (Lamar County) Hauer SSP2
- Today (2025)
- 48,319 people
- By 2030
- 47,160 · -2.4%
- By 2040
- 44,621 · -7.7%
- By 2050
- 42,024 · -13.0%
- By 2075
- 36,577 · -24.3%
- By 2100
- 30,580 · -36.7%
Race, ethnicity, and origin ACS 2023
- Neighborhood character
- Diverse neighborhood (Simpson 0.60)
- Race & ethnicity
- White 58% Black 22% Hispanic / Latino 13% Two or more races 8%
- Hispanic origin (detail)
- Mexican 12%
- Common ancestry
- Lithuanian 1% Slovak 1% Italian 1%
- Foreign-born
- 3% · Canada, China
- Languages at home
- 92% English-only · Spanish 7%
Political lean MEDSL · Lamar
- 2024 margin
- Solid R (+61.0) · D 19.2% · R 80.3%
- 2008→2024 swing
- -19.1pp toward R · 2008: -42.0pp · 2024: -61.0pp
- All cycles
- 2024: R+61.0 2020: R+57.4 2016: R+59.2 2012: R+50.3 2008: R+42.0
Not yet ingested
- Civics
- —
Market trends
- HPI YoY
- ▼ -201.50%
- Current HPI
- 145.3511
- Rent YoY
- —
- Metro
- Paris, TX
- State GDP YoY
- ▲ 3.95%
- F500 in state
- 110
Industry mix (Fortune 500 HQ in TX)
| Industry | F500 HQs | Revenue |
|---|---|---|
| Energy | 16 | $1,198B |
|
||
| Technology | 5 | $198B |
|
||
| Engineering / Construction | 4 | $72B |
|
||
| Energy Services | 3 | $60B |
|
||
| Utilities | 3 | $41B |
|
||
| Healthcare | 2 | $330B |
|
||
Price history
2 events — show timeline
- 2026-05-19 Listed $99,000 NTREIS
- 2007-10-16 Sold (Public Records) — Public Records
Property tax history
+8.8%/yrLatest (2025): $1,495 · +6.5% YoY. Source: county tax records.
Cash-flow waterfall
monthlySold comps — $/sqft
last 12 mo · ≤1 miLoading sold comps…