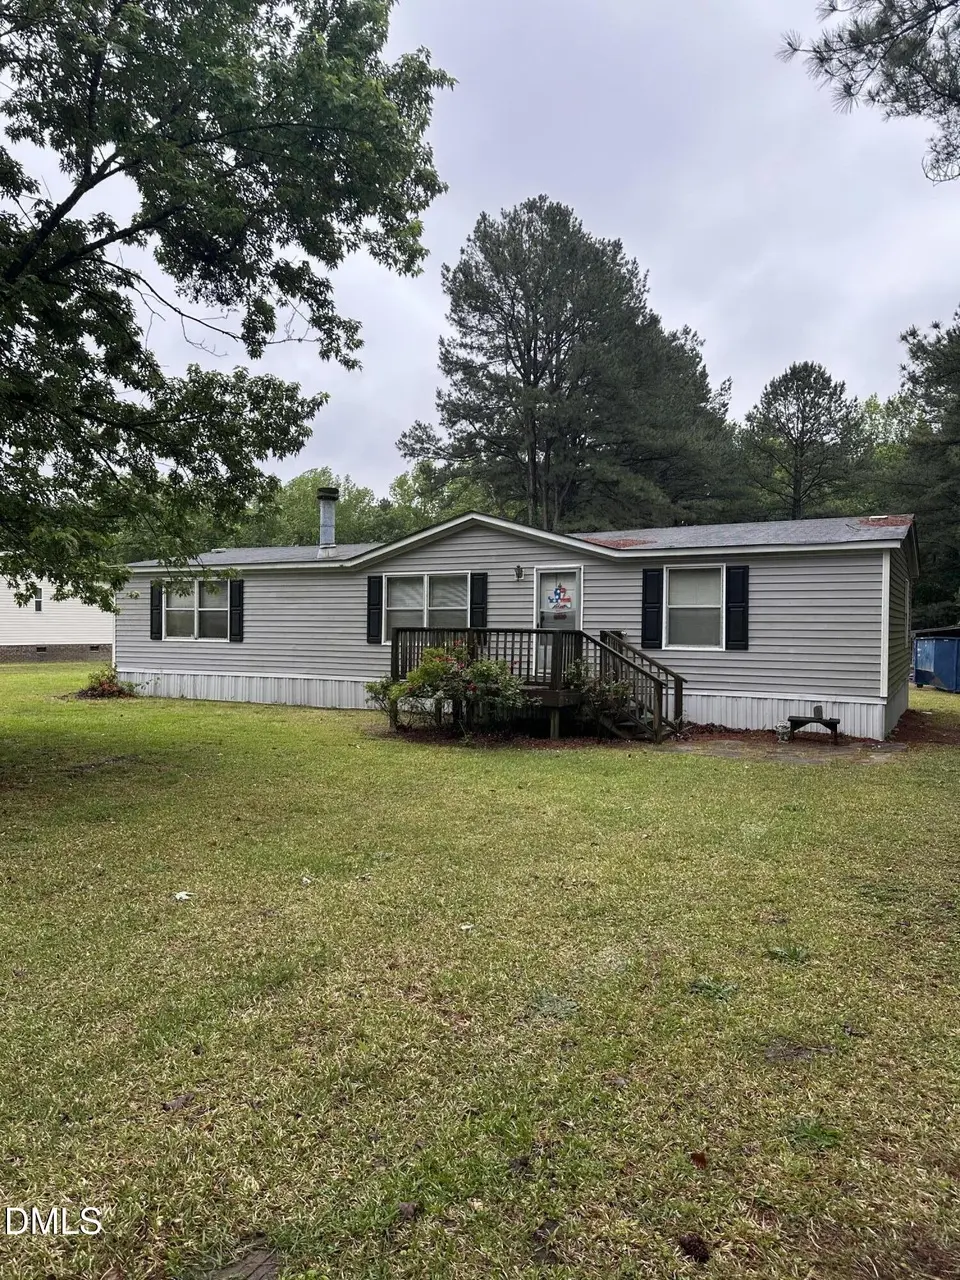
550 Phillips Rd · Selma, NC
Flood risk 1/10 · Minimal
- FEMA flood zone
- X (unshaded)
- Chance of flooding over 30 yrs
- 0.0%
- Est. flood insurance / yr
- $507 – $1,088
Fire risk 4/10 · Minor
- Est. fire insurance / yr
- $906 – $1,684
Heat risk 7/10 · Major
- Hot days now (above 106°F)
- 7 days/yr
- Hot days in 30 yrs
- 17 days/yr
Wind risk 6/10 · Moderate
- Chance of severe wind over 30 yrs
- 74.0%
Air-quality risk 2/10 · Minimal
- Unhealthy air days now
- 1 days/yr
- Unhealthy air days in 30 yrs
- 2 days/yr
Risk factors via First Street. Map © Google.
Why this score? — see what drove the C grade
The composite is a weighted blend of 9 inputs, each scored 0–100. Each bar is that input's sub-score; the figure is the points it added to the 100-point composite (weight × sub-score).
- Cash flow +24.8/30.0
- DSCR +8.0/10.0
- ARV discount +7.5/15.0
- 1% rule +5.2/10.0
- Schools +3.5/10.0
- Livability +2.8/5.0
- Rent growth +2.5/5.0
- Condition / age +2.5/5.0
- Appreciation +0.0/10.0
$168,000
🖨 Deal sheet 📄 Offer letter ✓ Due diligence
Listing remarks
Priced to sell! ''AS IS'' Discover peaceful country living at 550 Phillips Road -- a charming home surrounded by open space and Carolina skies. This property offers a comfortable layout with bright living areas, a welcoming kitchen, and plenty of outdoor room for gardening, entertaining, or simply relaxing. Conveniently located near Selma and Clayton with easy access to Hwy 70 and I-95, you'll enjoy the best of rural tranquility and modern convenience.
Key facts
- Welcoming kitchen
- Easy access
- Open space
Tags
Property features AI
Finance
- Other: Directions provided to property; Located in Johnston County
- Financial info: Annual tax available (not included per instructions)
- HOA & community: No homeowners association
Exterior
- Parking: No parking details provided
- Security: No security features provided
- Utilities: Public water; Septic system (septic tank) connected
- Home design: Manufactured house; One story, entry level 1; Rural/agricultural zoning (RAG)
- Construction: Vinyl siding; Shingle roof; Other type foundation; Built as a manufactured home
- Exterior features: 1.0 acre lot; County road frontage; Publicly maintained road access
Interior
- Kitchen: Kitchen with laundry area
- Bedrooms: Three bedrooms (all on the main level)
- Flooring: Carpet; Vinyl
- Bathrooms: Two full bathrooms
- Heating & cooling: Central electric heating; Central air conditioning with electric heat pump
- Interior features: Fixer condition; Shed(s) on the property
- Laundry & utility: Gas dryer hookup; Washer/dryer area located in the kitchen (inside)
Neighborhood map
What this means for you Summary
Snapshot
- This is a 3-bed/2.0-bath manufactured listed at $168k.
Deal economics
- At list price, monthly cash flow is $356 ($4k/yr) — positive.
- The deal already cash-flows at list — no discount required.
- Meets the 1% rule at list price ($2k rent vs $168k).
- Recommended offer: $163k (3.0% below list) — sets the bar for market timing.
- Cap rate 8.8% vs local median 2.6% in Selma — top-decile yield for the area; either an underpriced asset or a hidden risk that comps aren't pricing in. Stress-test before assuming the spread holds.
Location & tenants
- Location reads 55/100 on livability (#641 in NC) — a working-class tenant base; expect higher turnover. Strengths: cost of living A+, health & safety B+, housing B; Watch: crime F, amenities F, commute F.
- Johnston County Public Schools (rural): math 39% / reading 42% proficiency, ranked #105 of 178 in NC (top 59%) — families likely to look elsewhere, expect single-tenant / working-renter base with shorter leases.
- Zoned schools: Corinth Holders High (math 50% / reading 61%, grade C, #265 of 535 statewide, top 50%, 2,219 students, 32% FRL).
- Zoned-school proficiency averages 56% at this address vs 40% district-wide (+15 pts) — the actual schools serving this property are materially stronger than the Johnston County Public Schools average implies; a family-tenant draw the district grade alone would hide.
- Market conditions: 274 active listings in the ZIP; 2,783 units permitted in Johnston County in 2024 (6 in 5+ unit buildings).
- This rent runs 31% of the median local income ($67k/yr) — at the standard rent-burdened threshold; future hikes will face affordability resistance.
Forward outlook
- Local home prices are declining (-3.0%/yr); year-one equity from $1k of loan paydown is wiped out by about $5k of value loss. Plan a longer hold.
- Johnston County population projected at +37% by 2050 — long-run rental-demand tailwind backs the buy-and-hold thesis.
Negotiation context
- It's been on market 39 days — a 3% lower offer ($163k) is reasonable based on typical stale-listing flexibility.
- Current owner paid $19k; list at $168k implies a 784% gain — meaningful room to come down on a strong offer.
Risks & watch-outs
- Climate carrying-cost: major wind risk, 74% chance of damaging wind over 30y; extreme-heat days projected 7→17/yr by 2055 (HVAC capex compounding) — expect insurance premiums to compound above CPI over the hold.
Questions for the listing agent
- It's been on market 39 days. Have you received any prior offers? Is the seller open to a 3% concession, seller financing, or rate buy-down credit?
- Is there a deadline driving the sale (1031 exchange, divorce, estate, relocation)? That informs how much negotiation room exists.
- Schools are F-rated, which usually means shorter tenancies and higher turnover. Who's the typical renter profile here, and what's been the actual vacancy rate?
- Crime grade is F in this area — have there been break-ins, vandalism, or insurance claims at this property in the last 3 years? What carrier currently insures it and at what premium?
- What's the average days-on-market for RENTAL listings here right now (not sales)? A rising rental-DOM trend means longer vacancies and softer asking-rent achievability than the comps imply.
- What's the recent tenant-quality profile in this submarket — average credit score on applications, eviction rate, late-payment / NSF rate, and stable-employment percentage? A property-management company in the area should have these aggregated.
- How much new for-sale + rental construction is in the pipeline within 1–3 miles? Heavy new supply typically softens prices + rents 12–24 months out; constrained supply supports both.
Investment metrics
- 1% rule
- 1.02% ✓
- Cap rate
- 8.84%
- Cash-on-cash
- 9.08%
- DSCR
- 1.40
- GRM
- 8.2
CMA / ARV
No comps found within radius.
Projected returns pro-forma
-3.0% appreciation · 3.0% rent growth · sell at horizon
- IRR
- -2.6%
- Equity multiple
- 0.90×
- Total profit
- $-4,630
- Equity at exit
- $25,049
- IRR
- 7.0%
- Equity multiple
- 1.53×
- Total profit
- $24,844
- Equity at exit
- $14,526
Cash invested: $47,040 (down + closing). Projections, not guarantees.
Landlord ↔ Tenant lean methodology
- Overall (STATE)
- 85 Strongly Landlord-Friendly
- State North Carolina
- 85 Strongly Landlord-Friendly · R+3
- County
- — inherits STATE
- City
- — inherits STATE
ZIP-level market 27576
- Home prices YoY
- -23.1%
- Active inventory
- 274
- Price-to-rent
- 8.2×
Monthly cashflow live
- Estimated rent
- $1,707 medium interval (Pro) →
- Mortgage (P&I)
- −$881
- Tax from tax record
- −$42 /mo · $499/yr
- Insurance
- −$70
- HOA
- −$0
- Vacancy / Maint / Mgmt
- −$358
- Net cashflow
- $356
Break-even live
UW: 25.0% down · 7.5% · 30yr · 1.5% tax · 5.0% vac · 8.0% maint · 8.0% mgmt
Financing live
Cash to close
- Down payment
- $42,000
- Closing costs
- $5,040
- Reserves months
- —
- Total cash needed
- —
Loan-product check · same deal, 3 products live
Conventional
25% down · 7.5% · 30yr
- Down + closing
- —
- Monthly P&I
- —
- Monthly cashflow
- —
- DSCR
- —
- Eligible?
- —
Personal DTI + credit; lowest rate.
DSCR
20% down · 8.5% · 30yr
- Down + closing
- —
- Monthly P&I
- —
- Monthly cashflow
- —
- DSCR
- —
- Eligible?
- —
No personal income docs; deal must DSCR.
Hard money
10% down · 12.0% · 12mo
- Down + closing
- —
- Monthly P&I
- —
- Monthly cashflow
- —
- DSCR
- —
- Eligible?
- —
Short-term bridge; refi at stabilization.
Listing history 17 events
-
2026-06-18days on market $168,000 Active 39 DOM
-
2026-06-17days on market $168,000 Active 38 DOM
-
2026-06-16days on market $168,000 Active 37 DOM
-
2026-06-15days on market $168,000 Active 36 DOM
-
2026-06-13days on market $168,000 Active 34 DOM
-
2026-06-13days on market $168,000 Active 33 DOM
-
2026-06-10price $168,000 Active 30 DOM
-
2026-06-09days on market $190,000 Active 30 DOM
-
2026-06-08days on market $190,000 Active 29 DOM
-
2026-06-07days on market $190,000 Active 28 DOM
-
2026-06-05days on market $190,000 Active 25 DOM
-
2026-06-03days on market $190,000 Active 24 DOM
-
2026-06-02days on market $190,000 Active 23 DOM
-
2026-06-01days on market $190,000 Active 22 DOM
-
2026-05-31days on market $190,000 Active 21 DOM
-
2026-05-10$190,000 Active
-
2003-05-01soldstatus $19,000
ⓘ Source: listings_history table (triggers on properties + properties_extension) + one-shot
backfill from property_details.listing_events for pre-trigger history.
Tax reassessment forecast NC · Resets to sale price
- Current annual tax
- $499 · $42/mo
- Projected year-2 tax
- $1,378 · $115/mo
- Expected delta
- +$879/yr (+$73/mo · 176.3%)
ⓘ Screening estimate from a state-policy table — verify with the county assessor before closing.
Climate risk First Street
- Flood 1/10 Low FEMA zone X (unshaded) · 0% chance over 30 yrs
- Wildfire 4/10 Moderate
- Heat 7/10 Severe 7 d/yr ≥106°F today · 17 d/yr by 30 yrs out
- Wind 6/10 Major 74% chance of damaging wind over 30 yrs
- Air quality 2/10 Low 1 unhealthy d/yr today · 2 by 30 yrs out
Nearby sold comps map
Loading sold comps map…
Walkable amenities ~0.75 mi
Loading nearby amenities…
Taxation est. · year 1
- Rental income
- $20,484
- − Mortgage interest
- −$9,411
- − Property taxes
- −$499
- − Insurance
- −$840
- − Repairs & maintenance
- −$1,639
- − Management
- −$1,639
- − Depreciation
- −$4,887
- Taxable income
- $1,570
- Est. tax owed @ 24.0%
- −$377
- After-tax cash flow
- $3,895/yr
For passive investors: Depreciation is non-cash, so a rental often shows a tax loss while cash-flowing — sheltering income. Rental losses are passive: they offset passive income freely, and up to $25,000/yr can offset ordinary (W-2) income if you actively participate and your MAGI is under $100k (phasing out to $0 by $150k); unused losses carry forward. On sale, claimed depreciation is recaptured at up to 25%, and gains may owe capital-gains tax (a 1031 exchange can defer both). Figures are a year-1 estimate at your 24.0% rate — not tax advice; consult a CPA.
Schools (NCES district)
- District
- Johnston County Public Schools
- NCES district ID
- 3702370
- Math proficiency
- 39% ▲ 4.00%
- Reading proficiency
- 42% ▲ 2.00%
- Median HH income
- $50,912
- Composite
- 34.99/100
- National rank
- #5052
- State rank
- #105 of 178 in NC
Livability — Selma
- Score
- 55/100
- State rank
- #641
- US rank
- #23364
Category grades
Schools grade is shown separately in the Schools card above.
Census & demographics
- County
- Johnston County · 175,441 people
- City population
- 21,624
- Metro
- Raleigh-Cary, NC
- Population (ZIP)
- 21,624
- Household income
- $66,831
- Rent vs Own
- Severe rent burden
- 649.0
Population outlook (Johnston County) Hauer SSP2
- Today (2025)
- 222,440 people
- By 2030
- 240,227 · +8.0%
- By 2040
- 274,616 · +23.5%
- By 2050
- 304,915 · +37.1%
- By 2075
- 369,507 · +66.1%
- By 2100
- 406,280 · +82.6%
Race, ethnicity, and origin ACS 2023
- Neighborhood character
- Diverse neighborhood (Simpson 0.64)
- Race & ethnicity
- White 49% Hispanic / Latino 27% Black 21% Two or more races 6% Native American 2%
- Hispanic origin (detail)
- Mexican 18% Puerto Rican 3%
- Common ancestry
- Slovak 1% Serbian 1% Iranian 1%
- Foreign-born
- 12% · Canada
- Languages at home
- 76% English-only · Spanish 23% German/W. Germanic 1%
Political lean MEDSL · Johnston
- 2024 margin
- Strong R (+21.5) · D 38.7% · R 60.2% · Other 1.1%
- 2008→2024 swing
- +2.2pp toward D · 2008: -23.7pp · 2024: -21.5pp
- All cycles
- 2024: R+21.5 2020: R+24.3 2016: R+30.7 2012: R+27.8 2008: R+23.7
Not yet ingested
- Civics
- —
Market trends
- HPI YoY
- ▼ -70.48%
- Current HPI
- 234.1407
- Rent YoY
- —
- Metro
- Raleigh-Cary, NC
- State GDP YoY
- ▲ 3.28%
- F500 in state
- 26
Industry mix (Fortune 500 HQ in NC)
| Industry | F500 HQs | Revenue |
|---|---|---|
| Financial Services | 2 | $213B |
|
||
| Retail | 2 | $95B |
|
||
| Industrial Conglomerate | 1 | $38B |
|
||
| Metals / Steel | 1 | $35B |
|
||
| Utilities | 1 | $30B |
|
||
| Industrial Machinery | 1 | $19B |
|
||
Price history
+900.0% since first listed2 events — show timeline
- 2026-05-10 Listed $190,000 TMLS
- 2003-05-01 Sold (Public Records) $19,000 Public Records
Property tax history
+0.2%/yrLatest (2025): $499 · +69.0% YoY. Source: county tax records.
Cash-flow waterfall
monthlySold comps — $/sqft
last 12 mo · ≤1 miLoading sold comps…