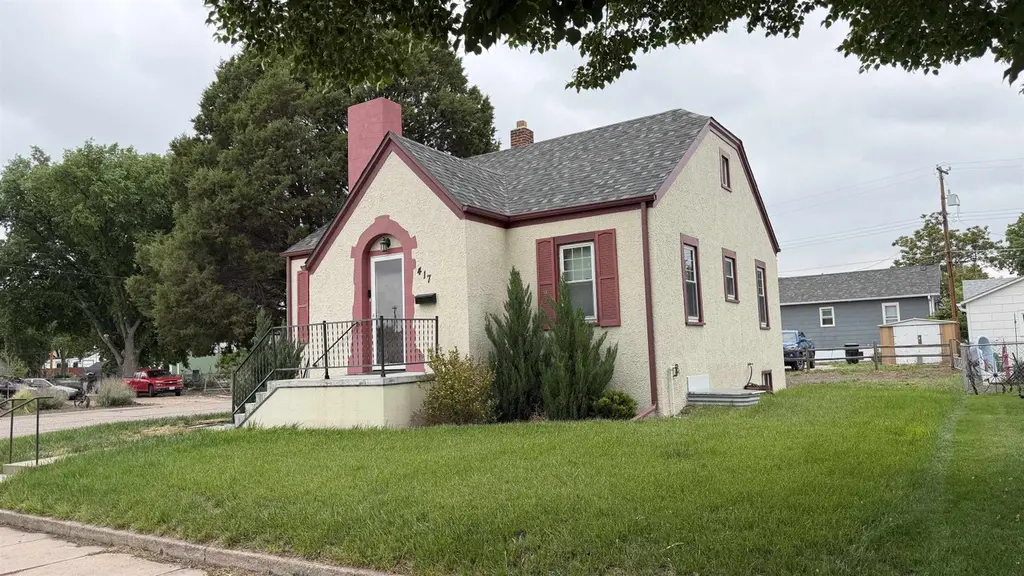
417 W 7th St · Ogallala, NE
Flood risk 1/10 · Minimal
- FEMA flood zone
- X (unshaded)
- Chance of flooding over 30 yrs
- 0.0%
- Est. flood insurance / yr
- $473 – $860
Fire risk 5/10 · Moderate
- Est. fire insurance / yr
- $1,161 – $2,155
Heat risk 3/10 · Minor
- Hot days now (above 98°F)
- 7 days/yr
- Hot days in 30 yrs
- 17 days/yr
Wind risk 2/10 · Minimal
- Chance of severe wind over 30 yrs
- —
Air-quality risk 1/10 · Minimal
- Unhealthy air days now
- 0 days/yr
- Unhealthy air days in 30 yrs
- 0 days/yr
Risk factors via First Street. Map © Google.
Why this score? — see what drove the C- grade
The composite is a weighted blend of 9 inputs, each scored 0–100. Each bar is that input's sub-score; the figure is the points it added to the 100-point composite (weight × sub-score).
- Cash flow +14.6/30.0
- Appreciation +10.0/10.0
- ARV discount +7.5/15.0
- DSCR +4.5/10.0
- Schools +4.0/10.0
- Livability +3.5/5.0
- 1% rule +2.9/10.0
- Rent growth +2.5/5.0
- Condition / age +2.5/5.0
$222,000
🖨 Deal sheet 📄 Offer letter ✓ Due diligence
Listing remarks
Welcome home to this beautifully updated 1939 charmer located on a desirable 20' x 125' corner lot in Ogallala, this property offers excellent curb appeal, ample outdoor space, and a location that's convenient to schools, parks, and local amenities. Built in 1939, the home retains the charm and quality construction of its era while providing updates today's buyers are looking for.
Key facts
- Convenient to parks
- Outdoor space
- Corner lot
Tags
Property features AI
Exterior
- Utilities: Public water; Public sewer; Natural gas available
- Home design: Single-family residential
- Construction: Stucco exterior
- Exterior features: Shed(s); Lot approx. 50' x 125'
Interior
- Kitchen: Dishwasher; Disposal; Gas range; Microwave; Refrigerator
- Bedrooms: 2 main-level bedrooms
- Bathrooms: 1 main-level bathroom
- Heating & cooling: Central air conditioning
- Interior features: Window coverings; Finished full basement
- Laundry & utility: Laundry in basement
Neighborhood map
What this means for you Summary
Snapshot
- This is a 2-bed/2.0-bath single-family listed at $222k.
Deal economics
- At list price, monthly cash flow is $53 ($640/yr) — positive.
- The deal already cash-flows at list — no discount required.
- To meet the 1% rule (rent ≥ 1% of price), the offer needs to be $175k (21.2% below list).
- Recommended offer: $175k (21.2% below list) — sets the bar for 1% rule.
Location & tenants
- Location reads 70/100 on livability (#223 in NE) — a middle-class / working-renter tenant base. Strengths: cost of living A+, housing A+, health & safety A+; Watch: employment D, amenities F, commute F.
- Ogallala Public Schools (town): math 45% / reading 49% proficiency, ranked #78 of 111 in NE (top 70%) — families likely to look elsewhere, expect single-tenant / working-renter base with shorter leases.
- Market conditions: 10 active listings in the ZIP; 1 comparable units currently listed for rent nearby; 38 units permitted in Keith County in 2024 (0 in 5+ unit buildings).
Forward outlook
- In year one you build about $24k of equity ($2k loan paydown + $22k appreciation (10.0% local appreciation)).
- Keith County population projected at -10% by 2050 — secular population decline; favor cash flow + early exit over multi-decade hold.
- At projected returns (10.0% appreciation + 3.0% rent growth), your $62k cash investment doubles in ~3 years — after that, you're playing with house money.
- By year 2, paydown + projected appreciation supports a ~$38k cash-out refi (75% LTV) — recoverable capital for the next deal without selling this one.
Negotiation context
- It's been on market 15 days — a 2% lower offer ($219k) is reasonable based on typical stale-listing flexibility.
Risks & watch-outs
- Watch-outs: built in 1939 — expect roof / HVAC / electrical / plumbing capex.
- Climate carrying-cost: moderate wildfire risk — expect insurance premiums to compound above CPI over the hold.
Questions for the listing agent
- Built in 1939 — when were the roof, HVAC, electrical panel, plumbing, and water heater last replaced?
- Is there a deadline driving the sale (1031 exchange, divorce, estate, relocation)? That informs how much negotiation room exists.
- What's the average days-on-market for RENTAL listings here right now (not sales)? A rising rental-DOM trend means longer vacancies and softer asking-rent achievability than the comps imply.
- What's the recent tenant-quality profile in this submarket — average credit score on applications, eviction rate, late-payment / NSF rate, and stable-employment percentage? A property-management company in the area should have these aggregated.
- How much new for-sale + rental construction is in the pipeline within 1–3 miles? Heavy new supply typically softens prices + rents 12–24 months out; constrained supply supports both.
Investment metrics
- 1% rule
- 0.79% ✗
- Cap rate
- 6.58%
- Cash-on-cash
- 1.03%
- DSCR
- 1.05
- GRM
- 10.6
CMA / ARV
- ARV (on-the-fly)
- $141,328
- Comps found
- 2
Show comp detail 2 sales within ~0.75 mi
| Address | Dist | Beds/Ba | Sqft | Sold | Price | $/sf | Match |
|---|---|---|---|---|---|---|---|
| 811 W B St | 0.15mi | 2/1.0 | 1,124 (-4%) | 13mo | $136,500 | $121 | 72 |
| 305 E 5th St | 0.39mi | 3/1.0 (+1) | 1,250 (+7%) | 11mo | $145,000 | $116 | 52 |
Match score weights: distance 35% · size 25% · config 20% · recency 20%. Top-matched comps best support the ARV.
Projected returns pro-forma
10.0% appreciation · 3.0% rent growth · sell at horizon
- IRR
- 25.0%
- Equity multiple
- 3.00×
- Total profit
- $124,203
- Equity at exit
- $199,995
- IRR
- 22.0%
- Equity multiple
- 6.84×
- Total profit
- $362,889
- Equity at exit
- $431,297
Cash invested: $62,160 (down + closing). Projections, not guarantees.
Landlord ↔ Tenant lean methodology
- Overall (STATE)
- 83 Strongly Landlord-Friendly
- State Nebraska
- 83 Strongly Landlord-Friendly · R+13
- County
- — inherits STATE
- City
- — inherits STATE
ZIP-level market 69153
- Home prices YoY
- 8.5%
- Active inventory
- 10
- Price-to-rent
- 10.6×
Monthly cashflow live
- Estimated rent
- $1,750 medium interval (Pro) →
- Mortgage (P&I)
- −$1,164
- Tax from tax record
- −$72 /mo · $870/yr
- Insurance
- −$92
- HOA
- −$0
- Vacancy / Maint / Mgmt
- −$368
- Net cashflow
- $53
Break-even live
UW: 25.0% down · 7.5% · 30yr · 1.5% tax · 5.0% vac · 8.0% maint · 8.0% mgmt
Financing live
Cash to close
- Down payment
- $55,500
- Closing costs
- $6,660
- Reserves months
- —
- Total cash needed
- —
Loan-product check · same deal, 3 products live
Conventional
25% down · 7.5% · 30yr
- Down + closing
- —
- Monthly P&I
- —
- Monthly cashflow
- —
- DSCR
- —
- Eligible?
- —
Personal DTI + credit; lowest rate.
DSCR
20% down · 8.5% · 30yr
- Down + closing
- —
- Monthly P&I
- —
- Monthly cashflow
- —
- DSCR
- —
- Eligible?
- —
No personal income docs; deal must DSCR.
Hard money
10% down · 12.0% · 12mo
- Down + closing
- —
- Monthly P&I
- —
- Monthly cashflow
- —
- DSCR
- —
- Eligible?
- —
Short-term bridge; refi at stabilization.
Rent comps 1 comps
| Address | Beds | Baths | Sqft | Rent | $/sqft | DOM | Units | Dist |
|---|---|---|---|---|---|---|---|---|
| 320 E F St Ogallala, NE | 2.0 | 1.5 | 1365 | $1,750 | $1.28 | 43d | 1 | 0.66mi |
Listing history 12 events
-
2026-06-18days on market $222,000 Active 15 DOM
-
2026-06-17days on market $222,000 Active 14 DOM
-
2026-06-16days on market $222,000 Active 13 DOM
-
2026-06-15days on market $222,000 Active 12 DOM
-
2026-06-13days on market $222,000 Active 10 DOM
-
2026-06-12days on market $222,000 Active 9 DOM
-
2026-06-09days on market $222,000 Active 6 DOM
-
2026-06-08days on market $222,000 Active 5 DOM
-
2026-06-07days on market $222,000 Active 4 DOM
-
2026-06-07days on market $222,000 Active 3 DOM
-
2026-06-04remarks 383-char remark
-
2026-06-04$222,000 Active 1 DOM
ⓘ Source: listings_history table (triggers on properties + properties_extension) + one-shot
backfill from property_details.listing_events for pre-trigger history.
Tax reassessment forecast NE · Resets to sale price
- Current annual tax
- $870 · $72/mo
- Projected year-2 tax
- $3,841 · $320/mo
- Expected delta
- +$2,971/yr (+$248/mo · 341.5%)
ⓘ Screening estimate from a state-policy table — verify with the county assessor before closing.
Climate risk First Street
- Flood 1/10 Low FEMA zone X (unshaded) · 0% chance over 30 yrs
- Wildfire 5/10 Major
- Heat 3/10 Moderate 7 d/yr ≥98°F today · 17 d/yr by 30 yrs out
- Wind 2/10 Low
- Air quality 1/10 Low 0 unhealthy d/yr today · 0 by 30 yrs out
Nearby sold comps map
Loading sold comps map…
Walkable amenities ~0.75 mi
Loading nearby amenities…
Taxation est. · year 1
- Rental income
- $21,000
- − Mortgage interest
- −$12,435
- − Property taxes
- −$870
- − Insurance
- −$1,110
- − Repairs & maintenance
- −$1,680
- − Management
- −$1,680
- − Depreciation
- −$6,458
- Taxable loss
- −$3,234
- Est. tax savings @ 24.0%
- +$776
- After-tax cash flow
- $1,416/yr
For passive investors: Depreciation is non-cash, so a rental often shows a tax loss while cash-flowing — sheltering income. Rental losses are passive: they offset passive income freely, and up to $25,000/yr can offset ordinary (W-2) income if you actively participate and your MAGI is under $100k (phasing out to $0 by $150k); unused losses carry forward. On sale, claimed depreciation is recaptured at up to 25%, and gains may owe capital-gains tax (a 1031 exchange can defer both). Figures are a year-1 estimate at your 24.0% rate — not tax advice; consult a CPA.
Schools (NCES district)
- District
- Ogallala Public Schools
- NCES district ID
- 3174760
- Math proficiency
- 45% ▼ -4.00%
- Reading proficiency
- 49% ▲ 2.00%
- Median HH income
- $42,347
- Composite
- 39.56/100
- National rank
- #3934
- State rank
- #78 of 111 in NE
Livability — Ogallala
- Score
- 70/100
- State rank
- #223
- US rank
- #7929
Category grades
Schools grade is shown separately in the Schools card above.
Census & demographics
- Census place
- Ogallala, NE
- Population (ZIP)
- 5,968
Population outlook (Keith County) Hauer SSP2
- Today (2025)
- 7,706 people
- By 2030
- 7,508 · -2.6%
- By 2040
- 7,139 · -7.4%
- By 2050
- 6,916 · -10.3%
- By 2075
- 6,810 · -11.6%
- By 2100
- 6,635 · -13.9%
Race, ethnicity, and origin ACS 2023
- Neighborhood character
- Predominantly White (83%)
- Race & ethnicity
- White 83% Hispanic / Latino 11% Two or more races 9% Black 2%
- Hispanic origin (detail)
- Mexican 8%
- Common ancestry
- Lithuanian 5% Italian 3% Portuguese 2%
- Foreign-born
- 3% · Canada
- Languages at home
- 93% English-only · Spanish 5%
Political lean MEDSL · Keith
- 2024 margin
- Solid R (+63.9) · D 17.4% · R 81.3% · Other 1.2%
- 2008→2024 swing
- -14.3pp toward R · 2008: -49.6pp · 2024: -63.9pp
- All cycles
- 2024: R+63.9 2020: R+63.7 2016: R+67.0 2012: R+52.6 2008: R+49.6
Not yet ingested
- Civics
- —
Market trends
- HPI YoY
- ▲ 25.15%
- Current HPI
- 321.546
- Rent YoY
- —
- Metro
- —
- State GDP YoY
- ▲ 0.68%
- F500 in state
- 2
Industry mix (Fortune 500 HQ in NE)
| Industry | F500 HQs | Revenue |
|---|---|---|
| Conglomerate | 1 | $371B |
|
||
Price history
+387.9% since first listed5 events — show timeline
- 2026-06-02 Listed $222,000 LCBR
- 2024-07-09 Sold (Public Records) $210,000 Public Records
- 2021-07-01 Sold (Public Records) $110,000 Public Records
- 2016-06-23 Sold (Public Records) $55,000 Public Records
- 2002-03-25 Sold (Public Records) $45,500 Public Records
Property tax history
-0.8%/yrLatest (2025): $870 · -4.1% YoY. Source: county tax records.
Cash-flow waterfall
monthlySold comps — $/sqft
last 12 mo · ≤1 miLoading sold comps…