7043 Highway 32 · Orland, CA
Flood risk 6/10 · Moderate
- FEMA flood zone
- X (unshaded)
- Chance of flooding over 30 yrs
- 0.69%
- Est. flood insurance / yr
- $507 – $1,088
Fire risk 7/10 · Major
- Est. fire insurance / yr
- $659 – $1,223
Heat risk 7/10 · Major
- Hot days now (above 105°F)
- 7 days/yr
- Hot days in 30 yrs
- 15 days/yr
Wind risk 1/10 · Minimal
- Chance of severe wind over 30 yrs
- —
Air-quality risk 10/10 · Severe
- Unhealthy air days now
- 36 days/yr
- Unhealthy air days in 30 yrs
- 38 days/yr
Risk factors via First Street. Map © Google.
Why this score? — see what drove the B- grade
The composite is a weighted blend of 9 inputs, each scored 0–100. Each bar is that input's sub-score; the figure is the points it added to the 100-point composite (weight × sub-score).
- Cash flow +30.0/30.0
- 1% rule +10.0/10.0
- DSCR +10.0/10.0
- ARV discount +7.5/15.0
- Condition / age +3.8/5.0
- Livability +2.9/5.0
- Rent growth +2.5/5.0
- Schools +1.6/10.0
- Appreciation +0.0/10.0
$37,000
🖨 Deal sheet 📄 Offer letter ✓ Due diligence
Listing remarks
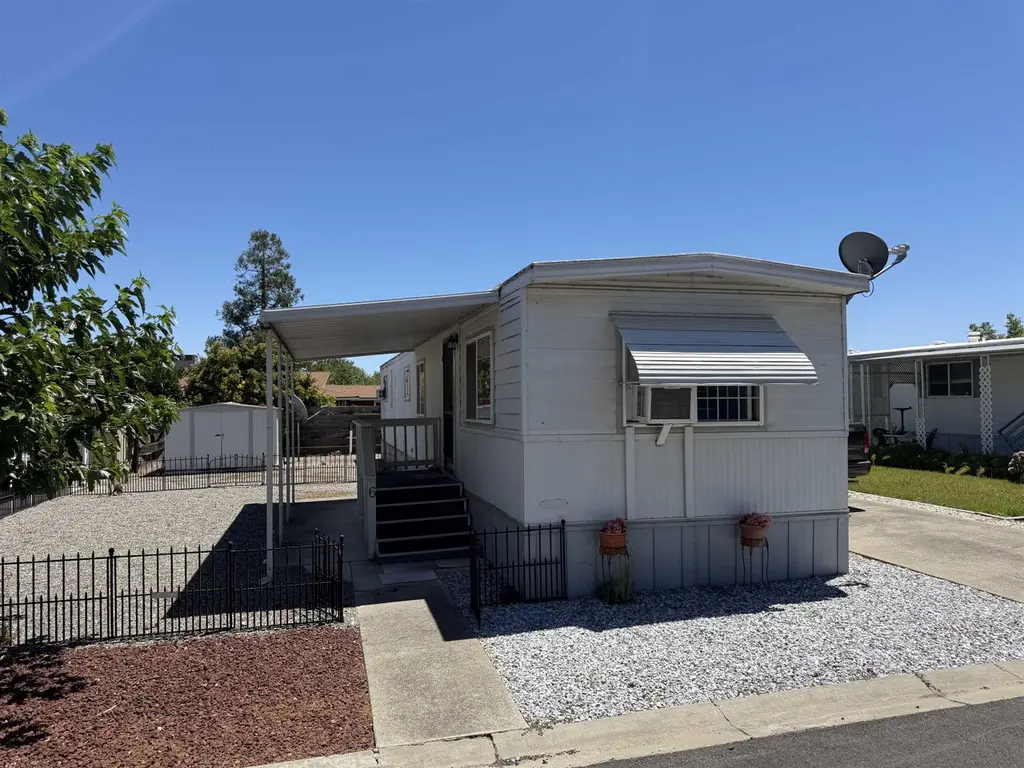
Beautifully updated and lovingly maintained, this 2-bedroom, 1-bath home is located in the highly desirable Country Leisure Estates, a well-kept 55+ community in Orland. Over the past few years, the home has received a thoughtful series of upgrades, giving it a fresh, modern feel. Recent improvements include dual-pane windows, a new energy-efficient heater, custom stainless-steel farmhouse sink, updated exhaust fan, garbage disposal, and stylish interior and exterior light fixtures. The home was professionally painted inside and out around 2021, and new floor coverings were installed, creating a clean and inviting interior. Step outside to a low maintenance peaceful backyard retreat with am
Key facts
- Garbage disposal
- Dual-pane windows
- Storage shed
Tags
Property features AI
Exterior
- Parking: Concrete parking; No designated garage
- Utilities: Electricity available; Natural gas available
- Home design: Manufactured home; Residential property; Zoning: R-1
- Construction: Metal siding; 60-foot mobile home
- Exterior features: Covered porch; Shed(s)
Interior
- Kitchen: Gas oven; Gas range
- Bathrooms: 1 full bathroom
- Heating & cooling: Wall furnace heating; Wall/window air conditioning units
- Interior features: Double-pane windows; Gas oven, Gas range
- Laundry & utility: Electric dryer hookup
Neighborhood map
What this means for you Summary
Snapshot
- This is a 2-bed/1.0-bath manufactured listed at $37k. Condition is rated good.
Deal economics
- At list price, monthly cash flow is $874 ($10k/yr) — positive.
- The deal already cash-flows at list — no discount required.
- Meets the 1% rule at list price ($1k rent vs $37k).
- Cap rate 34.7% vs local median 2.7% in Orland — top-decile yield for the area; either an underpriced asset or a hidden risk that comps aren't pricing in. Stress-test before assuming the spread holds.
Location & tenants
- Location reads 58/100 on livability (#718 in CA) — a working-class tenant base; expect higher turnover. Strengths: housing A-, crime B; Watch: schools C-, employment C-, amenities F.
- Orland Joint Unified (town): math 12% / reading 25% proficiency, ranked #476 of 517 in CA (top 92%) — low school quality limits family demand, transient renter base, plan for 1-2y turnover; 68% free/reduced lunch — lower-income household profile, screen leases tightly.
- Market conditions: 51 active listings in the ZIP; 108 units permitted in Glenn County in 2024 (61 in 5+ unit buildings).
Forward outlook
- Local home prices are declining (-3.0%/yr); year-one equity from $256 of loan paydown is wiped out by about $1k of value loss. Plan a longer hold.
- Glenn County population projected to shrink 6% by 2050 — rents likely to lag national; underwrite the cash flow, not the appreciation.
- At projected returns (-3.0% appreciation + 3.0% rent growth), your $10k cash investment doubles in ~2 years — after that, you're playing with house money.
Negotiation context
- Only 7 days on market — expect competitive offers; lowballing is unlikely to land.
- 4 sale attempts with the ask held roughly flat each time — persistent listings suggest the price (not the market) is what's stuck; bring a comps-based counter.
Risks & watch-outs
- Climate carrying-cost: major flood risk; major wildfire risk; extreme-heat days projected 7→15/yr by 2055 (HVAC capex compounding) — expect insurance premiums to compound above CPI over the hold.
Questions for the listing agent
- Built in 1972 — when were the roof, HVAC, electrical panel, plumbing, and water heater last replaced?
- Is there a deadline driving the sale (1031 exchange, divorce, estate, relocation)? That informs how much negotiation room exists.
- What's the average days-on-market for RENTAL listings here right now (not sales)? A rising rental-DOM trend means longer vacancies and softer asking-rent achievability than the comps imply.
- What's the recent tenant-quality profile in this submarket — average credit score on applications, eviction rate, late-payment / NSF rate, and stable-employment percentage? A property-management company in the area should have these aggregated.
- How much new for-sale + rental construction is in the pipeline within 1–3 miles? Heavy new supply typically softens prices + rents 12–24 months out; constrained supply supports both.
Investment metrics
- 1% rule
- 3.87% ✓
- Cap rate
- 34.65%
- Cash-on-cash
- 101.29%
- DSCR
- 5.51
- GRM
- 2.2
CMA / ARV
No comps found within radius.
Projected returns pro-forma
-3.0% appreciation · 3.0% rent growth · sell at horizon
- IRR
- —
- Equity multiple
- 5.80×
- Total profit
- $49,720
- Equity at exit
- $5,517
- IRR
- —
- Equity multiple
- 12.11×
- Total profit
- $115,099
- Equity at exit
- $3,199
Cash invested: $10,360 (down + closing). Projections, not guarantees.
Landlord ↔ Tenant lean methodology
- Overall (STATE)
- 18 Strongly Tenant-Friendly
- State California
- 18 Strongly Tenant-Friendly · D+13
- County
- — inherits STATE
- City
- — inherits STATE
ZIP-level market 95963
- Active inventory
- 51
- Price-to-rent
- 2.2×
Monthly cashflow live
- Estimated rent
- $1,431 medium interval (Pro) →
- Mortgage (P&I)
- −$194
- Tax est. 1.5%
- −$46 /mo · $555/yr
- Insurance
- −$15
- HOA
- −$0
- Vacancy / Maint / Mgmt
- −$300
- Net cashflow
- $874
Break-even live
UW: 25.0% down · 7.5% · 30yr · 1.5% tax · 5.0% vac · 8.0% maint · 8.0% mgmt
Financing live
Cash to close
- Down payment
- $9,250
- Closing costs
- $1,110
- Reserves months
- —
- Total cash needed
- —
Loan-product check · same deal, 3 products live
Conventional
25% down · 7.5% · 30yr
- Down + closing
- —
- Monthly P&I
- —
- Monthly cashflow
- —
- DSCR
- —
- Eligible?
- —
Personal DTI + credit; lowest rate.
DSCR
20% down · 8.5% · 30yr
- Down + closing
- —
- Monthly P&I
- —
- Monthly cashflow
- —
- DSCR
- —
- Eligible?
- —
No personal income docs; deal must DSCR.
Hard money
10% down · 12.0% · 12mo
- Down + closing
- —
- Monthly P&I
- —
- Monthly cashflow
- —
- DSCR
- —
- Eligible?
- —
Short-term bridge; refi at stabilization.
Listing history 7 events
-
2026-06-19days on market $37,000 Active 7 DOM
-
2026-06-18days on market $37,000 Active 6 DOM
-
2026-06-17days on market $37,000 Active 5 DOM
-
2026-06-16days on market $37,000 Active 4 DOM
-
2026-06-15days on market $37,000 Active 3 DOM
-
2026-06-13remarks 699-char remark
-
2026-06-13$37,000 Active 1 DOM
ⓘ Source: listings_history table (triggers on properties + properties_extension) + one-shot
backfill from property_details.listing_events for pre-trigger history.
Climate risk First Street
- Flood 6/10 Major FEMA zone X (unshaded) · 69% chance over 30 yrs
- Wildfire 7/10 Severe
- Heat 7/10 Severe 7 d/yr ≥105°F today · 15 d/yr by 30 yrs out
- Wind 1/10 Low
- Air quality 10/10 Extreme 36 unhealthy d/yr today · 38 by 30 yrs out
Nearby sold comps map
Loading sold comps map…
Walkable amenities ~0.75 mi
Loading nearby amenities…
Taxation est. · year 1
- Rental income
- $17,167
- − Mortgage interest
- −$2,073
- − Property taxes
- −$555
- − Insurance
- −$185
- − Repairs & maintenance
- −$1,373
- − Management
- −$1,373
- − Depreciation
- −$1,076
- Taxable income
- $10,531
- Est. tax owed @ 24.0%
- −$2,527
- After-tax cash flow
- $7,966/yr
For passive investors: Depreciation is non-cash, so a rental often shows a tax loss while cash-flowing — sheltering income. Rental losses are passive: they offset passive income freely, and up to $25,000/yr can offset ordinary (W-2) income if you actively participate and your MAGI is under $100k (phasing out to $0 by $150k); unused losses carry forward. On sale, claimed depreciation is recaptured at up to 25%, and gains may owe capital-gains tax (a 1031 exchange can defer both). Figures are a year-1 estimate at your 24.0% rate — not tax advice; consult a CPA.
Condition & rehab AI · 13 photos
This 2-bedroom, 1-bath home in Country Leisure Estates is in good condition with recent updates. It's move-in ready with a fresh paint job and modern updates that will appeal to buyers and renters alike.
Value-add opportunities
- Resale Paint exterior — Fresh paint enhances curb appeal
- Both Replace carpet with hardwood — Hardwood increases value and is easier to maintain
- Both Replace curtains with modern ones — Modern curtains improve aesthetics and can be easily replaced
Renovation cost estimate screening
Value-add ROI direction
- Resale Paint exterior — Fresh paint enhances curb appeal ↑
- Both Replace carpet with hardwood — Hardwood increases value and is easier to maintain ↑
- Both Replace curtains with modern ones — Modern curtains improve aesthetics and can be easily replaced ↑
ⓘ Cost ranges are severity-bucket heuristics (US national rule-of-thumb). Get contractor quotes + a written scope before underwriting a rehab budget.
Schools (NCES district)
- District
- Orland Joint Unified
- NCES district ID
- 0600045
- Math proficiency
- 12% ▼ -6.00%
- Reading proficiency
- 25% ▼ -11.00%
- Median HH income
- $41,067
- Composite
- 15.77/100
- National rank
- #9273
- State rank
- #476 of 517 in CA
Livability — Orland
- Score
- 58/100
- State rank
- #718
- US rank
- #21367
Category grades
Schools grade is shown separately in the Schools card above.
Census & demographics
- Population (ZIP)
- 16,483
Population outlook (Glenn County) Hauer SSP2
- Today (2025)
- 27,468 people
- By 2030
- 27,091 · -1.4%
- By 2040
- 26,437 · -3.8%
- By 2050
- 25,768 · -6.2%
- By 2075
- 24,018 · -12.6%
- By 2100
- 21,236 · -22.7%
Race, ethnicity, and origin ACS 2023
- Neighborhood character
- Majority White (52%)
- Race & ethnicity
- White 52% Hispanic / Latino 43% Two or more races 11% Native American 2% Asian 1%
- Hispanic origin (detail)
- Mexican 42%
- Common ancestry
- Russian 4% Italian 2% Lithuanian 1%
- Foreign-born
- 15% · Canada, China
- Languages at home
- 64% English-only · Spanish 33% Tagalog/Filipino 1% Chinese 1%
Political lean MEDSL · Glenn
- 2024 margin
- Solid R (+34.9) · D 31.2% · R 66.1% · Other 2.7%
- 2008→2024 swing
- -12.9pp toward R · 2008: -22.0pp · 2024: -34.9pp
- All cycles
- 2024: R+34.9 2020: R+27.2 2016: R+29.0 2012: R+25.5 2008: R+22.0
Not yet ingested
- Civics
- —
Market trends
- HPI YoY
- ▼ -123.05%
- Current HPI
- 176.5134
- Rent YoY
- —
- Metro
- —
- State GDP YoY
- ▲ 3.21%
- F500 in state
- 116
Industry mix (Fortune 500 HQ in CA)
| Industry | F500 HQs | Revenue |
|---|---|---|
| Technology | 27 | $1,492B |
|
||
| Financial Services | 3 | $174B |
|
||
| Retail | 3 | $44B |
|
||
| Insurance | 3 | $26B |
|
||
| Media / Entertainment | 2 | $115B |
|
||
| Pharmaceuticals / Biotech | 2 | $62B |
|
||
Price history
+68.2% since first listed9 events — show timeline
- 2026-06-12 Listed $37,000 TCAOR
- 2026-06-06 Price Changed $15,000 TCAOR
- 2026-04-20 Relisted — TCAOR
- 2026-04-09 Contingent — TCAOR
- 2026-03-27 Relisted — TCAOR
- 2026-03-27 Price Changed $18,000 TCAOR
- 2026-03-14 Contingent — TCAOR
- 2026-01-22 Price Changed $19,000 TCAOR
- 2025-12-17 Listed $22,000 TCAOR
Cash-flow waterfall
monthlySold comps — $/sqft
last 12 mo · ≤1 miLoading sold comps…