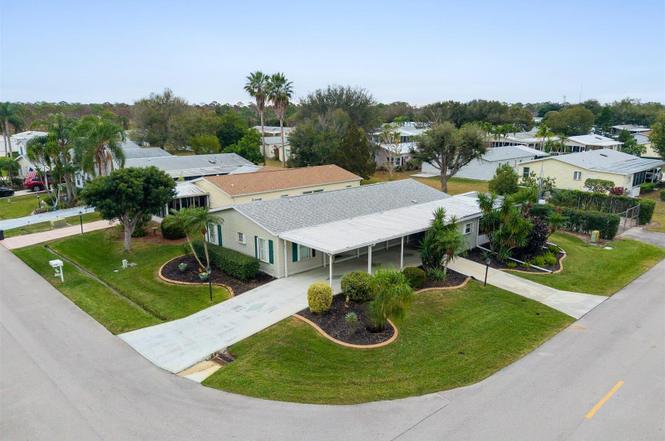
3801 Hydrilla Ct · Indian River Estates, FL
Flood risk 7/10 · Major
- FEMA flood zone
- X (unshaded)
- Chance of flooding over 30 yrs
- 0.99%
- Est. flood insurance / yr
- $507 – $1,088
Fire risk 4/10 · Minor
- Est. fire insurance / yr
- $947 – $1,759
Heat risk 10/10 · Severe
- Hot days now (above 106°F)
- 7 days/yr
- Hot days in 30 yrs
- 25 days/yr
Wind risk 10/10 · Severe
- Chance of severe wind over 30 yrs
- 99.0%
Air-quality risk 2/10 · Minimal
- Unhealthy air days now
- 1 days/yr
- Unhealthy air days in 30 yrs
- 1 days/yr
Risk factors via First Street. Map © Google.
Why this score? — see what drove the C- grade
The composite is a weighted blend of 9 inputs, each scored 0–100. Each bar is that input's sub-score; the figure is the points it added to the 100-point composite (weight × sub-score).
- Cash flow +21.7/30.0
- 1% rule +8.2/10.0
- DSCR +6.9/10.0
- ARV discount +5.7/15.0
- Schools +3.7/10.0
- Livability +3.2/5.0
- Rent growth +3.0/5.0
- Condition / age +2.5/5.0
- Appreciation +0.0/10.0
$154,900
🖨 Deal sheet (PDF) 📄 Offer letter ✓ Due diligence
Listing remarks MLS
Welcome Home! Relax and enjoy your morning coffee in the eat-in kitchen before getting the day started in this very active lifestyle, 55+ community. This 2 Bedroom, 2 Bath beauty has a carport and is situated on a corner lot. Plenty of room in the large storage area off the carport. Meet your friends and enjoy fitness, softball, golf, tennis or billiards... or just relax poolside. Come and enjoy all that the Treasure Coast has to offer with great weather that allows for boating and fishing year round. Conveniently located close to shopping and restaurants. Land is leased. This is a Fannie Mae Homepath property. Measurements are approximate.
Key facts
- Additional driveway
- 2020 roof
- Enclosed glass lanai
Tags
Property features AI
Finance
- Other: Senior community; Pets allowed with possible restrictions (breed/number limits)
- Financial info: Association fee: $310 monthly
- HOA & community: Homeowners association with monthly fee; Association amenities include: clubhouse, fitness center, pool, spa/hot tub, sauna, tennis courts, pickleball court(s), basketball court, shuffleboard court, putting green, golf course, billiard room, cafe/restaurant, community room, internet included, recreation facilities
Exterior
- Parking: Attached carport (1 covered carport space); 1 open parking space
- Security: Security patrol; Gated (no guard)
- Utilities: Public water; Public sewer; Three-phase electric service; Cable available; Underground utilities; Water available; Sewer available
- Home design: Manufactured home; Single-story; Facing east; Resale property
- Construction: Modular construction; Composition/shingle roof
- Exterior features: Open patio; Screened porch; Glass-enclosed porch; Patio; Shed(s)
Interior
- Kitchen: Dishwasher; Electric range; Microwave; Refrigerator; Electric water heater
- Bedrooms: 2 bedrooms on the main level
- Flooring: Carpet; Laminate
- Bathrooms: 2 full bathrooms on the main level
- Heating & cooling: Central heating (electric); Central air conditioning (electric); Ceiling fans
- Interior features: Walk-in closets; Split bedroom layout; Partially furnished; French doors; Plantation shutters; Single-hung metal windows
- Laundry & utility: Electric water heater (listed with appliances)
Neighborhood map
What this means for you Summary
Snapshot
- This is a 2-bed/2.0-bath manufactured listed at $155k.
Deal economics
- At list price, monthly cash flow is $171 ($2k/yr) — positive.
- The deal already cash-flows at list — no discount required.
- Meets the 1% rule at list price ($2k rent vs $155k).
- Recommended offer: $136k (12.0% below list) — sets the bar for market timing.
- Cap rate 8.1% vs local median 5.3% in Indian River Estates — top-decile yield for the area; either an underpriced asset or a hidden risk that comps aren't pricing in. Stress-test before assuming the spread holds.
Location & tenants
- Location reads 65/100 on livability (#653 in FL) — a middle-class / working-renter tenant base. Strengths: cost of living A+, housing A+, crime B+; Watch: employment D+, amenities F, commute F.
- St. Lucie (urban): math 40% / reading 48% proficiency, ranked #51 of 73 in FL (top 70%) — families likely to look elsewhere, expect single-tenant / working-renter base with shorter leases.
- Zoned schools: Savanna Ridge Elementary School (math 40% / reading 45%, grade F, #1,383 of 2,144 statewide, top 65%, 452 students, 75% FRL); Port St. Lucie High School (math 21% / reading 43%, grade F, #415 of 667 statewide, top 63%, 1,748 students, 67% FRL).
- Market conditions: Rents rising (+1.9%/yr); 639 active listings in the ZIP; 10 comparable units currently listed for rent nearby; rentals at typical pace (median 15d on market — plan ~3-4 weeks tenant-placement turnaround); 4,868 units permitted in St. Lucie County in 2024 (268 in 5+ unit buildings).
- This rent runs 40% of the median local income ($62k/yr) — at the standard rent-burdened threshold; future hikes will face affordability resistance.
Forward outlook
- Local home prices are declining (-3.0%/yr); year-one equity from $1k of loan paydown is wiped out by about $5k of value loss. Plan a longer hold.
- St. Lucie County population projected at +20% by 2050 — long-run rental-demand tailwind backs the buy-and-hold thesis.
Negotiation context
- It's been on market 153 days — a 12% lower offer ($136k) is reasonable based on typical stale-listing flexibility.
- 6 sale attempts since 19y ago; this cycle's ask has dropped $35k (18%) from the opening price — seller is motivated, your offer sets the floor, not the list.
- Current owner paid $42k; list at $155k implies a 271% gain — meaningful room to come down on a strong offer.
Risks & watch-outs
- Watch-outs: flood insurance adds $66/mo.
- Climate carrying-cost: major flood risk; severe wind risk, 99% chance of damaging wind over 30y; extreme-heat days projected 7→25/yr by 2055 (HVAC capex compounding) — expect insurance premiums to compound above CPI over the hold.
Questions for the listing agent
- It's been on market 153 days. Have you received any prior offers? Is the seller open to a 12% concession, seller financing, or rate buy-down credit?
- What's the actual annual flood-insurance premium (NFIP or private), and is the property in a SFHA with mandatory coverage?
- What does the HOA fee cover, when was the last increase, and are there any pending special assessments or reserve-fund shortfalls?
- Why hasn't it sold? Are there any deal-killer items the seller is aware of (foundation, flood, title, zoning, code violations)?
- Is there a deadline driving the sale (1031 exchange, divorce, estate, relocation)? That informs how much negotiation room exists.
- Schools are F-rated, which usually means shorter tenancies and higher turnover. Who's the typical renter profile here, and what's been the actual vacancy rate?
- What's the average days-on-market for RENTAL listings here right now (not sales)? A rising rental-DOM trend means longer vacancies and softer asking-rent achievability than the comps imply.
- What's the recent tenant-quality profile in this submarket — average credit score on applications, eviction rate, late-payment / NSF rate, and stable-employment percentage? A property-management company in the area should have these aggregated.
- How much new for-sale + rental construction is in the pipeline within 1–3 miles? Heavy new supply typically softens prices + rents 12–24 months out; constrained supply supports both.
Investment metrics
- 1% rule
- 1.32% ✓
- Cap rate
- 8.13%
- Cash-on-cash
- 6.57%
- DSCR
- 1.29
- GRM
- 6.3
CMA / ARV
- ARV (on-the-fly)
- $148,975
- Comps found
- 12
Show comp detail 12 sales within ~0.75 mi
| Address | Dist | Beds/Ba | Sqft | Sold | Price | $/sf | Match |
|---|---|---|---|---|---|---|---|
| 7928 Meadowlark Ln | 0.11mi | 2/3.0 | 1,475 (0%) | 2mo | $65,000 | $44 | 90 |
| 3700 Westchester Ct | 0.43mi | 2/2.0 | 1,480 (+0%) | 8mo | $130,000 | $88 | 73 |
| 7921 Meadowlark Ln | 0.14mi | 2/2.0 | 1,301 (-12%) | 2mo | $115,000 | $88 | 72 |
| 3817 Sleepy Hollow Ln | 0.36mi | 2/2.0 | 1,390 (-6%) | 4mo | $260,000 | $187 | 70 |
| 3115 Palm Warbler Ct | 0.47mi | 2/2.0 | 1,429 (-3%) | 9mo | $140,000 | $98 | 65 |
| 3005 Approach Shot Way | 0.46mi | 2/2.0 | 1,333 (-10%) | 3mo | $149,900 | $112 | 60 |
| 3720 Pebble Bch | 0.38mi | 3/2.0 (+1) | 1,608 (+9%) | 3mo | $225,000 | $140 | 59 |
| 8394 Delphinium Ct | 0.55mi | 3/2.0 (+1) | 1,392 (-6%) | 4mo | $220,000 | $158 | 57 |
| 7822 White Ibis Ln | 0.51mi | 3/2.0 (+1) | 1,612 (+9%) | 2mo | $115,000 | $71 | 54 |
| 7953 Horned Lark Cir | 0.58mi | 2/2.0 | 1,286 (-13%) | 1mo | $130,000 | $101 | 51 |
| 2948 Fiddlewood Cir | 0.74mi | 2/2.0 | 1,280 (-13%) | 1mo | $122,000 | $95 | 42 |
| 3776 Satinwood Ct | 0.67mi | 2/2.0 | 1,284 (-13%) | 11mo | $175,000 | $136 | 38 |
Match score weights: distance 35% · size 25% · config 20% · recency 20%. Top-matched comps best support the ARV.
Projected returns pro-forma
-3.0% appreciation · 1.92% rent growth · sell at horizon
- IRR
- -10.3%
- Equity multiple
- 0.63×
- Total profit
- $-16,154
- Equity at exit
- $23,096
- IRR
- -2.8%
- Equity multiple
- 0.82×
- Total profit
- $-7,823
- Equity at exit
- $13,393
Cash invested: $43,372 (down + closing). Projections, not guarantees.
Landlord ↔ Tenant lean methodology
- Overall (STATE)
- 87 Strongly Landlord-Friendly
- State Florida
- 87 Strongly Landlord-Friendly · R+3
- County
- — inherits STATE
- City
- — inherits STATE
ZIP-level market 34952
- Home prices YoY
- -29.6%
- Rents YoY
- 1.9%
- Active inventory
- 639
- Price-to-rent
- 6.3×
Monthly cashflow live
- Estimated rent
- $2,048 high interval (Pro) →
- Mortgage (P&I)
- −$812
- Tax est. 1.5%
- −$194 /mo · $2,324/yr
- Insurance
- −$65
- Flood insurance flood zone
- −$66 /mo · $798/yr
- HOA
- −$310
- Vacancy / Maint / Mgmt
- −$430
- Net cashflow
- $171
Break-even live
Sensitivity live
| Price | -10% $278 | -5% $224 | +0% $171 | +5% $117 | +10% $64 |
|---|---|---|---|---|---|
| Rent | -10% $9 | -5% $90 | +0% $171 | +5% $252 | +10% $333 |
| Rate | -1.0pp $249 | -0.5pp $210 | base $171 | +0.5pp $131 | +1.0pp $90 |
UW: 25.0% down · 7.5% · 30yr · 1.5% tax · 5.0% vac · 8.0% maint · 8.0% mgmt
Financing live
Cash to close
- Down payment
- $38,725
- Closing costs
- $4,647
- Reserves months
- —
- Total cash needed
- —
Loan-product check · same deal, 3 products live
Conventional
25% down · 7.5% · 30yr
- Down + closing
- —
- Monthly P&I
- —
- Monthly cashflow
- —
- DSCR
- —
- Eligible?
- —
Personal DTI + credit; lowest rate.
DSCR
20% down · 8.5% · 30yr
- Down + closing
- —
- Monthly P&I
- —
- Monthly cashflow
- —
- DSCR
- —
- Eligible?
- —
No personal income docs; deal must DSCR.
Hard money
10% down · 12.0% · 12mo
- Down + closing
- —
- Monthly P&I
- —
- Monthly cashflow
- —
- DSCR
- —
- Eligible?
- —
Short-term bridge; refi at stabilization.
Rent comps 10 comps
| Address | Beds | Baths | Sqft | Rent | $/sqft | DOM | Units | Dist |
|---|---|---|---|---|---|---|---|---|
| 3784 Sapodilla Ct Port Saint Lucie, FL | 2.0 | 2.0 | 1121 | $2,300 | $2.05 | 24d | 1 | 0.64mi |
| 1131 SE Parrish Ct Port Saint Lucie, FL | 2.0 | 1.0 | 902 | $2,000 | $2.22 | 24d | 1 | 1.23mi |
| 71 W Caribbean Port St. Lucie, FL | 2.0 | 2.0 | 1417 | $1,700 | $1.20 | 24d | 1 | 1.25mi |
| 2209 SE East Dunbrooke Cir Port Saint Lucie, FL | 3.0 | 2.0 | 1212 | $2,950 | $2.43 | 14d | 1 | 1.25mi |
| 1900 Bella Vista Way Port Saint Lucie, FL | 1.0–2.0 | 1.0–2.0 | 995 | $1,764 | $1.77 | 14d | 15 | 1.28mi |
| 2183 SE Wild Meadow Cir Port Saint Lucie, FL | 2.0 | 2.0 | 1550 | $1,900 | $1.23 | 14d | 1 | 1.36mi |
| 2130 SE Wild Meadow Cir Port Saint Lucie, FL | 2.0 | 2.0 | 1440 | $1,695 | $1.18 | 14d | 1 | 1.40mi |
| 2058 SE Wild Meadow Cir #101 Port St Lucie, FL | 2.0 | 2.5 | 1425 | $2,200 | $1.54 | 14d | 1 | 1.41mi |
| 2082 SE Wild Meadow Cir Port Saint Lucie, FL | 2.0 | 2.0 | 1524 | $1,850 | $1.21 | 24d | 1 | 1.43mi |
| 1811 SE Walton Lakes Dr Port Saint Lucie, FL | 2.0 | 1.0–2.0 | 1117 | $1,926 | $1.72 | 14d | 6 | 1.48mi |
HOA detail
- Monthly dues
- $310 · $3,720/yr
- Likely covers
- pool
Listing history 34 events
-
2026-06-18days on market $154,900 Active 153 DOM
-
2026-06-17days on market $154,900 Active 152 DOM
-
2026-06-16days on market $154,900 Active 151 DOM
-
2026-06-15days on market $154,900 Active 150 DOM
-
2026-06-14days on market $154,900 Active 148 DOM
-
2026-06-13days on market $154,900 Active 147 DOM
-
2026-06-10days on market $154,900 Active 145 DOM
-
2026-06-09days on market $154,900 Active 144 DOM
-
2026-06-08days on market $154,900 Active 143 DOM
-
2026-06-07days on market $154,900 Active 142 DOM
-
2026-06-05days on market $154,900 Active 139 DOM
-
2026-06-03days on market $154,900 Active 138 DOM
-
2026-06-02days on market $154,900 Active 137 DOM
-
2026-06-01days on market $154,900 Active 136 DOM
-
2026-05-31days on market $154,900 Active 135 DOM
-
2026-05-30days on market $154,900 Active 134 DOM
-
2026-05-22price $154,900
-
2026-03-29price $167,900
-
2026-02-25price $179,900
-
2026-01-15$189,900 Active
-
2015-11-20soldstatus $41,800 Closed 649-char remark
Show marketing remark (649 chars)
Welcome Home! Relax and enjoy your morning coffee in the eat-in kitchen before getting the day started in this very active lifestyle, 55+ community. This 2 Bedroom, 2 Bath beauty has a carport and is situated on a corner lot. Plenty of room in the large storage area off the carport. Meet your friends and enjoy fitness, softball, golf, tennis or billiards... or just relax poolside. Come and enjoy all that the Treasure Coast has to offer with great weather that allows for boating and fishing year round. Conveniently located close to shopping and restaurants. Land is leased. This is a Fannie Mae Homepath property. Measurements are approximate.
-
2015-10-28historical Contingent 649-char remark
Show marketing remark (649 chars)
Welcome Home! Relax and enjoy your morning coffee in the eat-in kitchen before getting the day started in this very active lifestyle, 55+ community. This 2 Bedroom, 2 Bath beauty has a carport and is situated on a corner lot. Plenty of room in the large storage area off the carport. Meet your friends and enjoy fitness, softball, golf, tennis or billiards... or just relax poolside. Come and enjoy all that the Treasure Coast has to offer with great weather that allows for boating and fishing year round. Conveniently located close to shopping and restaurants. Land is leased. This is a Fannie Mae Homepath property. Measurements are approximate.
-
2015-10-10$44,900 Active 649-char remark
Show marketing remark (649 chars)
Welcome Home! Relax and enjoy your morning coffee in the eat-in kitchen before getting the day started in this very active lifestyle, 55+ community. This 2 Bedroom, 2 Bath beauty has a carport and is situated on a corner lot. Plenty of room in the large storage area off the carport. Meet your friends and enjoy fitness, softball, golf, tennis or billiards... or just relax poolside. Come and enjoy all that the Treasure Coast has to offer with great weather that allows for boating and fishing year round. Conveniently located close to shopping and restaurants. Land is leased. This is a Fannie Mae Homepath property. Measurements are approximate.
-
2015-10-08historical
-
2015-09-10price $55,500
-
2015-08-29$63,000 Active
-
2014-10-29historical
-
2014-10-29historical
-
2013-12-22$24,900
-
2011-04-25historical
-
2009-09-01$67,500
-
2009-05-02historical
-
2007-11-30$79,900
-
2003-12-08soldstatus $8,500,000
ⓘ Source: listings_history table (triggers on properties + properties_extension) + one-shot
backfill from property_details.listing_events for pre-trigger history.
Climate risk First Street
- Flood 7/10 Severe FEMA zone X (unshaded) · 99% chance over 30 yrs
- Wildfire 4/10 Moderate
- Heat 10/10 Extreme 7 d/yr ≥106°F today · 25 d/yr by 30 yrs out
- Wind 10/10 Extreme 99% chance of damaging wind over 30 yrs
- Air quality 2/10 Low 1 unhealthy d/yr today · 1 by 30 yrs out
Nearby sold comps map
Loading sold comps map…
Walkable amenities ~0.75 mi
Loading nearby amenities…
Taxation est. · year 1
- Rental income
- $24,575
- − Mortgage interest
- −$8,677
- − Property taxes
- −$2,324
- − Insurance
- −$1,572
- − Repairs & maintenance
- −$1,966
- − Management
- −$1,966
- − HOA
- −$3,720
- − Depreciation
- −$4,506
- Taxable loss
- −$155
- Est. tax savings @ 24.0%
- +$37
- After-tax cash flow
- $2,088/yr
For passive investors: Depreciation is non-cash, so a rental often shows a tax loss while cash-flowing — sheltering income. Rental losses are passive: they offset passive income freely, and up to $25,000/yr can offset ordinary (W-2) income if you actively participate and your MAGI is under $100k (phasing out to $0 by $150k); unused losses carry forward. On sale, claimed depreciation is recaptured at up to 25%, and gains may owe capital-gains tax (a 1031 exchange can defer both). Figures are a year-1 estimate at your 24.0% rate — not tax advice; consult a CPA.
Schools (NCES district)
- District
- St. Lucie
- NCES district ID
- 1201770
- Math proficiency
- 40% ▼ -11.00%
- Reading proficiency
- 48% ▼ -4.00%
- Median HH income
- $44,737
- Composite
- 37.28/100
- National rank
- #4449
- State rank
- #51 of 73 in FL
Livability — Indian River Estates
- Score
- 65/100
- State rank
- #653
- US rank
- #12946
Category grades
Schools grade is shown separately in the Schools card above.
Census & demographics
- County
- Saint Lucie County · 337,150 people
- City population
- 27,447
- Metro
- Port St. Lucie, FL
- Population (ZIP)
- 42,655
- Household income
- $61,628
- Rent vs Own
- Severe rent burden
- 1759.0
Population outlook (St. Lucie County) Hauer SSP2
- Today (2025)
- 338,016 people
- By 2030
- 355,687 · +5.2%
- By 2040
- 385,521 · +14.1%
- By 2050
- 406,106 · +20.1%
- By 2075
- 441,054 · +30.5%
- By 2100
- 436,885 · +29.2%
Race, ethnicity, and origin ACS 2023
- Neighborhood character
- Diverse neighborhood (Simpson 0.57)
- Race & ethnicity
- White 62% Hispanic / Latino 19% Two or more races 14% Black 10% Asian 3%
- Hispanic origin (detail)
- Mexican 4% Puerto Rican 4% Cuban 2% Dominican 2%
- Common ancestry
- Romanian 3% Lithuanian 2% Hispanic 1%
- Foreign-born
- 18% · Canada, Jamaica, China
- Languages at home
- 76% English-only · Spanish 16% French/Haitian/Cajun 3% Tagalog/Filipino 2%
Political lean MEDSL · St. Lucie
- 2024 margin
- Lean R (+9.1) · D 45.1% · R 54.2%
- 2008→2024 swing
- -21.2pp toward R · 2008: 12.1pp · 2024: -9.1pp
- All cycles
- 2024: R+9.1 2020: R+1.6 2016: R+2.5 2012: D+7.9 2008: D+12.1
Not yet ingested
- Civics
- —
Market trends
- HPI YoY
- ▼ -155.80%
- Current HPI
- 371.0573
- Rent YoY
- ▲ 1.92%
- Metro
- Port St. Lucie, FL
- State GDP YoY
- ▲ 3.28%
- F500 in state
- 36
Industry mix (Fortune 500 HQ in FL)
| Industry | F500 HQs | Revenue |
|---|---|---|
| Industrial Technology | 2 | $29B |
|
||
| Insurance | 2 | $17B |
|
||
| Retail | 1 | $60B |
|
||
| Technology Distribution | 1 | $58B |
|
||
| Homebuilding | 1 | $35B |
|
||
| Technology Manufacturing | 1 | $35B |
|
||
Price history
-98.2% since first listed18 events — show timeline
- 2026-05-22 Price Changed $154,900 Beaches MLS
- 2026-03-29 Price Changed $167,900 Beaches MLS
- 2026-02-25 Price Changed $179,900 Beaches MLS
- 2026-01-15 Listed $189,900 Beaches MLS
- 2015-11-20 Sold (MLS) $41,800 Beaches MLS
- 2015-10-28 Contingent — Beaches MLS
- 2015-10-10 Listed $44,900 Beaches MLS
- 2015-10-08 Listing Removed — Beaches MLS
- 2015-09-10 Price Changed $55,500 Beaches MLS
- 2015-08-29 Listed $63,000 Beaches MLS
- 2014-10-29 Listing Removed — Beaches MLS
- 2014-10-29 Listing Removed — Beaches MLS
- 2013-12-22 Listed $24,900 Beaches MLS
- 2011-04-25 Listing Removed — Beaches MLS
- 2009-09-01 Listed $67,500 Beaches MLS
- 2009-05-02 Listing Removed — Beaches MLS
- 2007-11-30 Listed $79,900 Beaches MLS
- 2003-12-08 Sold (Public Records) $8,500,000 Public Records
Property tax history
-11.8%/yrLatest (2025): $310 · +4.6% YoY. Source: county tax records.
Cash-flow waterfall
monthlySold comps — $/sqft
last 12 mo · ≤1 miLoading sold comps…