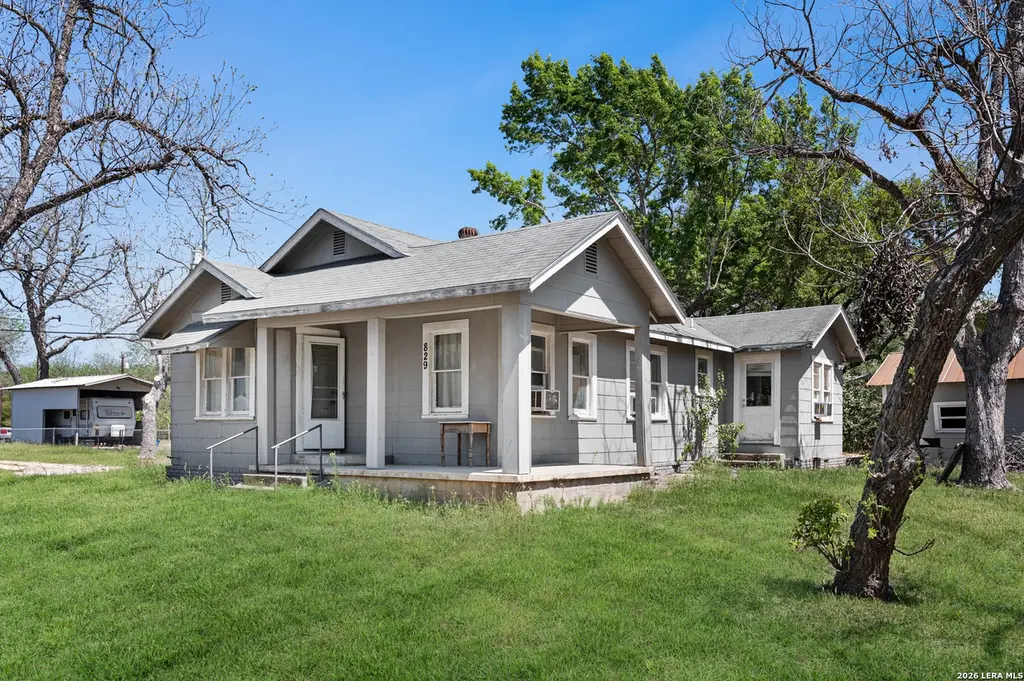
829 N Goodrich · Seguin, TX
Flood risk 1/10 · Minimal
- FEMA flood zone
- X (unshaded)
- Chance of flooding over 30 yrs
- 0.0%
- Est. flood insurance / yr
- $507 – $1,088
Fire risk 1/10 · Minimal
- Est. fire insurance / yr
- $1,222 – $2,270
Heat risk 8/10 · Major
- Hot days now (above 108°F)
- 7 days/yr
- Hot days in 30 yrs
- 20 days/yr
Wind risk 8/10 · Major
- Chance of severe wind over 30 yrs
- 80.0%
Air-quality risk 1/10 · Minimal
- Unhealthy air days now
- 0 days/yr
- Unhealthy air days in 30 yrs
- 0 days/yr
Risk factors via First Street. Map © Google.
Why this score? — see what drove the B- grade
The composite is a weighted blend of 9 inputs, each scored 0–100. Each bar is that input's sub-score; the figure is the points it added to the 100-point composite (weight × sub-score).
- Cash flow +30.0/30.0
- 1% rule +10.0/10.0
- DSCR +10.0/10.0
- ARV discount +7.5/15.0
- Livability +3.3/5.0
- Rent growth +3.0/5.0
- Condition / age +2.5/5.0
- Schools +2.4/10.0
- Appreciation +0.0/10.0
$89,900
🖨 Deal sheet 📄 Offer letter ✓ Due diligence
Listing remarks
Investor special!!!
Key facts
- 0.24 acre lot
- 2 garage spots
- Built 1965
Neighborhood map
What this means for you Summary
Snapshot
- This is a 2-bed/1.0-bath single-family listed at $90k.
Deal economics
- At list price, monthly cash flow is $438 ($5k/yr) — positive.
- The deal already cash-flows at list — no discount required.
- Meets the 1% rule at list price ($1k rent vs $90k).
- Cap rate 12.1% vs local median 3.7% in Seguin — top-decile yield for the area; either an underpriced asset or a hidden risk that comps aren't pricing in. Stress-test before assuming the spread holds.
Location & tenants
- Location reads 66/100 on livability (#592 in TX) — a middle-class / working-renter tenant base. Strengths: cost of living A+, housing A+; Watch: employment D, amenities F, commute F.
- Seguin ISD (town): math 26% / reading 30% proficiency, ranked #663 of 826 in TX (top 80%) — low school quality limits family demand, transient renter base, plan for 1-2y turnover; 63% free/reduced lunch — lower-income household profile, screen leases tightly.
- Zoned schools: Oralia R Rodriguez El (math 28% / reading 30%, grade F, #2,668 of 4,322 statewide, top 63%, 475 students, 83% FRL); Seguin H S (math 24% / reading 43%, grade F, #1,011 of 1,632 statewide, top 63%, 2,101 students, 71% FRL).
- Market conditions: Rents rising (+2.0%/yr); 1342 active listings in the ZIP; 40 comparable units currently listed for rent nearby; rentals at typical pace (median 18d on market — plan ~3-4 weeks tenant-placement turnaround); 2,064 units permitted in Guadalupe County in 2024 (133 in 5+ unit buildings).
Forward outlook
- Local home prices are declining (-3.0%/yr); year-one equity from $622 of loan paydown is wiped out by about $3k of value loss. Plan a longer hold.
- Guadalupe County population projected at +61% by 2050 — long-run rental-demand tailwind backs the buy-and-hold thesis.
- At projected returns (-3.0% appreciation + 2.0% rent growth), your $25k cash investment doubles in ~7 years — after that, you're playing with house money.
Negotiation context
- Only 11 days on market — expect competitive offers; lowballing is unlikely to land.
Risks & watch-outs
- Climate carrying-cost: severe wind risk, 80% chance of damaging wind over 30y; extreme-heat days projected 7→20/yr by 2055 (HVAC capex compounding) — expect insurance premiums to compound above CPI over the hold.
Questions for the listing agent
- Built in 1965 — when were the roof, HVAC, electrical panel, plumbing, and water heater last replaced?
- Is there a deadline driving the sale (1031 exchange, divorce, estate, relocation)? That informs how much negotiation room exists.
- Schools are F-rated, which usually means shorter tenancies and higher turnover. Who's the typical renter profile here, and what's been the actual vacancy rate?
- What's the average days-on-market for RENTAL listings here right now (not sales)? A rising rental-DOM trend means longer vacancies and softer asking-rent achievability than the comps imply.
- What's the recent tenant-quality profile in this submarket — average credit score on applications, eviction rate, late-payment / NSF rate, and stable-employment percentage? A property-management company in the area should have these aggregated.
- How much new for-sale + rental construction is in the pipeline within 1–3 miles? Heavy new supply typically softens prices + rents 12–24 months out; constrained supply supports both.
Investment metrics
- 1% rule
- 1.52% ✓
- Cap rate
- 12.14%
- Cash-on-cash
- 20.88%
- DSCR
- 1.93
- GRM
- 5.5
CMA / ARV
- ARV (on-the-fly)
- $204,168
- Comps found
- 12
Show comp detail 12 sales within ~0.75 mi
| Address | Dist | Beds/Ba | Sqft | Sold | Price | $/sf | Match |
|---|---|---|---|---|---|---|---|
| 608 San Antonio | 0.17mi | 3/1.0 (+1) | 1,116 (-1%) | 4mo | $159,500 | $143 | 82 |
| 404 N Milam St | 0.51mi | 2/1.0 | 1,150 (+2%) | 2mo | $208,500 | $181 | 72 |
| 515 E Mountain St | 0.63mi | 2/1.0 | 1,161 (+3%) | 1mo | $238,500 | $205 | 65 |
| 402 Michna | 0.47mi | 3/1.0 (+1) | 1,080 (-4%) | 6mo | $110,000 | $102 | 61 |
| 530 E Weinert St | 0.56mi | 3/2.0 (+1) | 1,123 (-0%) | 5mo | $205,000 | $183 | 60 |
| 767 Taylor Ave | 0.55mi | 3/1.0 (+1) | 1,084 (-4%) | 4mo | $169,000 | $156 | 60 |
| 411 Bismark | 0.40mi | 3/2.0 (+1) | 1,228 (+9%) | 6mo | $160,000 | $130 | 52 |
| 343 Batey Rd | 0.57mi | 3/2.0 (+1) | 1,216 (+8%) | 6mo | $289,000 | $238 | 47 |
| 426 Vaughan Ave | 0.74mi | 2/1.0 | 992 (-12%) | 4mo | $70,000 | $71 | 42 |
| 403 Bauer St | 0.70mi | 3/2.0 (+1) | 1,039 (-8%) | 4mo | $208,750 | $201 | 42 |
| 516 Tampico | 0.57mi | 3/2.0 (+1) | 1,258 (+12%) | 6mo | $163,999 | $130 | 40 |
| 1615 N Guadalupe | 0.62mi | 3/2.0 (+1) | 1,289 (+14%) | 2mo | $294,500 | $228 | 37 |
Match score weights: distance 35% · size 25% · config 20% · recency 20%. Top-matched comps best support the ARV.
Projected returns pro-forma
-3.0% appreciation · 2.04% rent growth · sell at horizon
- IRR
- 12.2%
- Equity multiple
- 1.48×
- Total profit
- $12,050
- Equity at exit
- $13,404
- IRR
- 20.4%
- Equity multiple
- 2.64×
- Total profit
- $41,279
- Equity at exit
- $7,773
Cash invested: $25,172 (down + closing). Projections, not guarantees.
Landlord ↔ Tenant lean methodology
- Overall (STATE)
- 87 Strongly Landlord-Friendly
- State Texas
- 87 Strongly Landlord-Friendly · R+5
- County
- — inherits STATE
- City
- — inherits STATE
ZIP-level market 78155
- Rents YoY
- 2.0%
- Active inventory
- 1342
- Price-to-rent
- 5.5×
Monthly cashflow live
- Estimated rent
- $1,367 high interval (Pro) →
- Mortgage (P&I)
- −$471
- Tax from tax record
- −$133 /mo · $1,600/yr
- Insurance
- −$37
- HOA
- −$0
- Vacancy / Maint / Mgmt
- −$287
- Net cashflow
- $438
Break-even live
UW: 25.0% down · 7.5% · 30yr · 1.5% tax · 5.0% vac · 8.0% maint · 8.0% mgmt
Financing live
Cash to close
- Down payment
- $22,475
- Closing costs
- $2,697
- Reserves months
- —
- Total cash needed
- —
Loan-product check · same deal, 3 products live
Conventional
25% down · 7.5% · 30yr
- Down + closing
- —
- Monthly P&I
- —
- Monthly cashflow
- —
- DSCR
- —
- Eligible?
- —
Personal DTI + credit; lowest rate.
DSCR
20% down · 8.5% · 30yr
- Down + closing
- —
- Monthly P&I
- —
- Monthly cashflow
- —
- DSCR
- —
- Eligible?
- —
No personal income docs; deal must DSCR.
Hard money
10% down · 12.0% · 12mo
- Down + closing
- —
- Monthly P&I
- —
- Monthly cashflow
- —
- DSCR
- —
- Eligible?
- —
Short-term bridge; refi at stabilization.
Rent comps 40 comps
| Address | Beds | Baths | Sqft | Rent | $/sqft | DOM | Units | Dist |
|---|---|---|---|---|---|---|---|---|
| 508 Pitts St Seguin, TX | 3.0 | 1.0 | 973 | $1,275 | $1.31 | 12d | 1 | 0.18mi |
| 404 W Walnut St Seguin, TX | 2.0 | 1.0 | 996 | $1,550 | $1.56 | 44d | 1 | 0.33mi |
| 809 Leissner St Seguin, TX | 2.0 | 1.0 | 1020 | $1,175 | $1.15 | 24d | 1 | 0.40mi |
| 201 E Kingsbury St Seguin, TX | 2.0 | 1.0 | 856 | $1,095 | $1.28 | 15d | 1 | 0.41mi |
| 201 E Kingsbury St Seguin, TX | 2.0 | 1.0 | 856 | $1,095 | $1.28 | 24d | 1 | 0.41mi |
| 300 N Milam St Seguin, TX | 1.0 | 1.0 | 700 | $950 | $1.36 | 44d | 1 | 0.50mi |
| 917 8th St Seguin, TX | 3.0 | 2.0 | 1298 | $1,375 | $1.06 | 4d | 1 | 0.50mi |
| 906 San Antonio Ave Seguin, TX | 2.0 | 1.0 | 1020 | $1,100 | $1.08 | 44d | 1 | 0.53mi |
| 726 E Humphreys St Seguin, TX | 3.0 | 2.0 | 1248 | $1,500 | $1.20 | 24d | 1 | 0.65mi |
| 527 Elley St Seguin, TX | 3.0 | 3.0 | 1090 | $1,325 | $1.22 | 24d | 1 | 0.68mi |
| 1601 Hays St Seguin, TX | 3.0 | 2.0 | 1090 | $1,275 | $1.17 | 4d | 1 | 0.70mi |
| 1331 Hidalgo St Seguin, TX | 3.0 | 2.0 | 1298 | $1,364 | $1.05 | 22d | 1 | 0.78mi |
| 1701 N Guadalupe St Seguin, TX | 3.0 | 2.0 | 1028 | $1,464 | $1.42 | 4d | 1 | 0.78mi |
| 772 Mitchell Ave Seguin, TX | 3.0 | 2.0 | 1298 | $1,560 | $1.20 | 4d | 1 | 0.82mi |
| 714 S River St Unit B Seguin, TX | 3.0 | 1.0 | 936 | $1,285 | $1.37 | 24d | 1 | 0.90mi |
| 223 W Baxter St Seguin, TX | 3.0 | 2.0 | 1298 | $1,664 | $1.28 | 2d | 1 | 0.90mi |
| 968 E Cedar St Unit 1 Seguin, TX | 2.0 | 1.0 | 856 | $995 | $1.16 | 44d | 1 | 0.92mi |
| 227 Lopez St Seguin, TX | 3.0 | 2.0 | 1298 | $1,249 | $0.96 | 12d | 1 | 0.97mi |
| 222 Garcia St Seguin, TX | 3.0 | 2.0 | 1298 | $1,215 | $0.94 | 2d | 1 | 0.98mi |
| 228 Garcia St Seguin, TX | 3.0 | 2.0 | 1298 | $1,275 | $0.98 | 4d | 1 | 0.99mi |
| 219 Garcia St Seguin, TX | 3.0 | 2.0 | 1298 | $1,449 | $1.12 | 4d | 1 | 1.01mi |
| 526 E Baxter St Seguin, TX | 3.0 | 2.0 | 1255 | $1,350 | $1.08 | 24d | 1 | 1.05mi |
| 908 Pecan St Seguin, TX | 3.0 | 1.0 | 924 | $1,300 | $1.41 | 16d | 1 | 1.17mi |
| 1102 Renee Way Seguin, TX | 3.0 | 2.0 | 1372 | $1,395 | $1.02 | 12d | 1 | 1.19mi |
| 1107 Renee Way Seguin, TX | 3.0 | 2.0 | 1372 | $1,395 | $1.02 | 3d | 1 | 1.19mi |
| 1107 Renee Way Seguin, TX | 3.0 | 2.0 | 1372 | $1,445 | $1.05 | 20d | 1 | 1.19mi |
| 402 Trefger St Seguin, TX | 3.0 | 2.0 | 1096 | $1,395 | $1.27 | 24d | 1 | 1.20mi |
| 1112 Renee Way Seguin, TX | 3.0 | 2.0 | 1372 | $1,494 | $1.09 | 12d | 1 | 1.22mi |
| 1114 Renee Way Seguin, TX | 3.0 | 2.0 | 1372 | $1,449 | $1.06 | 44d | 1 | 1.22mi |
| 1116 Renee Way Seguin, TX | 3.0 | 2.0 | 1372 | $1,395 | $1.02 | 4d | 1 | 1.23mi |
| 450 Wallace St Seguin, TX | 3.0 | 2.0 | 1392 | $1,700 | $1.22 | 44d | 1 | 1.23mi |
| 415 Hudson St Seguin, TX | 3.0 | 2.0 | 1076 | $1,345 | $1.25 | 15d | 1 | 1.24mi |
| 1119 Burek Cross Seguin, TX | 3.0 | 2.0 | 1372 | $1,395 | $1.02 | 4d | 1 | 1.24mi |
| 1131 Renee Way Seguin, TX | 3.0 | 2.0 | 1372 | $1,450 | $1.06 | 44d | 1 | 1.25mi |
| 324 Mar Hill St Seguin, TX | 3.0 | 2.5 | 1236 | $1,395 | $1.13 | 16d | 1 | 1.25mi |
| 1128 Renee Way Seguin, TX | 3.0 | 2.0 | 1372 | $1,395 | $1.02 | 4d | 1 | 1.26mi |
| 502 Hudson St Seguin, TX | 3.0 | 2.0 | 1076 | $1,345 | $1.25 | 22d | 1 | 1.28mi |
| 502 Hudson St Seguin, TX | 3.0 | 2.0 | 1076 | $1,345 | $1.25 | 20d | 1 | 1.28mi |
| 607 E Martindale St Unit B Seguin, TX | 3.0 | 2.0 | 1020 | $1,500 | $1.47 | 17d | 1 | 1.30mi |
| 516 Hudson St Seguin, TX | 3.0 | 2.0 | 1150 | $1,450 | $1.26 | 44d | 1 | 1.30mi |
Listing history 4 events
-
2026-04-14status Pending
-
2026-04-10historical Active Option
-
2026-04-03$89,900 New
-
2024-11-21soldstatus
ⓘ Source: listings_history table (triggers on properties + properties_extension) + one-shot
backfill from property_details.listing_events for pre-trigger history.
Tax reassessment forecast TX · Resets to sale price
- Current annual tax
- $1,600 · $133/mo
- Projected year-2 tax
- $1,645 · $137/mo
- Expected delta
- +$45/yr (+$4/mo · 2.8%)
ⓘ Screening estimate from a state-policy table — verify with the county assessor before closing.
Climate risk First Street
- Flood 1/10 Low FEMA zone X (unshaded) · 0% chance over 30 yrs
- Wildfire 1/10 Low
- Heat 8/10 Severe 7 d/yr ≥108°F today · 20 d/yr by 30 yrs out
- Wind 8/10 Severe 80% chance of damaging wind over 30 yrs
- Air quality 1/10 Low 0 unhealthy d/yr today · 0 by 30 yrs out
Nearby sold comps map
Loading sold comps map…
Walkable amenities ~0.75 mi
Loading nearby amenities…
Taxation est. · year 1
- Rental income
- $16,408
- − Mortgage interest
- −$5,036
- − Property taxes
- −$1,600
- − Insurance
- −$450
- − Repairs & maintenance
- −$1,313
- − Management
- −$1,313
- − Depreciation
- −$2,615
- Taxable income
- $4,082
- Est. tax owed @ 24.0%
- −$980
- After-tax cash flow
- $4,276/yr
For passive investors: Depreciation is non-cash, so a rental often shows a tax loss while cash-flowing — sheltering income. Rental losses are passive: they offset passive income freely, and up to $25,000/yr can offset ordinary (W-2) income if you actively participate and your MAGI is under $100k (phasing out to $0 by $150k); unused losses carry forward. On sale, claimed depreciation is recaptured at up to 25%, and gains may owe capital-gains tax (a 1031 exchange can defer both). Figures are a year-1 estimate at your 24.0% rate — not tax advice; consult a CPA.
Schools (NCES district)
- District
- Seguin ISD
- NCES district ID
- 4839690
- Math proficiency
- 26% ▼ -8.00%
- Reading proficiency
- 30% ▼ -5.00%
- Median HH income
- $46,210
- Composite
- 24.17/100
- National rank
- #7738
- State rank
- #663 of 826 in TX
Livability — Seguin
- Score
- 66/100
- State rank
- #592
- US rank
- #11298
Category grades
Schools grade is shown separately in the Schools card above.
Census & demographics
- Census place
- Seguin, TX
- County
- Guadalupe County · 147,291 people
- City population
- 55,600
- Metro
- San Antonio-New Braunfels, TX
- Population (ZIP)
- 55,600
- Household income
- $71,039
- Rent vs Own
- Severe rent burden
- 1053.0
Population outlook (Guadalupe County) Hauer SSP2
- Today (2025)
- 196,854 people
- By 2030
- 220,210 · +11.9%
- By 2040
- 268,004 · +36.1%
- By 2050
- 316,333 · +60.7%
- By 2075
- 434,747 · +120.8%
- By 2100
- 520,447 · +164.4%
Race, ethnicity, and origin ACS 2023
- Neighborhood character
- Diverse neighborhood (Simpson 0.58)
- Race & ethnicity
- Hispanic / Latino 49% White 43% Two or more races 26% Black 5%
- Hispanic origin (detail)
- Mexican 41%
- Common ancestry
- Lithuanian 2% Slovak 1% Romanian 1%
- Foreign-born
- 8% · Canada
- Languages at home
- 74% English-only · Spanish 24% German/W. Germanic 1%
Political lean MEDSL · Guadalupe
- 2024 margin
- Strong R (+29.5) · D 34.8% · R 64.3%
- 2008→2024 swing
- +1.5pp toward D · 2008: -31.0pp · 2024: -29.5pp
- All cycles
- 2024: R+29.5 2020: R+24.2 2016: R+31.8 2012: R+35.1 2008: R+31.0
Not yet ingested
- Civics
- —
Market trends
- HPI YoY
- ▼ -147.43%
- Current HPI
- 160.5435
- Rent YoY
- ▲ 2.04%
- Metro
- San Antonio-New Braunfels, TX
- State GDP YoY
- ▲ 3.95%
- F500 in state
- 110
Industry mix (Fortune 500 HQ in TX)
| Industry | F500 HQs | Revenue |
|---|---|---|
| Energy | 16 | $1,198B |
|
||
| Technology | 5 | $198B |
|
||
| Engineering / Construction | 4 | $72B |
|
||
| Energy Services | 3 | $60B |
|
||
| Utilities | 3 | $41B |
|
||
| Healthcare | 2 | $330B |
|
||
Price history
4 events — show timeline
- 2026-04-14 Pending — LERA
- 2026-04-10 Contingent — LERA
- 2026-04-03 Listed $89,900 LERA
- 2024-11-21 Sold (Public Records) — Public Records
Property tax history
-1.3%/yrLatest (2026): $1,600 · -25.9% YoY. Source: county tax records.
Cash-flow waterfall
monthlySold comps — $/sqft
last 12 mo · ≤1 miLoading sold comps…