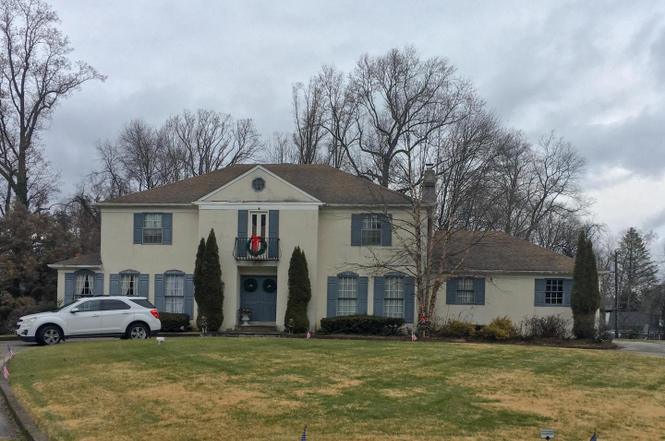
133 Quaker Ln · Ardmore, PA
Flood risk 1/10 · Minimal
- FEMA flood zone
- X (unshaded)
- Chance of flooding over 30 yrs
- 0.0%
- Est. flood insurance / yr
- $473 – $860
Fire risk 1/10 · Minimal
- Est. fire insurance / yr
- $511 – $949
Heat risk 6/10 · Moderate
- Hot days now (above 102°F)
- 7 days/yr
- Hot days in 30 yrs
- 15 days/yr
Wind risk 6/10 · Moderate
- Chance of severe wind over 30 yrs
- 27.0%
Air-quality risk 4/10 · Minor
- Unhealthy air days now
- 3 days/yr
- Unhealthy air days in 30 yrs
- 6 days/yr
Risk factors via First Street. Map © Google.
Why this score? — see what drove the B- grade
The composite is a weighted blend of 9 inputs, each scored 0–100. Each bar is that input's sub-score; the figure is the points it added to the 100-point composite (weight × sub-score).
- Cash flow +23.0/30.0
- ARV discount +15.0/15.0
- DSCR +7.4/10.0
- Schools +6.2/10.0
- 1% rule +6.0/10.0
- Livability +4.7/5.0
- Rent growth +2.5/5.0
- Condition / age +2.5/5.0
- Appreciation +0.0/10.0
$500,000
🖨 Deal sheet 📄 Offer letter ✓ Due diligence
Listing remarks
1.15 acres situated in a quiet neighborhood within Haverford’s own Merion Gold Manor Community. Featuring 4 bedrooms, 2 full bathrooms, 1 half bathroom in the 3,400 +/- livable square footage. Plenty of space outback for entertaining family and friends. Conveniently located within a short distance from shopping centers, restaurants, parks and recreational facilities. Must see in person to appreciate!
Key facts
- 1.15 acre lot
- 2 garage spots
- Built 1980
Neighborhood map
What this means for you Summary
Snapshot
- This is a 4-bed/2.5-bath single-family listed at $500k.
Deal economics
- At list price, monthly cash flow is $890 ($11k/yr) — positive.
- The deal already cash-flows at list — no discount required.
- Meets the 1% rule at list price ($6k rent vs $500k).
- Cap rate 8.4% vs local median 2.0% in Ardmore — top-decile yield for the area; either an underpriced asset or a hidden risk that comps aren't pricing in. Stress-test before assuming the spread holds.
Location & tenants
- Location reads 94/100 on livability (#2 in PA, #6 nationally) — a professional / high-income tenant draw. Strengths: schools A+, crime A+, amenities A+; Watch: cost of living D-.
- Haverford Township SD (suburban): math 58% / reading 78% proficiency, ranked #20 of 539 in PA (top 4%) — acceptable for families but not a draw, mixed tenant base, ~2y average lease; only 9% free/reduced lunch — higher-income household profile.
- Market conditions: 19 active listings in the ZIP; 1 comparable units currently listed for rent nearby; 299 units permitted in Delaware County in 2024 (5 in 5+ unit buildings).
Forward outlook
- Local home prices are declining (-3.0%/yr); year-one equity from $3k of loan paydown is wiped out by about $15k of value loss. Plan a longer hold.
Negotiation context
- Only 1 days on market — expect competitive offers; lowballing is unlikely to land.
- 3 sale attempts since 3y ago with the ask held roughly flat each time — persistent listings suggest the price (not the market) is what's stuck; bring a comps-based counter.
- Current owner paid $40k; list at $500k implies a 1150% gain — meaningful room to come down on a strong offer.
Risks & watch-outs
- Climate carrying-cost: major wind risk, 27% chance of damaging wind over 30y; extreme-heat days projected 7→15/yr by 2055 (HVAC capex compounding) — expect insurance premiums to compound above CPI over the hold.
Questions for the listing agent
- Is there a deadline driving the sale (1031 exchange, divorce, estate, relocation)? That informs how much negotiation room exists.
- Schools are A-rated — typically a magnet for longer-tenancy family renters. What's the average tenant stay here, and is there a school-zone premium baked into asking?
- What's the average days-on-market for RENTAL listings here right now (not sales)? A rising rental-DOM trend means longer vacancies and softer asking-rent achievability than the comps imply.
- What's the recent tenant-quality profile in this submarket — average credit score on applications, eviction rate, late-payment / NSF rate, and stable-employment percentage? A property-management company in the area should have these aggregated.
- How much new for-sale + rental construction is in the pipeline within 1–3 miles? Heavy new supply typically softens prices + rents 12–24 months out; constrained supply supports both.
Investment metrics
- 1% rule
- 1.10% ✓
- Cap rate
- 8.43%
- Cash-on-cash
- 7.63%
- DSCR
- 1.34
- GRM
- 7.6
CMA / ARV
- ARV (on-the-fly)
- $950,760
- Comps found
- 12
Show comp detail 12 sales within ~0.75 mi
| Address | Dist | Beds/Ba | Sqft | Sold | Price | $/sf | Match |
|---|---|---|---|---|---|---|---|
| 3108 Darby Rd | 0.24mi | 4/3.0 | 3,410 (-0%) | 19mo | $850,000 | $249 | 70 |
| 119 Golfview Rd | 0.41mi | 4/3.5 | 3,271 (-4%) | 22mo | $1,250,000 | $382 | 51 |
| 2700 Woodleigh Rd | 0.71mi | 4/3.5 | 3,364 (-2%) | 13mo | $975,000 | $290 | 50 |
| 21 Orchard Rd | 0.67mi | 5/2.5 (+1) | 3,524 (+3%) | 19mo | $675,000 | $192 | 42 |
| 6 College Ave | 0.69mi | 4/3.5 | 3,484 (+2%) | 23mo | $870,000 | $250 | 42 |
| 16 Golfview Rd | 0.34mi | 5/4.0 (+1) | 3,152 (-8%) | 23mo | $1,060,000 | $336 | 41 |
| 535 Ardmore Ave | 0.65mi | 4/2.5 | 3,054 (-11%) | 14mo | $740,000 | $242 | 40 |
| 44 Haverford Rd | 0.64mi | 5/3.5 (+1) | 3,269 (-4%) | 17mo | $650,000 | $199 | 39 |
| 45 W Golfview Rd | 0.52mi | 3/2.5 (-1) | 2,908 (-15%) | 8mo | $855,000 | $294 | 39 |
| 24 Dartmouth Ln | 0.40mi | 5/4.5 (+1) | 3,770 (+10%) | 23mo | $1,325,000 | $351 | 32 |
| 2720 W Darby Rd | 0.56mi | 5/2.5 (+1) | 2,928 (-14%) | 18mo | $815,000 | $278 | 30 |
| 233 Shawnee Rd | 0.70mi | 4/2.5 | 3,928 (+15%) | 22mo | $950,000 | $242 | 24 |
Match score weights: distance 35% · size 25% · config 20% · recency 20%. Top-matched comps best support the ARV.
Projected returns pro-forma
-3.0% appreciation · 3.0% rent growth · sell at horizon
- IRR
- -4.6%
- Equity multiple
- 0.83×
- Total profit
- $-24,279
- Equity at exit
- $74,552
- IRR
- 5.1%
- Equity multiple
- 1.37×
- Total profit
- $52,154
- Equity at exit
- $43,231
Cash invested: $140,000 (down + closing). Projections, not guarantees.
Landlord ↔ Tenant lean methodology
- Overall (STATE)
- 62 Landlord-Friendly
- State Pennsylvania
- 62 Landlord-Friendly · EVEN
- County
- — inherits STATE
- City
- — inherits STATE
ZIP-level market 19041
- Home prices YoY
- -29.7%
- Active inventory
- 19
- Price-to-rent
- 7.6×
Monthly cashflow live
- Estimated rent
- $5,500 medium interval (Pro) →
- Mortgage (P&I)
- −$2,622
- Tax est. 1.5%
- −$625 /mo · $7,500/yr
- Insurance
- −$208
- HOA
- −$0
- Vacancy / Maint / Mgmt
- −$1,155
- Net cashflow
- $890
Break-even live
UW: 25.0% down · 7.5% · 30yr · 1.5% tax · 5.0% vac · 8.0% maint · 8.0% mgmt
Financing live
Cash to close
- Down payment
- $125,000
- Closing costs
- $15,000
- Reserves months
- —
- Total cash needed
- —
Loan-product check · same deal, 3 products live
Conventional
25% down · 7.5% · 30yr
- Down + closing
- —
- Monthly P&I
- —
- Monthly cashflow
- —
- DSCR
- —
- Eligible?
- —
Personal DTI + credit; lowest rate.
DSCR
20% down · 8.5% · 30yr
- Down + closing
- —
- Monthly P&I
- —
- Monthly cashflow
- —
- DSCR
- —
- Eligible?
- —
No personal income docs; deal must DSCR.
Hard money
10% down · 12.0% · 12mo
- Down + closing
- —
- Monthly P&I
- —
- Monthly cashflow
- —
- DSCR
- —
- Eligible?
- —
Short-term bridge; refi at stabilization.
Rent comps 1 comps
| Address | Beds | Baths | Sqft | Rent | $/sqft | DOM | Units | Dist |
|---|---|---|---|---|---|---|---|---|
| 901 Academy Ln Bryn Mawr, PA | 4.0 | 2.0 | 2410 | $5,500 | $2.28 | 1d | 1 | 1.47mi |
Listing history 13 events
-
2025-06-11status Pending
-
2025-06-11$500,000 Active
-
2024-08-05historical
-
2024-06-15price $1,200,000
-
2024-06-05price $1,750,000
-
2024-05-06price $1,549,000
-
2024-04-12price $1,599,000
-
2024-03-19status Active
-
2024-03-05historical
-
2024-02-16historical
-
2024-01-10historical
-
2023-10-23$1,950,000 Active
-
1978-12-01soldstatus $40,000
ⓘ Source: listings_history table (triggers on properties + properties_extension) + one-shot
backfill from property_details.listing_events for pre-trigger history.
Climate risk First Street
- Flood 1/10 Low FEMA zone X (unshaded) · 0% chance over 30 yrs
- Wildfire 1/10 Low
- Heat 6/10 Major 7 d/yr ≥102°F today · 15 d/yr by 30 yrs out
- Wind 6/10 Major 27% chance of damaging wind over 30 yrs
- Air quality 4/10 Moderate 3 unhealthy d/yr today · 6 by 30 yrs out
Nearby sold comps map
Loading sold comps map…
Walkable amenities ~0.75 mi
Loading nearby amenities…
Taxation est. · year 1
- Rental income
- $66,000
- − Mortgage interest
- −$28,008
- − Property taxes
- −$7,500
- − Insurance
- −$2,500
- − Repairs & maintenance
- −$5,280
- − Management
- −$5,280
- − Depreciation
- −$14,545
- Taxable income
- $2,887
- Est. tax owed @ 24.0%
- −$693
- After-tax cash flow
- $9,983/yr
For passive investors: Depreciation is non-cash, so a rental often shows a tax loss while cash-flowing — sheltering income. Rental losses are passive: they offset passive income freely, and up to $25,000/yr can offset ordinary (W-2) income if you actively participate and your MAGI is under $100k (phasing out to $0 by $150k); unused losses carry forward. On sale, claimed depreciation is recaptured at up to 25%, and gains may owe capital-gains tax (a 1031 exchange can defer both). Figures are a year-1 estimate at your 24.0% rate — not tax advice; consult a CPA.
Schools (NCES district)
- District
- Haverford Township SD
- NCES district ID
- 4211670
- Math proficiency
- 58% ▼ -13.00%
- Reading proficiency
- 78% ▼ -7.00%
- Median HH income
- $93,877
- Composite
- 61.83/100
- National rank
- #731
- State rank
- #20 of 539 in PA
Livability — Ardmore
- Score
- 94/100
- State rank
- #2
- US rank
- #6
Category grades
Schools grade is shown separately in the Schools card above.
Census & demographics
- City population
- 14,255
- Population (ZIP)
- 6,088
Population outlook (Delaware County) Hauer SSP2
- Today (2025)
- 577,490 people
- By 2030
- 581,243 · +0.6%
- By 2040
- 584,700 · +1.2%
- By 2050
- 586,581 · +1.6%
- By 2075
- 598,706 · +3.7%
- By 2100
- 590,823 · +2.3%
Race, ethnicity, and origin ACS 2023
- Neighborhood character
- Predominantly White (83%)
- Race & ethnicity
- White 83% Two or more races 6% Hispanic / Latino 4% Black 4% Asian 3%
- Common ancestry
- Scotch-Irish 6% Lithuanian 5% Romanian 5%
- Foreign-born
- 10% · Canada, China
- Languages at home
- 87% English-only · French/Haitian/Cajun 4% Spanish 3% Chinese 2%
Political lean MEDSL · Delaware
- 2024 margin
- Strong D (+23.7) · D 61.4% · R 37.6% · Other 1.0%
- 2008→2024 swing
- +2.3pp toward D · 2008: 21.4pp · 2024: 23.7pp
- All cycles
- 2024: D+23.7 2020: D+26.7 2016: D+22.0 2012: D+21.8 2008: D+21.4
Not yet ingested
- Civics
- —
Market trends
- HPI YoY
- ▼ -111.67%
- Current HPI
- 264.4
- Rent YoY
- —
- Metro
- —
- State GDP YoY
- ▲ 1.68%
- F500 in state
- 34
Industry mix (Fortune 500 HQ in PA)
| Industry | F500 HQs | Revenue |
|---|---|---|
| Healthcare | 2 | $309B |
|
||
| Insurance | 2 | $27B |
|
||
| Telecommunications / Media | 1 | $124B |
|
||
| Industrial Distribution | 1 | $22B |
|
||
| Financial Services | 1 | $20B |
|
||
| Chemicals / Materials | 1 | $18B |
|
||
Price history
+1150.0% since first listed13 events — show timeline
- 2025-06-11 Pending — BRIGHT MLS
- 2025-06-11 Listed $500,000 BRIGHT MLS
- 2024-08-05 Listing Removed — BRIGHT MLS
- 2024-06-15 Price Changed $1,200,000 BRIGHT MLS
- 2024-06-05 Price Changed $1,750,000 BRIGHT MLS
- 2024-05-06 Price Changed $1,549,000 BRIGHT MLS
- 2024-04-12 Price Changed $1,599,000 BRIGHT MLS
- 2024-03-19 Relisted — BRIGHT MLS
- 2024-03-05 Listing Removed — BRIGHT MLS
- 2024-02-16 Coming Soon — BRIGHT MLS
- 2024-01-10 Listing Removed — BRIGHT MLS
- 2023-10-23 Listed $1,950,000 BRIGHT MLS
- 1978-12-01 Sold (Public Records) $40,000 Public Records
Property tax history
+4.8%/yrLatest (2026): $32,250 · +69.4% YoY. Source: county tax records.
Cash-flow waterfall
monthlySold comps — $/sqft
last 12 mo · ≤1 miLoading sold comps…