 Duplex
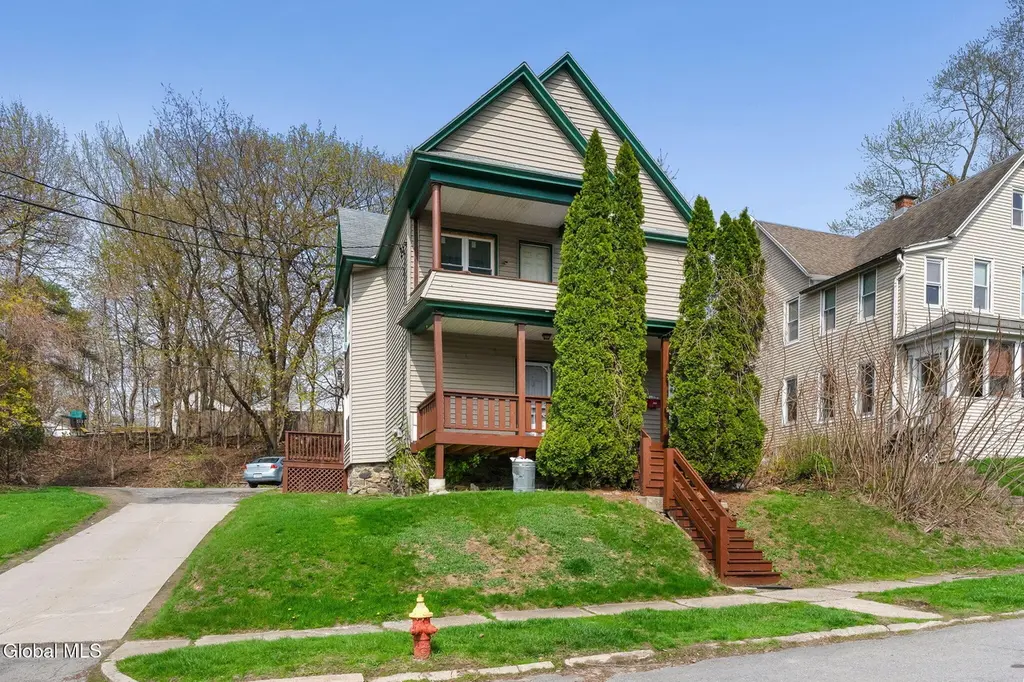
8 Mccleary Ave · Amsterdam, NY
Flood risk 1/10 · Minimal
- FEMA flood zone
- X (unshaded)
- Chance of flooding over 30 yrs
- 0.0%
- Est. flood insurance / yr
- $473 – $860
Fire risk 1/10 · Minimal
- Est. fire insurance / yr
- $691 – $1,283
Heat risk 3/10 · Minor
- Hot days now (above 94°F)
- 7 days/yr
- Hot days in 30 yrs
- 17 days/yr
Wind risk 3/10 · Minor
- Chance of severe wind over 30 yrs
- 5.0%
Air-quality risk 1/10 · Minimal
- Unhealthy air days now
- 0 days/yr
- Unhealthy air days in 30 yrs
- 0 days/yr
Risk factors via First Street. Map © Google.
Why this score? — see what drove the A grade
The composite is a weighted blend of 9 inputs, each scored 0–100. Each bar is that input's sub-score; the figure is the points it added to the 100-point composite (weight × sub-score).
- Cash flow +30.0/30.0
- ARV discount +15.0/15.0
- 1% rule +10.0/10.0
- DSCR +10.0/10.0
- Appreciation +10.0/10.0
- Livability +3.8/5.0
- Schools +3.2/10.0
- Rent growth +2.5/5.0
- Condition / age +2.5/5.0
$199,900
🖨 Deal sheet 📄 Offer letter ✓ Due diligence
Multi-family units
County records classify this as Multi-Family (2-4 Unit). Listing-text estimate: 2 units. confirmed
Listing remarks MLS
Large two-family home on a quiet street. Each apartment has a formal diningroom and three bedrooms, two car garage, hardwood floors, freshly painted decks. Beautiful woodwork, a must see property.
Key facts
- Large deck
- Expansive lot
- Renovated bathrooms
Tags
Property features AI
Finance
- Financial info: Property configured as a 2-unit building; Tenants pay hot water, heat, internet, cable TV, electricity and gas; Owner is responsible for water, trash collection and snow removal
Exterior
- Parking: Attached garage (heated) with 2 garage spaces; Additional paved driveway and off-street parking for a total of 10 parking spaces; Garage with workshop area, storage, and garage door opener
- Security: Security lights; Smoke detectors; Carbon monoxide detectors
- Utilities: Public water; Public sewer; Electric with circuit breakers; Cable connected
- Home design: Duplex; Multiple stories (separate units on different floors); Entry accessible from front porch
- Construction: Vinyl siding; Block, combination, and stone foundation; Shingle/asphalt roof; Built with below-grade finished area
- Exterior features: Front, rear and covered porches; Deck with pressure-treated components; Garden; Garage(s) structure on property
Interior
- Kitchen: Unit 1: 1 kitchen; Unit 2: 1 kitchen
- Bedrooms: Unit 1: 3 bedrooms (all on 1st floor); Unit 2: 3 bedrooms (all on 2nd floor)
- Flooring: Vinyl; Carpet; Ceramic tile; Hardwood; Laminate
- Bathrooms: Total: 2 full bathrooms; Unit 1: 1 full bathroom (1st floor); Unit 2: 1 full bathroom (2nd floor) plus 1 half bathroom
- Heating & cooling: Forced air heating (natural gas); Window cooling units
- Interior features: High-speed internet available; Built-in features; Ceramic tile baths; Sliding doors; Storm door(s); Screens; Double-pane, ENERGY STAR qualified, insulated windows
- Laundry & utility: Dedicated laundry room
Neighborhood map
What this means for you Summary
Snapshot
- This is a 2 × 3-bed/1.2-bath units multifamily listed at $200k.
Deal economics
- At list price, monthly cash flow is $1k ($13k/yr) — positive. Per door: $536/mo.
- The deal already cash-flows at list — no discount required.
- Meets the 1% rule at list price ($3k rent vs $200k).
- Recommended offer: $194k (3.0% below list) — sets the bar for market timing.
Location & tenants
- Location reads 75/100 on livability (#247 in NY, #3,884 nationally) — a middle-class / working-renter tenant base. Strengths: cost of living A+, housing A+, health & safety A+; Watch: crime F, employment F.
- Amsterdam City School District (town): math 35% / reading 41% proficiency, ranked #546 of 590 in NY (top 92%) — families likely to look elsewhere, expect single-tenant / working-renter base with shorter leases.
- Zoned schools: Amsterdam High School (math 75% / reading 82%, grade A-, #563 of 1,100 statewide, top 52%, 1,179 students, 68% FRL) — zoned schools average 68% FRL vs 40% district-wide (28 pts higher); higher-poverty schools than district average — tighter screening recommended.
- Zoned-school proficiency averages 78% at this address vs 38% district-wide (+40 pts) — the actual schools serving this property are materially stronger than the Amsterdam City School District average implies; a family-tenant draw the district grade alone would hide.
- Market conditions: 164 active listings in the ZIP; 210 units permitted in Montgomery County in 2024 (168 in 5+ unit buildings).
Forward outlook
- In year one you build about $21k of equity ($1k loan paydown + $20k appreciation (10.0% local appreciation)).
- Montgomery County population projected at -11% by 2050 — secular population decline; favor cash flow + early exit over multi-decade hold.
- At projected returns (10.0% appreciation + 3.0% rent growth), your $56k cash investment doubles in ~2 years — after that, you're playing with house money.
- By year 2, paydown + projected appreciation supports a ~$34k cash-out refi (75% LTV) — recoverable capital for the next deal without selling this one.
Negotiation context
- It's been on market 56 days — a 3% lower offer ($194k) is reasonable based on typical stale-listing flexibility.
- 5 sale attempts since 27y ago; this cycle's ask has dropped $50k (20%) from the opening price — seller is motivated, your offer sets the floor, not the list.
- Current owner paid $155k; 29% above their basis — modest negotiation headroom, anchor on the comps not their cost.
Risks & watch-outs
- Watch-outs: built in 1900 — expect roof / HVAC / electrical / plumbing capex.
Questions for the listing agent
- It's been on market 56 days. Have you received any prior offers? Is the seller open to a 3% concession, seller financing, or rate buy-down credit?
- Can we see the unit-by-unit rent roll, current vacancy, and any below-market leases? What's the average tenancy length?
- What capital expenditures (roof, boiler, parking lot, exteriors) have been made in the last 5 years, and what's planned in the next 2?
- Built in 1900 — when were the roof, HVAC, electrical panel, plumbing, and water heater last replaced?
- Is there a deadline driving the sale (1031 exchange, divorce, estate, relocation)? That informs how much negotiation room exists.
- Schools are D-rated, which usually means shorter tenancies and higher turnover. Who's the typical renter profile here, and what's been the actual vacancy rate?
- Crime grade is F in this area — have there been break-ins, vandalism, or insurance claims at this property in the last 3 years? What carrier currently insures it and at what premium?
- What's the average days-on-market for RENTAL listings here right now (not sales)? A rising rental-DOM trend means longer vacancies and softer asking-rent achievability than the comps imply.
- What's the recent tenant-quality profile in this submarket — average credit score on applications, eviction rate, late-payment / NSF rate, and stable-employment percentage? A property-management company in the area should have these aggregated.
- How much new apartment / multifamily construction is in the pipeline within 1–3 miles? Heavy new supply (>2% of stock underway) typically softens rents 12–24 months out; light construction supports rent growth.
Investment metrics
- 1% rule
- 1.53% ✓
- Cap rate
- 12.72%
- Cash-on-cash
- 22.97%
- DSCR
- 2.02
- GRM
- 5.4
CMA / ARV
- ARV (median comp)
- $258,129
- List price
- $199,900
- Delta
- -22.56%
- Verdict
- UNDERPRICED
- Comps
- 20 within 1.0 mi
Show comp detail 12 sales within ~0.75 mi
| Address | Dist | Beds/Ba | Sqft | Sold | Price | $/sf | Match |
|---|---|---|---|---|---|---|---|
| 10 4th St | 0.09mi | 6/2.0 | 2,460 (-3%) | 0mo | $220,000 | $89 | 91 |
| 232-234 Locust Ave | 0.40mi | 6/2.0 | 2,620 (+4%) | 7mo | $195,000 | $74 | 70 |
| 22 Cochrane Ave | 0.17mi | 6/2.0 | 2,600 (+3%) | 23mo | $229,000 | $88 | 68 |
| 387-389 Locust Ave | 0.46mi | 7/3.0 (+1) | 2,490 (-2%) | 8mo | $140,000 | $56 | 61 |
| 249 Forest Ave | 0.34mi | 5/3.0 (-1) | 2,590 (+2%) | 13mo | $175,000 | $68 | 60 |
| 356-358 Locust Ave | 0.42mi | 6/2.0 | 2,346 (-7%) | 10mo | $175,000 | $75 | 60 |
| 211 Forest Ave | 0.44mi | 6/2.0 | 2,225 (-12%) | 1mo | $190,000 | $85 | 58 |
| 26 Van Derveer St | 0.68mi | 6/2.0 | 2,300 (-9%) | 1mo | $148,000 | $64 | 52 |
| 298-300 Locust Ave | 0.38mi | 5/2.0 (-1) | 2,156 (-15%) | 10mo | $110,000 | $51 | 45 |
| 35 Milton Ave | 0.75mi | 7/2.5 (+1) | 2,384 (-6%) | 8mo | $240,000 | $101 | 42 |
| 38 Milton Ave | 0.72mi | 6/2.0 | 2,148 (-15%) | 2mo | $211,400 | $98 | 40 |
| 17 Pleasant Ave | 0.51mi | 5/2.0 (-1) | 2,888 (+14%) | 23mo | $220,000 | $76 | 28 |
Match score weights: distance 35% · size 25% · config 20% · recency 20%. Top-matched comps best support the ARV.
Projected returns pro-forma
10.0% appreciation · 3.0% rent growth · sell at horizon
- IRR
- 41.5%
- Equity multiple
- 4.16×
- Total profit
- $177,122
- Equity at exit
- $180,086
- IRR
- 35.8%
- Equity multiple
- 9.36×
- Total profit
- $467,994
- Equity at exit
- $388,362
Cash invested: $55,972 (down + closing). Projections, not guarantees.
Landlord ↔ Tenant lean methodology
- Overall (STATE)
- 15 Strongly Tenant-Friendly
- State New York
- 15 Strongly Tenant-Friendly · D+10
- County
- — inherits STATE
- City
- — inherits STATE
ZIP-level market 12010
- Home prices YoY
- 4.0%
- Active inventory
- 164
- Price-to-rent
- 10.9×
Monthly cashflow live
- Estimated rent
- $3,063 high interval (Pro) →
- Mortgage (P&I)
- −$1,048
- Tax from tax record
- −$217 /mo · $2,604/yr
- Insurance
- −$83
- HOA
- −$0
- Vacancy / Maint / Mgmt
- −$643
- Net cashflow
- $1,071
Break-even live
2-unit breakdown (identical units grouped — click to expand)
| Units | Beds | Baths | Est. rent |
|---|---|---|---|
| 2× units | 3 | 1.2 | $3,064 |
| #1 | 3 | 1.2 | $1,532 |
| #2 | 3 | 1.2 | $1,532 |
| Total (2 units) | $3,063 | ||
UW: 25.0% down · 7.5% · 30yr · 1.5% tax · 5.0% vac · 8.0% maint · 8.0% mgmt
Financing live
Cash to close
- Down payment
- $49,975
- Closing costs
- $5,997
- Reserves months
- —
- Total cash needed
- —
Loan-product check · same deal, 3 products live
Conventional
25% down · 7.5% · 30yr
- Down + closing
- —
- Monthly P&I
- —
- Monthly cashflow
- —
- DSCR
- —
- Eligible?
- —
Personal DTI + credit; lowest rate.
DSCR
20% down · 8.5% · 30yr
- Down + closing
- —
- Monthly P&I
- —
- Monthly cashflow
- —
- DSCR
- —
- Eligible?
- —
No personal income docs; deal must DSCR.
Hard money
10% down · 12.0% · 12mo
- Down + closing
- —
- Monthly P&I
- —
- Monthly cashflow
- —
- DSCR
- —
- Eligible?
- —
Short-term bridge; refi at stabilization.
Listing history 30 events
-
2026-06-18days on market $199,900 Active 56 DOM
-
2026-06-17days on market $199,900 Active 55 DOM
-
2026-06-16days on market $199,900 Active 54 DOM
-
2026-06-15days on market $199,900 Active 53 DOM
-
2026-06-14days on market $199,900 Active 51 DOM
-
2026-06-13days on market $199,900 Active 50 DOM
-
2026-06-10days on market $199,900 Active 48 DOM
-
2026-06-09days on market $199,900 Active 47 DOM
-
2026-06-08days on market $199,900 Active 46 DOM
-
2026-06-07days on market $199,900 Active 45 DOM
-
2026-06-03days on market $199,900 Active 41 DOM
-
2026-06-02days on market $199,900 Active 40 DOM
-
2026-06-01days on market $199,900 Active 39 DOM
-
2026-05-31days on market $199,900 Active 38 DOM
-
2026-05-31days on market $199,900 Active 37 DOM
-
2026-05-13price $239,900 1269-char remark
-
2026-04-22$249,900 Active 1269-char remark
-
2024-01-05soldstatus $155,000
-
2024-01-02soldstatus $155,000 Closed 196-char remark
Show marketing remark (196 chars)
Large two-family home on a quiet street. Each apartment has a formal diningroom and three bedrooms, two car garage, hardwood floors, freshly painted decks. Beautiful woodwork, a must see property.
-
2023-10-31status Pending 196-char remark
Show marketing remark (196 chars)
Large two-family home on a quiet street. Each apartment has a formal diningroom and three bedrooms, two car garage, hardwood floors, freshly painted decks. Beautiful woodwork, a must see property.
-
2023-10-18$150,000 Active 196-char remark
Show marketing remark (196 chars)
Large two-family home on a quiet street. Each apartment has a formal diningroom and three bedrooms, two car garage, hardwood floors, freshly painted decks. Beautiful woodwork, a must see property.
-
2021-05-21historical
-
2021-05-13price $107,300
-
2021-05-03$115,000 New
-
2006-07-17soldstatus $93,000
-
2006-05-31historical
-
2006-05-19$89,900
-
1999-12-10soldstatus $18,000
-
1999-03-11$23,500
-
1998-09-11soldstatus $43,000
ⓘ Source: listings_history table (triggers on properties + properties_extension) + one-shot
backfill from property_details.listing_events for pre-trigger history.
Tax reassessment forecast NY · Partial reset (capped growth)
- Current annual tax
- $2,604 · $217/mo
- Projected year-2 tax
- $2,991 · $249/mo
- Expected delta
- +$387/yr (+$32/mo · 14.9%)
ⓘ Screening estimate from a state-policy table — verify with the county assessor before closing.
Climate risk First Street
- Flood 1/10 Low FEMA zone X (unshaded) · 0% chance over 30 yrs
- Wildfire 1/10 Low
- Heat 3/10 Moderate 7 d/yr ≥94°F today · 17 d/yr by 30 yrs out
- Wind 3/10 Moderate 5% chance of damaging wind over 30 yrs
- Air quality 1/10 Low 0 unhealthy d/yr today · 0 by 30 yrs out
Nearby sold comps map
Loading sold comps map…
Walkable amenities ~0.75 mi
Loading nearby amenities…
Taxation est. · year 1
- Rental income
- $36,756
- − Mortgage interest
- −$11,198
- − Property taxes
- −$2,604
- − Insurance
- −$1,000
- − Repairs & maintenance
- −$2,940
- − Management
- −$2,940
- − Depreciation
- −$5,815
- Taxable income
- $10,259
- Est. tax owed @ 24.0%
- −$2,462
- After-tax cash flow
- $10,392/yr
For passive investors: Depreciation is non-cash, so a rental often shows a tax loss while cash-flowing — sheltering income. Rental losses are passive: they offset passive income freely, and up to $25,000/yr can offset ordinary (W-2) income if you actively participate and your MAGI is under $100k (phasing out to $0 by $150k); unused losses carry forward. On sale, claimed depreciation is recaptured at up to 25%, and gains may owe capital-gains tax (a 1031 exchange can defer both). Figures are a year-1 estimate at your 24.0% rate — not tax advice; consult a CPA.
Schools (NCES district)
- District
- Amsterdam City School District
- NCES district ID
- 3602970
- Math proficiency
- 35% ▲ 5.00%
- Reading proficiency
- 41% ▲ 10.00%
- Median HH income
- $41,735
- Composite
- 32.03/100
- National rank
- #5824
- State rank
- #546 of 590 in NY
Livability — Amsterdam
- Score
- 75/100
- State rank
- #247
- US rank
- #3884
Category grades
Schools grade is shown separately in the Schools card above.
Census & demographics
- Census place
- Amsterdam, NY
- City population
- 27,339
- Population (ZIP)
- 27,339
Population outlook (Montgomery County) Hauer SSP2
- Today (2025)
- 48,683 people
- By 2030
- 47,785 · -1.8%
- By 2040
- 45,492 · -6.6%
- By 2050
- 43,161 · -11.3%
- By 2075
- 38,134 · -21.7%
- By 2100
- 32,337 · -33.6%
Race, ethnicity, and origin ACS 2023
- Neighborhood character
- Predominantly White (68%)
- Race & ethnicity
- White 68% Hispanic / Latino 23% Two or more races 9% Black 4% Asian 1%
- Hispanic origin (detail)
- Mexican 2% Puerto Rican 18%
- Common ancestry
- Romanian 12% Lithuanian 2% Iranian 2%
- Foreign-born
- 5% · Canada
- Languages at home
- 86% English-only · Spanish 11% Russian/Polish/Slavic 1% Other Indo-European 1%
Political lean MEDSL · Montgomery
- 2024 margin
- Strong R (+28.7) · D 35.6% · R 64.4%
- 2008→2024 swing
- -20.6pp toward R · 2008: -8.1pp · 2024: -28.7pp
- All cycles
- 2024: R+28.7 2020: R+22.6 2016: R+26.5 2012: R+4.4 2008: R+8.1
Not yet ingested
- Civics
- —
Market trends
- HPI YoY
- ▲ 12.12%
- Current HPI
- 312.4966
- Rent YoY
- —
- Metro
- —
- State GDP YoY
- ▲ 2.60%
- F500 in state
- 92
Industry mix (Fortune 500 HQ in NY)
| Industry | F500 HQs | Revenue |
|---|---|---|
| Financial Services | 10 | $950B |
|
||
| Consumer Goods | 9 | $162B |
|
||
| Insurance | 4 | $225B |
|
||
| Telecommunications | 2 | $144B |
|
||
| Pharmaceuticals | 2 | $112B |
|
||
| Media / Entertainment | 2 | $69B |
|
||
Price history
+364.9% since first listed16 events — show timeline
- 2026-05-28 Price Changed $199,900 Global MLS
- 2026-05-13 Price Changed $239,900 Global MLS
- 2026-04-22 Listed $249,900 Global MLS
- 2024-01-05 Sold (Public Records) $155,000 Public Records
- 2024-01-02 Sold (MLS) $155,000 Global MLS
- 2023-10-31 Pending — Global MLS
- 2023-10-18 Listed $150,000 Global MLS
- 2021-05-21 Listing Removed — Global MLS
- 2021-05-13 Price Changed $107,300 Global MLS
- 2021-05-03 Listed $115,000 Global MLS
- 2006-07-17 Sold (MLS) $93,000 Global MLS
- 2006-05-31 Listing Removed — Global MLS
- 2006-05-19 Listed $89,900 Global MLS
- 1999-12-10 Sold (MLS) $18,000 Global MLS
- 1999-03-11 Listed $23,500 Global MLS
- 1998-09-11 Sold (Public Records) $43,000 Public Records
Property tax history
+1.1%/yrLatest (2025): $2,604 · -5.4% YoY. Source: county tax records.
Cash-flow waterfall
monthlySold comps — $/sqft
last 12 mo · ≤1 miLoading sold comps…