6026 Cheri Cir · Indianapolis city (balance), IN
Flood risk 1/10 · Minimal
- FEMA flood zone
- X (unshaded)
- Chance of flooding over 30 yrs
- 0.0%
- Est. flood insurance / yr
- $507 – $1,088
Fire risk 1/10 · Minimal
- Est. fire insurance / yr
- $717 – $1,331
Heat risk 4/10 · Minor
- Hot days now (above 102°F)
- 7 days/yr
- Hot days in 30 yrs
- 19 days/yr
Wind risk 2/10 · Minimal
- Chance of severe wind over 30 yrs
- 1.0%
Air-quality risk 3/10 · Minor
- Unhealthy air days now
- 2 days/yr
- Unhealthy air days in 30 yrs
- 3 days/yr
Risk factors via First Street. Map © Google.
Why this score? — see what drove the C- grade
The composite is a weighted blend of 9 inputs, each scored 0–100. Each bar is that input's sub-score; the figure is the points it added to the 100-point composite (weight × sub-score).
- Cash flow +20.8/30.0
- ARV discount +9.8/15.0
- DSCR +6.6/10.0
- 1% rule +4.9/10.0
- Schools +4.0/10.0
- Rent growth +3.4/5.0
- Livability +2.5/5.0
- Condition / age +2.5/5.0
- Appreciation +0.0/10.0
$257,000
🖨 Deal sheet 📄 Offer letter ✓ Due diligence
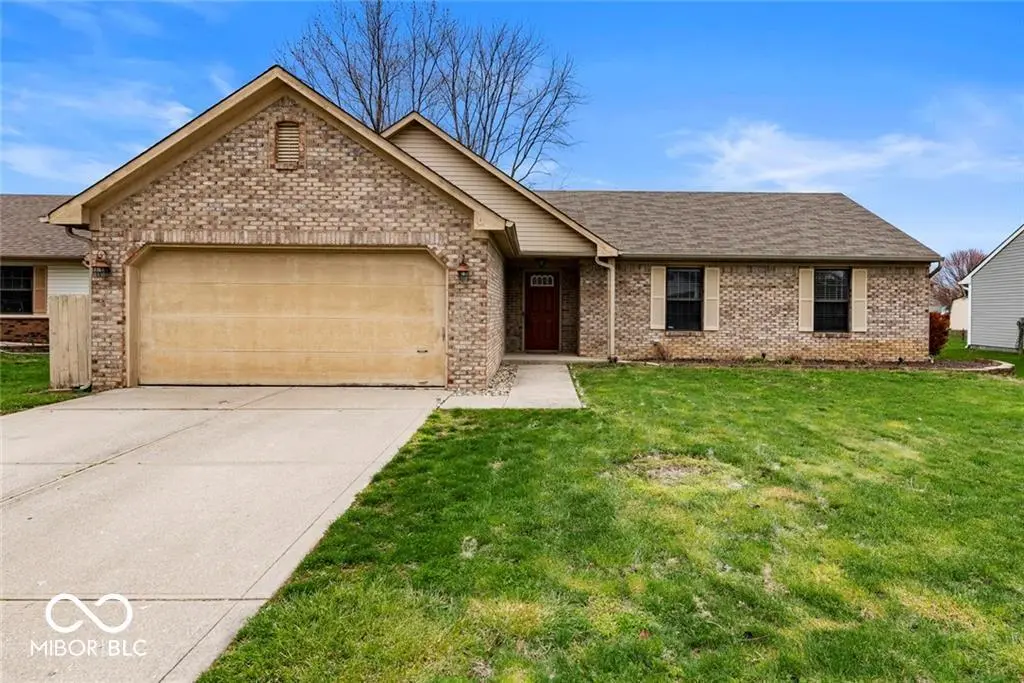
Listing remarks MLS
Don't miss this 3 bed, 2 bath, open-concept home with no HOA! This home sits on a cul-de-sac with a fully fenced back yard and a custom patio. Brand new paint and stainless steel appliances, this home is a must see!
Key facts
- Ranch home
- Custom patio
- Huge back yard
Tags
Property features AI
Exterior
- Parking: Attached 2-car garage (approximately 400 sq ft)
- Utilities: Public water; Municipal sewer connected; Municipal solid waste service
- Home design: Single-family residence; One story
- Construction: Vinyl with brick exterior; Slab foundation
- Exterior features: Patio; Fully fenced yard
Interior
- Kitchen: Dishwasher; Garbage disposal; Microwave with hood; Gas oven; Refrigerator; Pantry
- Bedrooms: Three bedrooms on the main level
- Bathrooms: Two full bathrooms (both on the main level)
- Heating & cooling: Forced air heating (natural gas); Central air conditioning
- Interior features: Attic access; Cathedral ceilings; Pantry; Walk-in closets; Laundry in unit; One fireplace in the living room
- Laundry & utility: Washer and dryer included; Laundry room on the main level; Gas water heater
Neighborhood map
What this means for you Summary
Snapshot
- This is a 3-bed/1.0-bath single-family listed at $257k.
Deal economics
- At list price, monthly cash flow is $351 ($4k/yr) — positive.
- The deal already cash-flows at list — no discount required.
- To meet the 1% rule (rent ≥ 1% of price), the offer needs to be $254k (1.1% below list).
- Recommended offer: $249k (3.0% below list) — sets the bar for market timing.
- Cap rate 7.9% vs local median 4.4% in Indianapolis city (balance) — top-decile yield for the area; either an underpriced asset or a hidden risk that comps aren't pricing in. Stress-test before assuming the spread holds.
Location & tenants
- Location reads: area grade C — affects rentability + tenant quality, not the cash-flow math above.
- Franklin Township Community School Corporation (urban): math 42% / reading 47% proficiency, ranked #87 of 301 in IN (top 29%) — families likely to look elsewhere, expect single-tenant / working-renter base with shorter leases.
- Market conditions: Rents rising (+3.8%/yr); 261 active listings in the ZIP; 11 comparable units currently listed for rent nearby; rentals leasing fast (median 4d on market — plan ~1-2 weeks tenant-placement turnaround); solid renter incomes; 1,906 units permitted in Marion County in 2024 (621 in 5+ unit buildings).
- This rent runs 39% of the median local income ($79k/yr) — at the standard rent-burdened threshold; future hikes will face affordability resistance.
Forward outlook
- Local home prices are declining (-3.0%/yr); year-one equity from $2k of loan paydown is wiped out by about $8k of value loss. Plan a longer hold.
- Marion County population projected at +18% by 2050 — long-run rental-demand tailwind backs the buy-and-hold thesis.
Negotiation context
- It's been on market 39 days — a 3% lower offer ($249k) is reasonable based on typical stale-listing flexibility.
- 6 sale attempts since 14y ago with the ask held roughly flat each time — persistent listings suggest the price (not the market) is what's stuck; bring a comps-based counter.
- Current owner paid $174k; 48% above their basis — modest negotiation headroom, anchor on the comps not their cost.
Questions for the listing agent
- It's been on market 39 days. Have you received any prior offers? Is the seller open to a 3% concession, seller financing, or rate buy-down credit?
- Is there a deadline driving the sale (1031 exchange, divorce, estate, relocation)? That informs how much negotiation room exists.
- What's the average days-on-market for RENTAL listings here right now (not sales)? A rising rental-DOM trend means longer vacancies and softer asking-rent achievability than the comps imply.
- What's the recent tenant-quality profile in this submarket — average credit score on applications, eviction rate, late-payment / NSF rate, and stable-employment percentage? A property-management company in the area should have these aggregated.
- How much new for-sale + rental construction is in the pipeline within 1–3 miles? Heavy new supply typically softens prices + rents 12–24 months out; constrained supply supports both.
Investment metrics
- 1% rule
- 0.99% ✗
- Cap rate
- 7.93%
- Cash-on-cash
- 5.86%
- DSCR
- 1.26
- GRM
- 8.4
CMA / ARV
- ARV (on-the-fly)
- $270,837
- Comps found
- 12
Show comp detail 12 sales within ~0.75 mi
| Address | Dist | Beds/Ba | Sqft | Sold | Price | $/sf | Match |
|---|---|---|---|---|---|---|---|
| 5914 Edelle Dr | 0.16mi | 3/2.0 | 1,392 (-3%) | 2mo | $265,000 | $190 | 82 |
| 7528 Gunyon Dr | 0.31mi | 3/2.0 | 1,408 (-2%) | 0mo | $265,000 | $188 | 78 |
| 7301 Muirfield Pl | 0.41mi | 3/2.0 | 1,420 (-1%) | 0mo | $280,500 | $198 | 75 |
| 6324 Muirfield Way | 0.29mi | 3/2.0 | 1,499 (+5%) | 2mo | $260,000 | $173 | 74 |
| 6032 Rockdell Dr | 0.29mi | 2/2.0 (-1) | 1,492 (+4%) | 1mo | $250,000 | $168 | 70 |
| 8036 Southern Trails Pl | 0.50mi | 3/2.0 | 1,424 (-1%) | 3mo | $255,000 | $179 | 69 |
| 8042 Southern Trails Pl | 0.52mi | 3/2.0 | 1,410 (-2%) | 2mo | $290,000 | $206 | 67 |
| 8244 Amarillo Dr | 0.57mi | 3/2.0 | 1,410 (-2%) | 1mo | $280,000 | $199 | 66 |
| 7518 Chris Anne Dr | 0.24mi | 3/2.0 | 1,244 (-13%) | 1mo | $257,550 | $207 | 62 |
| 6549 Southern Cross Dr | 0.73mi | 3/2.0 | 1,440 (+0%) | 4mo | $250,000 | $174 | 58 |
| 8480 Southern Springs Blvd | 0.75mi | 3/2.0 | 1,400 (-2%) | 1mo | $250,000 | $179 | 57 |
| 8456 Southern Springs Blvd | 0.74mi | 3/2.0 | 1,400 (-2%) | 3mo | $264,500 | $189 | 55 |
Match score weights: distance 35% · size 25% · config 20% · recency 20%. Top-matched comps best support the ARV.
Projected returns pro-forma
-3.0% appreciation · 3.78% rent growth · sell at horizon
- IRR
- -6.4%
- Equity multiple
- 0.76×
- Total profit
- $-17,304
- Equity at exit
- $38,320
- IRR
- 4.1%
- Equity multiple
- 1.31×
- Total profit
- $21,969
- Equity at exit
- $22,221
Cash invested: $71,960 (down + closing). Projections, not guarantees.
Landlord ↔ Tenant lean methodology
- Overall (STATE)
- 90 Strongly Landlord-Friendly
- State Indiana
- 90 Strongly Landlord-Friendly · R+11
- County
- — inherits STATE
- City
- — inherits STATE
ZIP-level market 46237
- Rents YoY
- 3.8%
- Active inventory
- 261
- Price-to-rent
- 8.4×
Monthly cashflow live
- Estimated rent
- $2,541 high interval (Pro) →
- Mortgage (P&I)
- −$1,348
- Tax from tax record
- −$202 /mo · $2,419/yr
- Insurance
- −$107
- HOA
- −$0
- Vacancy / Maint / Mgmt
- −$534
- Net cashflow
- $351
Break-even live
UW: 25.0% down · 7.5% · 30yr · 1.5% tax · 5.0% vac · 8.0% maint · 8.0% mgmt
Financing live
Cash to close
- Down payment
- $64,250
- Closing costs
- $7,710
- Reserves months
- —
- Total cash needed
- —
Loan-product check · same deal, 3 products live
Conventional
25% down · 7.5% · 30yr
- Down + closing
- —
- Monthly P&I
- —
- Monthly cashflow
- —
- DSCR
- —
- Eligible?
- —
Personal DTI + credit; lowest rate.
DSCR
20% down · 8.5% · 30yr
- Down + closing
- —
- Monthly P&I
- —
- Monthly cashflow
- —
- DSCR
- —
- Eligible?
- —
No personal income docs; deal must DSCR.
Hard money
10% down · 12.0% · 12mo
- Down + closing
- —
- Monthly P&I
- —
- Monthly cashflow
- —
- DSCR
- —
- Eligible?
- —
Short-term bridge; refi at stabilization.
Rent comps 11 comps
| Address | Beds | Baths | Sqft | Rent | $/sqft | DOM | Units | Dist |
|---|---|---|---|---|---|---|---|---|
| 7825 Jaclyn Dr Indianapolis, IN | 3.0 | 2.0 | 1244 | $1,875 | $1.51 | 4d | 1 | 0.13mi |
| 7703 Janel Ct Indianapolis, IN | 4.0 | 2.5 | 1824 | $4,950 | $2.71 | 23d | 1 | 0.14mi |
| 6404 Amarillo Way Indianapolis, IN | 3.0 | 2.0 | 1494 | $1,845 | $1.23 | 4d | 1 | 0.41mi |
| 6210 Carrie Cir Indianapolis, IN | 3.0 | 2.0 | 1226 | $1,890 | $1.54 | 4d | 1 | 0.43mi |
| 8107 Southern Trails Pl Indianapolis, IN | 4.0 | 2.0 | 1746 | $2,000 | $1.15 | 4d | 1 | 0.52mi |
| 7925 Carlington Rd Indianapolis, IN | 2.0 | 2.0 | 1455 | $2,079 | $1.43 | 1d | 17 | 0.65mi |
| 5945 Arlo Dr Indianapolis, IN | 1.0–3.0 | 1.0–2.0 | 1092 | $2,020 | $1.85 | 1d | 12 | 0.88mi |
| 7251 Windsor Lakes Dr Indianapolis, IN | 1.0–3.0 | 1.0–2.0 | 1103 | $1,800 | $1.63 | 1d | 36 | 0.98mi |
| 8035 Preidt Pl Indianapolis, IN | 2.0 | 1.0 | 947 | $1,235 | $1.30 | 23d | 1 | 1.43mi |
| 8120 Bravo Pl Apt 5 Indianapolis, IN | 2.0 | 1.5 | 947 | $1,235 | $1.30 | 23d | 1 | 1.45mi |
| 4701 Todd Rd Indianapolis, IN | 2.0 | 1.0–1.5 | 882 | $1,475 | $1.67 | 23d | 5 | 1.47mi |
Listing history 15 events
-
2026-05-31status $257,000 Pending 39 DOM
-
2026-04-21$260,000 Active
-
2024-12-28historical $1,600
-
2024-12-23$1,600
-
2020-04-29soldstatus $174,000 Sold 215-char remark
Show marketing remark (215 chars)
Don't miss this 3 bed, 2 bath, open-concept home with no HOA! This home sits on a cul-de-sac with a fully fenced back yard and a custom patio. Brand new paint and stainless steel appliances, this home is a must see!
-
2020-04-02status Pending 215-char remark
Show marketing remark (215 chars)
Don't miss this 3 bed, 2 bath, open-concept home with no HOA! This home sits on a cul-de-sac with a fully fenced back yard and a custom patio. Brand new paint and stainless steel appliances, this home is a must see!
-
2020-03-31status Active 215-char remark
Show marketing remark (215 chars)
Don't miss this 3 bed, 2 bath, open-concept home with no HOA! This home sits on a cul-de-sac with a fully fenced back yard and a custom patio. Brand new paint and stainless steel appliances, this home is a must see!
-
2020-03-28historical 215-char remark
Show marketing remark (215 chars)
Don't miss this 3 bed, 2 bath, open-concept home with no HOA! This home sits on a cul-de-sac with a fully fenced back yard and a custom patio. Brand new paint and stainless steel appliances, this home is a must see!
-
2020-03-28$170,000 Active 215-char remark
Show marketing remark (215 chars)
Don't miss this 3 bed, 2 bath, open-concept home with no HOA! This home sits on a cul-de-sac with a fully fenced back yard and a custom patio. Brand new paint and stainless steel appliances, this home is a must see!
-
2016-07-22soldstatus $142,000 Sold 508-char remark
Show marketing remark (508 chars)
Amazing opportunity on this super nice 3 BR, 2 bath open-concept home w fenced in backyard on quiet cul de sac! Newer Roof (2011), Furnace (2013), AC (2014). Kitchen w tiled floors, breakfast bar, and large pantry feats Stainless Fridge, stove, and microwave all less than 3 yrs old! Big laundry room! Lovely backyard w custom patio & park-like feel! Spacious living room w wood grain floors, wiring for surround sound, & cozy wood burning fireplace! Master feat walk in closet and full bath! NO HOA!
-
2016-06-12historical Active with Contingency 508-char remark
Show marketing remark (508 chars)
Amazing opportunity on this super nice 3 BR, 2 bath open-concept home w fenced in backyard on quiet cul de sac! Newer Roof (2011), Furnace (2013), AC (2014). Kitchen w tiled floors, breakfast bar, and large pantry feats Stainless Fridge, stove, and microwave all less than 3 yrs old! Big laundry room! Lovely backyard w custom patio & park-like feel! Spacious living room w wood grain floors, wiring for surround sound, & cozy wood burning fireplace! Master feat walk in closet and full bath! NO HOA!
-
2016-06-07$139,900 Active 508-char remark
Show marketing remark (508 chars)
Amazing opportunity on this super nice 3 BR, 2 bath open-concept home w fenced in backyard on quiet cul de sac! Newer Roof (2011), Furnace (2013), AC (2014). Kitchen w tiled floors, breakfast bar, and large pantry feats Stainless Fridge, stove, and microwave all less than 3 yrs old! Big laundry room! Lovely backyard w custom patio & park-like feel! Spacious living room w wood grain floors, wiring for surround sound, & cozy wood burning fireplace! Master feat walk in closet and full bath! NO HOA!
-
2012-07-17historical
-
2012-07-13soldstatus $106,900
-
2012-05-22$109,900
ⓘ Source: listings_history table (triggers on properties + properties_extension) + one-shot
backfill from property_details.listing_events for pre-trigger history.
Tax reassessment forecast IN · Partial reset (capped growth)
- Current annual tax
- $2,419 · $202/mo
- Projected year-2 tax
- $2,419 · $202/mo
- Expected delta
- $0/yr ($0/mo · 0.0%)
ⓘ Screening estimate from a state-policy table — verify with the county assessor before closing.
Climate risk First Street
- Flood 1/10 Low FEMA zone X (unshaded) · 0% chance over 30 yrs
- Wildfire 1/10 Low
- Heat 4/10 Moderate 7 d/yr ≥102°F today · 19 d/yr by 30 yrs out
- Wind 2/10 Low 100% chance of damaging wind over 30 yrs
- Air quality 3/10 Moderate 2 unhealthy d/yr today · 3 by 30 yrs out
Nearby sold comps map
Loading sold comps map…
Walkable amenities ~0.75 mi
Loading nearby amenities…
Taxation est. · year 1
- Rental income
- $30,495
- − Mortgage interest
- −$14,396
- − Property taxes
- −$2,419
- − Insurance
- −$1,285
- − Repairs & maintenance
- −$2,440
- − Management
- −$2,440
- − Depreciation
- −$7,476
- Taxable income
- $39
- Est. tax owed @ 24.0%
- −$9
- After-tax cash flow
- $4,205/yr
For passive investors: Depreciation is non-cash, so a rental often shows a tax loss while cash-flowing — sheltering income. Rental losses are passive: they offset passive income freely, and up to $25,000/yr can offset ordinary (W-2) income if you actively participate and your MAGI is under $100k (phasing out to $0 by $150k); unused losses carry forward. On sale, claimed depreciation is recaptured at up to 25%, and gains may owe capital-gains tax (a 1031 exchange can defer both). Figures are a year-1 estimate at your 24.0% rate — not tax advice; consult a CPA.
Schools (NCES district)
- District
- Franklin Township Community School Corporation
- NCES district ID
- 1803750
- Math proficiency
- 42% ▼ -12.00%
- Reading proficiency
- 47% ▼ -6.00%
- Median HH income
- $67,825
- Composite
- 39.91/100
- National rank
- #3852
- State rank
- #87 of 301 in IN
Livability — Indianapolis city (balance)
No livability data for this city. (Only ~50 U.S. cities are tracked.)
Census & demographics
- Census place
- Indianapolis city (balance), IN
- County
- Marion County · 998,460 people
- City population
- 881,119
- Metro
- Indianapolis-Carmel-Anderson, IN
- Population (ZIP)
- 43,473
- Household income
- $79,078
- Rent vs Own
- Severe rent burden
- 1245.0
Population outlook (Marion County) Hauer SSP2
- Today (2025)
- 1,025,572 people
- By 2030
- 1,065,727 · +3.9%
- By 2040
- 1,141,577 · +11.3%
- By 2050
- 1,208,920 · +17.9%
- By 2075
- 1,367,288 · +33.3%
- By 2100
- 1,438,201 · +40.2%
Race, ethnicity, and origin ACS 2023
- Neighborhood character
- Predominantly White (71%)
- Race & ethnicity
- White 71% Asian 13% Hispanic / Latino 7% Two or more races 6% Black 5%
- Hispanic origin (detail)
- Mexican 6%
- Common ancestry
- Italian 2% Lithuanian 2% Romanian 2%
- Foreign-born
- 12% · Canada, Philippines
- Languages at home
- 84% English-only · Other Asian/Pacific 5% Spanish 5% Other Indo-European 4%
Political lean MEDSL · Marion
- 2024 margin
- Strong D (+27.7) · D 63.0% · R 35.3% · Other 1.7%
- 2008→2024 swing
- -0.7pp no change · 2008: 28.4pp · 2024: 27.7pp
- All cycles
- 2024: D+27.7 2020: D+29.1 2016: D+22.8 2012: D+22.2 2008: D+28.4
Not yet ingested
- Civics
- —
Market trends
- HPI YoY
- ▼ -180.33%
- Current HPI
- 238.9661
- Rent YoY
- ▲ 3.78%
- Metro
- Indianapolis-Carmel-Anderson, IN
- State GDP YoY
- ▲ 2.90%
- F500 in state
- 18
Industry mix (Fortune 500 HQ in IN)
| Industry | F500 HQs | Revenue |
|---|---|---|
| Industrial Machinery | 2 | $37B |
|
||
| Healthcare | 1 | $177B |
|
||
| Pharmaceuticals | 1 | $45B |
|
||
| Metals / Steel | 1 | $18B |
|
||
| Agriculture | 1 | $17B |
|
||
| Packaging | 1 | $12B |
|
||
Price history
+136.6% since first listed14 events — show timeline
- 2026-04-21 Listed $260,000 MIBOR as Distributed by MLS Grid
- 2024-12-28 Rental Removed $1,600 MIBOR
- 2024-12-23 Listed for Rent $1,600 MIBOR
- 2020-04-29 Sold (MLS) $174,000 MIBOR as Distributed by MLS Grid
- 2020-04-02 Pending — MIBOR as Distributed by MLS Grid
- 2020-03-31 Relisted — MIBOR as Distributed by MLS Grid
- 2020-03-28 Listing Removed — MIBOR as Distributed by MLS Grid
- 2020-03-28 Listed $170,000 MIBOR as Distributed by MLS Grid
- 2016-07-22 Sold (MLS) $142,000 MIBOR as Distributed by MLS Grid
- 2016-06-12 Contingent — MIBOR as Distributed by MLS Grid
- 2016-06-07 Listed $139,900 MIBOR as Distributed by MLS Grid
- 2012-07-17 Listing Removed — MIBOR as Distributed by MLS Grid
- 2012-07-13 Sold (MLS) $106,900 MIBOR as Distributed by MLS Grid
- 2012-05-22 Listed $109,900 MIBOR as Distributed by MLS Grid
Property tax history
+7.0%/yrLatest (2025): $2,419 · -5.1% YoY. Source: county tax records.
Cash-flow waterfall
monthlySold comps — $/sqft
last 12 mo · ≤1 miLoading sold comps…